


Introduction
Historical temperature records indicate that the Antarctic Peninsula region has been warming much more rapidly than the global mean (3.7 ± 1.6 vs 0.6 ± 0.2°C century-1, respectively) for reasons which remain poorly understood (Houghton et al. Reference Houghton, Ding, Griggs, Noguer, van den Linden, Dai, Maskell and Johnson2001, Vaughan et al. Reference Vaughan, Marshall, Connolley, Parkinson, Mulvaney, Hodgson, King, Pudsey and Turner2003). Furthermore, comparison of satellite data from 1979 to 1999 indicates that sea ice coverage has decreased significantly on both sides of the Peninsula (Parkinson et al. Reference Parkinson2002). Meanwhile, seven major ice shelves surrounding the Peninsula have retreated over the last few decades, with the largest collapse occurring in March 2002 (Larsen B ice shelf; Scambos et al. Reference Scambos, Hulbe and Fahnestock2003). Finally, 87% of 244 glaciers examined throughout the Antarctic Peninsula region have retreated over the last 61 years, a trend which has been causally linked to warming temperatures (Cook et al. Reference Cook, Fox, Vaughan and Ferrigno2005). This raises many important questions including: is the recent rapid warming in the Antarctic Peninsula unprecedented or a natural part of the Earth's climate variability?
One way to put this recent warming into perspective is to examine Late Pleistocene to Holocene proxy climate records contained in stratified deposits such as sediments and ice cores. Ice cores suggest that the recent warming is unprecedented; however, the longest of these records from the Antarctic Peninsula currently only extends 1200 years back in time (Dyer Plateau; Thompson et al. Reference Thompson, Mosley-Thompson, Mulvaney, Dai, Lin, Davis and Raymond1994, Mosley-Thompson & Thompson Reference Mosley-Thompson and Thompson2003). Recent high resolution multi-proxy studies from sediment cores surrounding the Peninsula have successfully captured longer records, extending through the Holocene (i.e. > 10 000 years) and identifying climatic events such as the Mid-Holocene Climatic Optimum and the Neoglacial (e.g. Leventer et al. Reference Leventer, Domack, Ishman, Brachfeld, McClennen and Manley1996, Shevenell et al. Reference Shevenell, Domack and Kernan1996, Pudsey & Evans Reference Pudsey and Evans2001, Taylor et al. Reference Taylor, Whitehead and Domack2001, Yoon et al. Reference Yoon, Park, Kim and Kan2002, Domack et al. Reference Domack, Leventer, Root, Ring, Williams, Carlson, Hirshorn, Wright, Gilbert and Burr2003, Reference Domack, Duran, Leventer, Ishman, Doane, McCallum, Amblas, Ring, Gilbert and Prentice2005, Bentley et al. Reference Bentley, Hodgson, Sugden, Roberts, Smith, Leng and Bryant2005, Pudsey et al. Reference Pudsey, Murray, Appleby and Evans2006). In addition, the Ocean Drilling Program Site 1098 made significant advances with a long, ~50 m core obtained from the Palmer Deep, identifying these climatic events as well as the Little Ice Age and the late deglacial period (e.g. Domack et al. Reference Domack, Leventer, Dunbar, Taylor, Brachfeld and Sjunneskog2001, Leventer et al. Reference Leventer, Domack, Barkoukis, McAndrews and Murray2002, Shevenell et al. 2002, Sjunneskog & Taylor Reference Sjunneskog and Taylor2002, Taylor & Sjunneskog Reference Taylor and Sjunneskog2002, Brachfeld et al. Reference Brachfeld, Banerjee, Guyodo and Acton2002, Warner & Domack Reference Warner and Domack2002).
Located on the northern tip of the Antarctic Peninsula, the Bransfield Strait (herein referred to by the geological name, the Bransfield Basin) region is the warmest and perhaps the most sensitive portion of the Peninsula, where we see the onset of modern glacial retreat, which began in this northerly region and propagated southward (Cook et al. Reference Cook, Fox, Vaughan and Ferrigno2005). In addition, the Bransfield Basin has a unique oceanography, located at the confluence of relatively warm Bellingshausen and cold Weddell Sea surface and transitional water masses. Several marine sediment studies have recovered proxy records from this important northerly region; however, these studies have largely been limited to the last ~2000–3000 years (e.g. Bárcena et al. Reference Bárcena, Gersonde, Ledesma, Fabrés, Calafat, Canals, Seirro and Flores1998, Reference Bárcena, Isla, Plaza, Flores, Sierro, Masque, Sanchez-Cabeza and Palanques2002, Fabrés et al. Reference Fabrés, Calafat, Canals, Bárcena and Flores2000, Khim et al. Reference Khim, Yoon, Kang and Bahk2002). We present analysis of sedimentology and diatom assemblages from a piston core (NBP02-01 PC-61, hereafter PC-61) recovered in the western Bransfield Basin that extends back to ~10 650 calendar years before present (cal yr bp - all ages are reported in cal yr bp, calibrated by CALIB v5.0, unless otherwise noted; Stuiver et al. Reference Stuiver, Reimer, Bard, Beck, Burr, Hughen, Kromer, McCormac, Van Der Plicht and Spurk1998) in an attempt to reconstruct the Late Pleistocene–Holocene climate history for this region. In addition, we present details of sedimentary analysis, including X-ray radiographs, grain size, and sand petrography, to assist in unifying the wide variety of sediment facies interpretations reported in the literature and to highlight the unique sedimentation patterns observed in the Bransfield Basin (Anderson Reference Anderson1999).
Background
Marine sediment studies
Until recently, few high-resolution late-Pleistocene–Holocene palaeoclimatic data existed from the Southern Ocean. A study by Shevenell et al. (Reference Shevenell, Domack and Kernan1996) reported at least two warm events during the mid-Holocene (Hypsithermal), at ~8000 cal yr bp and ~3000–5000 cal yr bp. This interpretation was based on increased total organic carbon (TOC) values suggesting increased biologic activity, probably spurred by warmer water conditions and reduced sea ice. Leventer et al. (Reference Leventer, Domack, Ishman, Brachfeld, McClennen and Manley1996) used a variety of proxy indicators in a sediment record from the Palmer Deep extending back to 3700 14C yr (1300 yr corrected) to identify the termination of the mid-Holocene climate optimum (at 2500 cal yr bp) and the Little Ice Age. Leventer et al. (Reference Leventer, Domack, Ishman, Brachfeld, McClennen and Manley1996) included spectral analysis of diatoms, foraminifera, dry bulk density, and magnetic susceptibility, identifying 200–300 year cycles in climate change, possibly driven by global forcing mechanisms such as variable solar input (Leventer et al. Reference Leventer, Domack, Ishman, Brachfeld, McClennen and Manley1996).
Ocean Drilling Program Site 1098 in the Palmer Deep largely built on work from Leventer et al. (Reference Leventer, Domack, Ishman, Brachfeld, McClennen and Manley1996), extending proxy records back to 13 180 cal yr bp. Ishman & Sperling (Reference Ishman and Sperling2002) examined foraminifera data, suggesting changes in deep water conditions on the inner continental shelf during the Holocene (9000–3700 cal yr bp) with saline shelf waters dominating, in contrast to the circumpolar deep waters of today. Shevenell & Kennett (Reference Shevenell and Kennett2002) found similar changes in deep water masses; however, they call for changes in wind strength or direction rather than thermohaline reorganizations as the cause of these changes. Taylor & Sjunneskog (Reference Taylor and Sjunneskog2002) used multivariate statistical methods to define five diatom assemblages in the Palmer Deep core, each from a distinct climatic regime. The transitions between these assemblages coincide closely to changes in magnetic susceptibility (Domack et al. Reference Domack, Leventer, Dunbar, Taylor, Brachfeld and Sjunneskog2001), but suggest a slightly earlier onset of the Neoglacial (4400 vs 3000 cal yr bp). Using total diatom abundance data, Sjunneskog & Taylor (Reference Sjunneskog and Taylor2002) noted the occurrence of a cooling period between 6000 to 5000 cal yr bp. Domack et al. (Reference Domack, Leventer, Root, Ring, Williams, Carlson, Hirshorn, Wright, Gilbert and Burr2003) compared sediment data from the Palmer Deep and work by Shevenell et al. (Reference Shevenell, Domack and Kernan1996) to several other cores from the western Antarctic Peninsula and Andvord Bay, demonstrating the occurrence of the Little Ice Age, Neoglacial, and Mid-Holocene climate optimum throughout the Peninsula area. In addition, Domack et al. (Reference Domack, Leventer, Root, Ring, Williams, Carlson, Hirshorn, Wright, Gilbert and Burr2003) suggested that the modern increase in temperatures and associated sediment proxies in the Antarctic Peninsula is much larger than the natural climate variability for the last ~1200 years, but not as large as the mid-Holocene climate optimum. An excellent summary figure of the various timings of the mid-Holocene climate optimum around Antarctica can be found in Taylor & Sjunneskog (Reference Taylor and Sjunneskog2002).
Other studies focused on the stability of the floating ice shelves during the Holocene. Pudsey & Evans (Reference Pudsey and Evans2001) and recent work by Pudsey et al. (Reference Pudsey, Murray, Appleby and Evans2006) documented changes in provenance of ice-rafted debris which indicate that the Prince Gustav Ice Shelf and the northern Larsen A Ice Shelf disappeared around 5000 to 2000 14C yr bp (surface corrected), perhaps a delayed response to the mid-Holocene climate optimum. Bentley et al. (Reference Bentley, Hodgson, Sugden, Roberts, Smith, Leng and Bryant2005) examined two cores from an epishelf lake and suggested that the George VI Ice Shelf collapsed during the early Holocene, from 9595 to 7945 cal yr bp. Alternately, Domack et al. (Reference Domack, Duran, Leventer, Ishman, Doane, McCallum, Amblas, Ring, Gilbert and Prentice2005) suggested that the Larsen B Ice Shelf was stable throughout the Holocene, and they attribute this stability to the more southerly (colder) location of this ice shelf (relative to Larsen A and Prince Gustav Ice Shelves). Hence, the recent collapse of the Larsen B Ice Shelf in March of 2002 is the result of a warming trend that is unprecedented for the Holocene epoch (Domack et al. Reference Domack, Duran, Leventer, Ishman, Doane, McCallum, Amblas, Ring, Gilbert and Prentice2005).
Despite the advances made in analysis of high resolution records, marine sediment studies in the Bransfield Basin have been limited to the past ~2000–3000 years. Bárcena et al. (Reference Bárcena, Gersonde, Ledesma, Fabrés, Calafat, Canals, Seirro and Flores1998) and Fabrés et al. (Reference Fabrés, Calafat, Canals, Bárcena and Flores2000) identified several (5 or 6) Neoglacial events in various proxies from two cores, including diatoms, radiolarians, TOC, opal, and nitrogen content. These events displayed a 200–300 year periodicity similar to that identified by Leventer et al. (Reference Leventer, Domack, Ishman, Brachfeld, McClennen and Manley1996), which they correlated with changes in solar irradiance. Bárcena et al. (Reference Bárcena, Isla, Plaza, Flores, Sierro, Masque, Sanchez-Cabeza and Palanques2002) continued this work, documenting four Neoglacial episodes with 200–300 year periodicity in two cores in the western Bransfield Basin. Finally, Khim et al. (Reference Khim, Yoon, Kang and Bahk2002) examined a core from the eastern Bransfield Basin and identified the Little Ice Age and Medieval Warm Period in magnetic susceptibility and other sedimentary data. These studies demonstrated significant late-Holocene climate variability throughout the Bransfield Basin region, but did not cover the earliest Holocene or the late deglacial time period.
Physical setting - geology and physiology
The Antarctic Peninsula is a Mesozoic to Cenozoic magmatic arc that formed above a south-east dipping subduction zone, with rifting in the Bransfield Basin beginning about 4–5 million years ago (Fig. 1; Barker et al. Reference Barker, Dalziel, Storey and Tingey1991). The Bransfield Basin is a series of semi-enclosed basins totalling approximately 450 km long by 100 km wide and is the result of back-arc rifting with a component of sinistral simple shear between the Antarctic Peninsula and the South Shetland Islands (Barker et al. Reference Barker, Dalziel, Storey and Tingey1991, Jeffers et al. Reference Jeffers, Anderson and Lawver1991, Gonzalez-Casado et al. Reference González-Casado, Giner-Robles and López-Martinez2000). Detailed multibeam swath bathymetry data reveal three main sub-basins just under 1000–2000 m deep, separated by sills about 500 m deep, with a discontinuous chain of volcanoes and active hydrothermal vents along the axis of the central basin (Gràcia et al. Reference Gràcia, Canals, Farran, Prieto and Sorribas1996, Lawver et al. Reference Lawver, Sloan, Klepeis and Von Herzen1996, Klinkhammer et al. Reference Klinkhammer, Chin, Keller, Daehlmann, Sahling, Sarthou, Petersen, Smith and Wilson2001). Immediately north of the Bransfield Basin are the South Shetland Islands, separated by a narrow (~10 km) continental shelf area. Immediately to the south, the Antarctic Peninsula continental shelf is considerably wider (50–75 km), composed of thick sequences of glacially eroded sediments and irregular basement fault blocks (Banfield & Anderson Reference Banfield and Anderson1995, Prieto et al. Reference Prieto, Ercilla, Canals and de Batist1999).
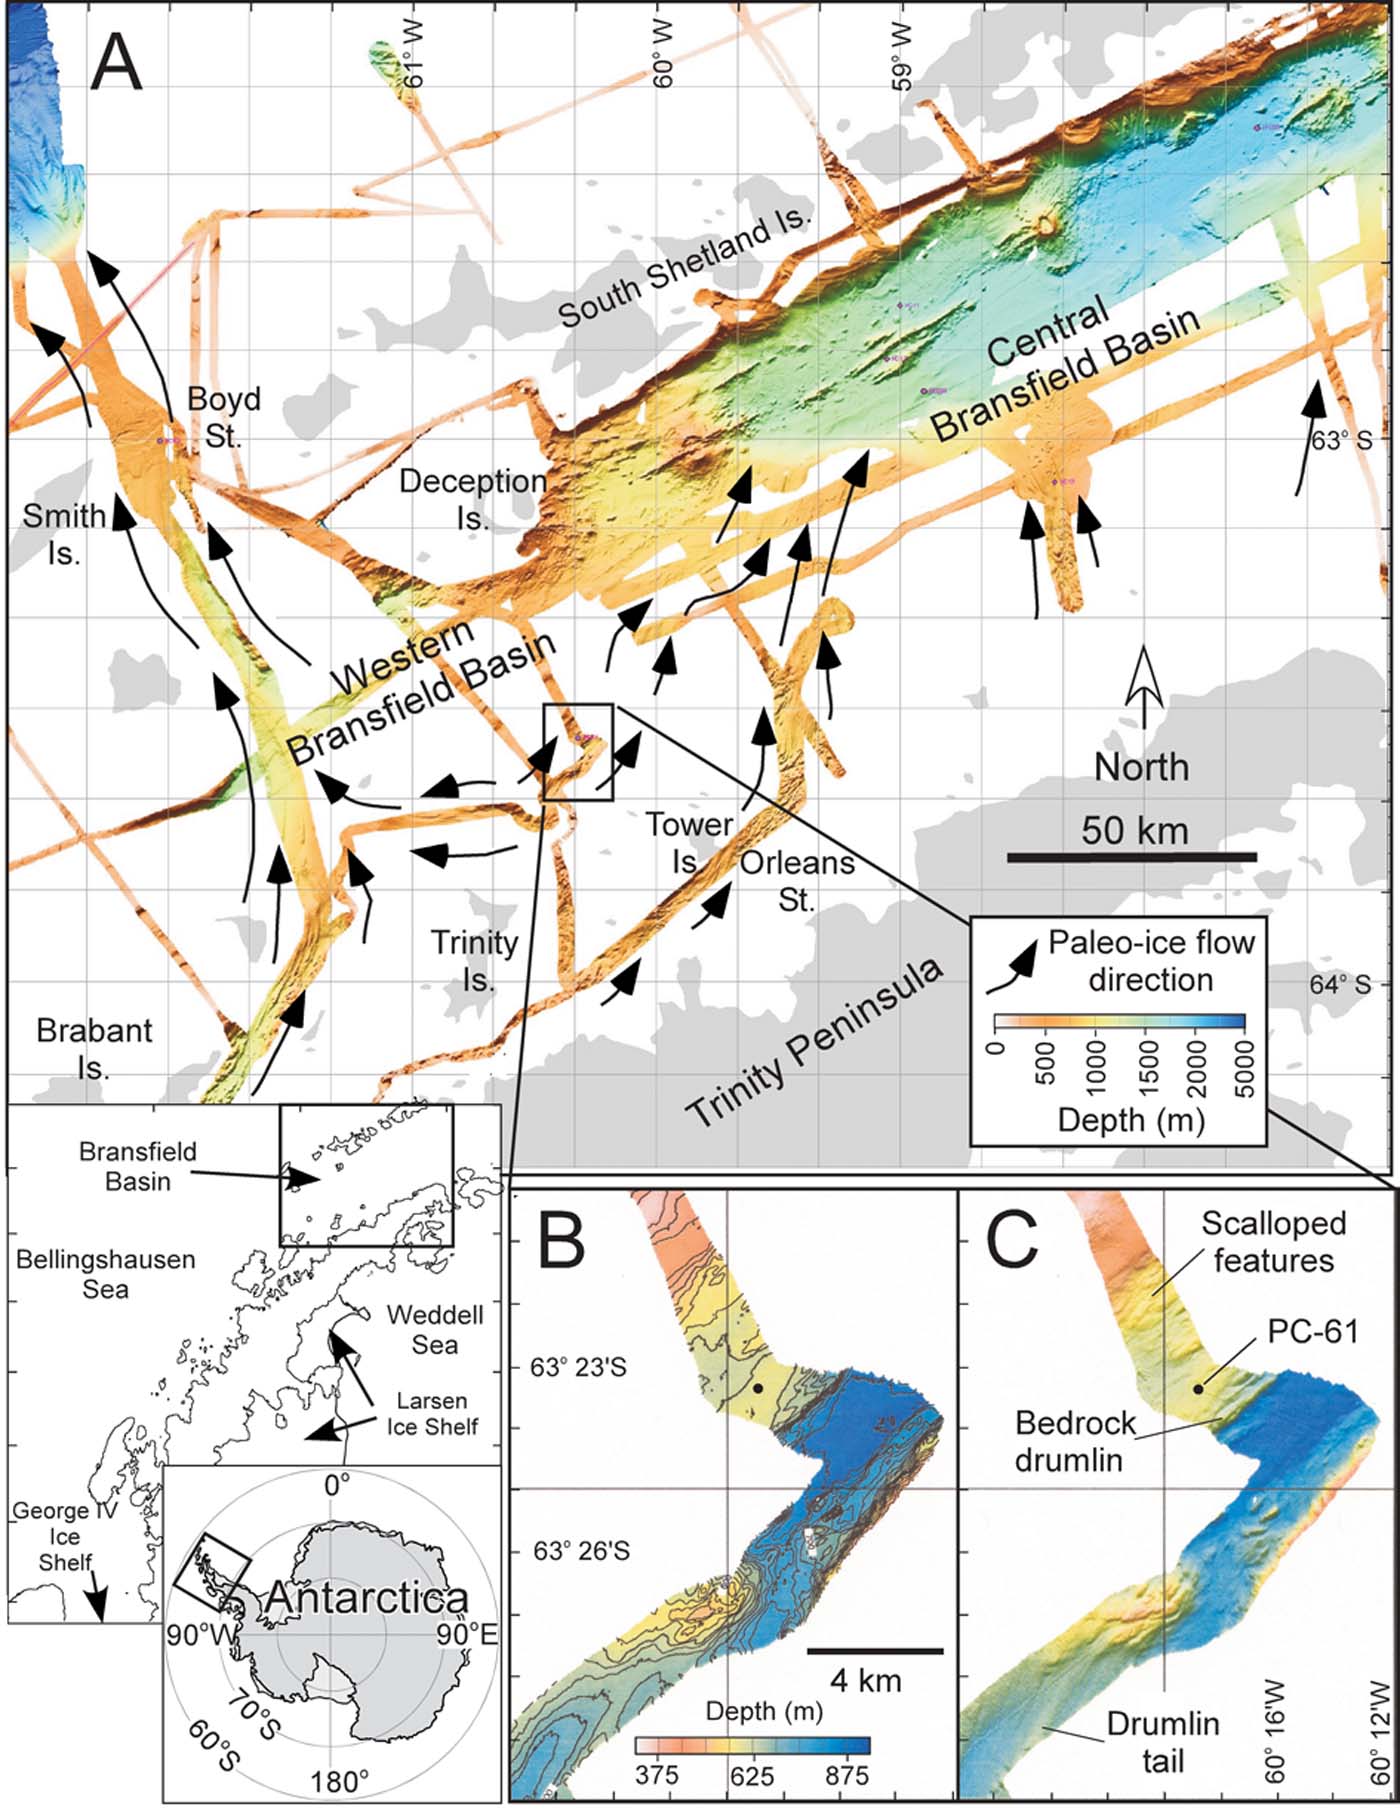
Fig. 1. The Bransfield Basin (also known as the Bransfield Strait) study area in the northern Antarctic Peninsula, core location, and multibeam data. a. Multibeam swath bathymetry data for the region, including the central basin and slightly shallower western basins, with interpreted palaeo-ice stream flow directions (black arrows). b. Contoured depth data with core NBP02-01 PC-61 collected on a small bathymetric high. c. Shaded relief for core location with various subglacial geomorphic features identified.
During the Last Glacial Maximum, the Antarctic Peninsula Ice Sheet covered the Antarctic Peninsula and the South Shetland Islands and was grounded on the continental shelf in the Bransfield Basin (Banfield & Anderson Reference Banfield and Anderson1995, Bentley & Anderson Reference Bentley and Anderson1998, Canals et al. Reference Canals, Casamor, Urgeles, Calafat, Domack, Baraza, Farran and De Batist2002, Heroy & Anderson Reference Heroy and Anderson2005). West of Livingston Island, a large ice stream flowed northward from the Gerlache Strait across the 1000 m deep western Bransfield Basin, to the shelf break directly north of Smith Island (Fig. 1; Canals et al. Reference Canals, Urgeles and Calafat2000, Evans et al. Reference Evans, Dowdeswell and Ó Cofaigh2004). To the east, several small ice streams flowed northward from the Trinity Peninsula to the shelf break of the central Bransfield Basin (Canals et al. Reference Canals, Casamor, Urgeles, Calafat, Domack, Baraza, Farran and De Batist2002, Heroy & Anderson Reference Heroy and Anderson2005). Conservative estimates suggest grounded ice retreated from the outer shelf of the Bransfield Basin by 17 340 cal yr bp and by 9040 cal yr bp from the middle shelf (Banfield & Anderson Reference Banfield and Anderson1995).
Physical setting - oceanography and climate
Surface circulation in the Bransfield Basin primarily comes from the Bellingshausen Sea and the Weddell Sea. Waters coming from the Weddell Sea are generally colder and more saline, while waters coming from the Bellingshausen are warmer and less saline (Tokarczyk Reference Tokarczyk1987, García et al. Reference García, Castro, Ríos, Doval, Rosón, Gomis and López2002). Deep water masses follow a similar pattern, with colder Weddell Sea Transitional Waters dominating the Bransfield Basin and flowing west to approximately Trinity Island (Fig. 1; Tokarczyk Reference Tokarczyk1987). Circumpolar Warm Deep Water enters the western Bransfield Basin from the Bellingshausen Sea, but is blocked from entering the central or eastern Bransfield Basin by shallow sills (Tokarczyk Reference Tokarczyk1987).
Strong thermal gradients exist across the Antarctic Peninsula, with average annual temperatures for the Bransfield Basin between -3 to -5°C (Reynolds Reference Reynolds1981). The South Shetland Islands are the warmest location in the Antarctic Peninsula region, followed by the Trinity Peninsula to the south, both of which are considered sub-polar marine climate regimes. In addition, the western side of the Antarctic Peninsula is characterized by high precipitation, relative to the eastern side, due to cyclonic storms generated in the Bellingshausen Sea and the rain shadow effect (Anderson Reference Anderson1999). High temperature and precipitation gradients across the Antarctic Peninsula result in the most dynamic climatic system in Antarctica, as is documented in ice cores (Peel Reference Peel, Bradley and Jones1995).
Methods
Geophysical methods and field work approach
Geologic and geophysical data were collected during the summer of 2002 aboard the RV Nathaniel B. Palmer (NBP02-01). One objective of this cruise was to select a location where some carbonate material was likely to be preserved, within an optimal geomorphic zone (i.e. no evidence of debris flows or mass wasting) with a complete sediment record through the Holocene back to the most recent deglacial event. Swath bathymetry data allow the identification of geomorphic features on the sea floor using a hull-mounted SeaBeam 2100, collecting 120 beams of data at 12 kHz. These data were processed using a corrected sound-velocity profile, manually edited to remove anomalies, gridded with a grid cell average of 30 m by 30 m (~1 m vertical resolution), and displayed in shaded relief maps (e.g. Fig. 1). Shallow seismic data (3.5 kHz; ~1 m resolution) were acquired to characterize the upper tens of metres of strata using a hull-mounted Bathy 2000 system. Piston Core PC-61 and trigger cores TC-61 were obtained from a ridge in the western Bransfield Basin just north-east of Trinity Island at a water depth of 591 m at 63°23.358′S by 60°19.126′W (Fig. 1). Approximately 768 cm of sediment was recovered with PC-61 and 51 cm with the trigger core.
Sedimentology and stratigraphy techniques
Cores were split, described, photographed, X-radiographed, and analysed on a multi-sensor core logger at the Antarctic Research Facility at Florida State University. Core logs included attenuated gamma counts (gamma density), magnetic susceptibility, and P-wave velocity. Visual descriptions were based on colour, texture, grain size, sorting, pebble petrology, and macrobiology. Shear strength measurements were made using a Boart Longyear torvane. X-ray radiographs were made using a Norelco whole-core X-radiograph at 5 ma/100 kV for 30 seconds and analysed for stratigraphic features visual estimates of pebble content (%), size, and orientation.
Sub-samples were shipped to Rice University for further analysis. Grain size (< 1 mm) was analysed using a Malvern Master Sizer laser particle analyser at 10 cm sample intervals. Next, samples were washed through a 63 micron sieve, dried, and examined under binocular microscope for carbonate material to date. For petrographic analysis, 10 cm slabs (~20 cc each) were sieved at 0.5 mm and 2 mm at 25 cm intervals (coarse sands are most likely to be deposited directly from icebergs or volcanic activity, rather than transported by wind or currents). Line counts of 300 grains were performed under binocular microscope on samples with sufficient coarse sand content; however, six samples contained < 100 grains total, with the lowest sample at 27 grains. Grains were categorized by petrographic type. Absolute abundances for total tephra and non-tephra grains for large samples ( ≫ 300 grains) were estimated using a standard dry sediment sample splitter.
Radiocarbon methods
One sample in PC-61 contained sufficient biogenic calcite (foraminifera) for radiocarbon analysis, preserved by a tephra layer at 201–211 cm. This sample was picked using a small brush, rinsed with deionized water, dried, weighed, and shipped to University of Arizona AMS Laboratory for analysis. Nine samples were analysed using acid insoluble organic (AIO) methods (e.g. Pudsey et al. Reference Pudsey, Barker and Larter1994). For these samples, bulk sediment was dried, pulverized, washed in 1 N HCl for 24 hours to remove detrital acid soluble components, decanted, washed to neutrality with deionized water, dried and pulverized before analysis. Acid washed samples were analysed for total organic carbon (TOC) content using a LECO instrument at the University of Houston Petroleum System and Geochemistry Lab. These samples were then shipped to University of Arizona AMS Laboratory or to the National Ocean Sciences AMS facility (NOSAMS) for radiocarbon analysis.
Corrections were made for the carbonate date using a 1230 year Antarctic Peninsula marine reservoir correction (Domack et al. Reference Domack, Leventer, Dunbar, Taylor, Brachfeld and Sjunneskog2001). AIO dates were corrected for local source effects by subtracting the core-top age (of 2833 14C yr bp). These local source effects are enigmatic (Andrews et al. Reference Andrews, Domack, Cunningham, Leventer, Licht, Jull, DeMaster and Jennings1999) but are probably due to input of reworked carbon material (radiocarbon dead), possibly from the upper Palaeozoic marine shales from the Trinity Peninsula Group (Fleming & Thomson Reference Fleming and Thomson1979, Pudsey & Evans Reference Pudsey and Evans2001, Pudsey et al. Reference Pudsey, Murray, Appleby and Evans2006). Using a surface correction assumes that the core top age represents modern deposition. We consider this a reasonable assumption considering palaeoenvironmental data in the region, including 210Pb studies (e.g. Harden et al. Reference Harden, DeMaster and Nittrouer1992, Pudsey et al. Reference Pudsey, Murray, Appleby and Evans2006) which indicate modern surface sediments. In addition, our surface date comes from the top of a relatively undisturbed gravity core (i.e. TC-61, 0–2 cm). All dates were calibrated to calendar years with the CALIB v5.0 program (Stuiver et al. Reference Stuiver, Reimer, Bard, Beck, Burr, Hughen, Kromer, McCormac, Van Der Plicht and Spurk1998).
Diatom methods
Diatom analysis is performed in two steps, 1) total diatom abundance, and 2) diatom assemblage. The diatom flora preserved in the sediment is dominated by Chaetoceros resting spores (rs) making up 70–90% in the Antarctic Peninsula area (Leventer et al. Reference Leventer, Domack, Ishman, Brachfeld, McClennen and Manley1996, Bárcena et al. Reference Bárcena, Gersonde, Ledesma, Fabrés, Calafat, Canals, Seirro and Flores1998, Reference Bárcena, Isla, Plaza, Flores, Sierro, Masque, Sanchez-Cabeza and Palanques2002, Sjunneskog & Taylor Reference Sjunneskog and Taylor2002). Large blooms of Chaetoceros spp are known to occur during sea ice melt when a freshwater lens and stable surface water stratification take place (Sjunneskog & Taylor Reference Sjunneskog and Taylor2002). Consequently this reflects the primary productivity in the overlying surface water during a short period of the season. The dominance of Chaetoceros rs dilutes the record of other species more sensitive to climate and environmental change such as sea ice extent, temperature, and coastal versus open marine setting. Hence a diatom record excluding the Chaetoceros rs, the diatom assemblage, is produced to ensure high enough counts to perform statistical analyses (Taylor et al. Reference Taylor, Whitehead and Domack2001). Two cubic centimetres of sediment were sampled at 10 cm intervals, 5 cm samplings were performed at critical intervals for total diatom abundance and diatom assemblage analyses. Quantitative diatom slides were prepared and total diatom abundance calculated using the settling method described by Scherer (Reference Scherer1994). The slides were mounted in Norland Adhesive 61 and diatoms counted at 1000x magnification with an oil immersion objective lens. For total diatom abundance analyses, a total number of at least 400 valves were counted on each slide. Diatom assemblage analyses are based on diatom counts of 400 valves excluding Chaetoceros rs.
Results
Geophysical results and core location
Multibeam swath bathymetry data indicate that PC-61 was obtained from a small ridge located within the mid-shelf area in the western Bransfield Basin, with no evidence of mass wasting (slump scarps, debris aprons, etc), limiting potential disturbance from turbidites. This area is characterized by streamlined features including drumlins and scalloped features, with elongation ratios ranging from 2:1 to 10:1 (Fig. 1c). These features were formed beneath a grounded ice sheet with palaeoice flow direction to the north-east (Fig. 1). Specifically, it is part of the western branch of the drainage system that we refer to here as the Orleans–Tower Island palaeoice stream. To our knowledge this is the first published documentation of the existence of this palaeoice stream. Low elongation ratios suggest low to moderate ice flow velocity (Wellner et al. Reference Wellner, Lowe and Anderson2001, Ó Cofaigh et al. Reference Ó Cofaigh, Pudsey and Dowdeswell2002) relative to the rapid ice flow immediately to the west in the Gerlache–Boyd palaeoice stream (Canals et al. Reference Canals, Urgeles and Calafat2000).
Geochronology
In Table I, we report the radiocarbon results for PC-61. For the top ~600 cm of the core, our radiocarbon results yield a smooth age-depth progression giving us reasonable confidence in these dates. Further, the surface corrected AIO age at 198–200 cm and the reservoir corrected carbonate date at 200–210 cm are in very close agreement (below laboratory errors of ±77 years), with analysis yielding a 3860 cal yr bp AIO age and 3870 cal yr bp foraminifera age. This strengthens our justification for using the surface age correction.
Table I. Conventional, reservoir corrected, and calibrated radiocarbon dates for core NBP0201 PC-61.

aAA = University of Arizona Accelerator Lab, OS = National Ocean Sciences Lab (WHOI)
bOM = open marine, TGM = transitional glacial marine
cAIO = acid insoluble organic carbon, F9(b) benthic foraminifera, dup. = duplicate sample
dTOC = total organic carbon, measured at University of Houston, Petroleum System and Geochemistry Lab
eR = Accepted Antarctic Peninsula marine reservoir correction (1230 yr) for carbonate samples, plus local source effect for AIO samples
Below ~600 cm, both our radiocarbon dates are anomalously old at 19 190 and 20 130 cal yr bp (at 638–640 and 649–653 cm, respectively). In addition, TOC values drop below 0.5% in these two samples (Fig. 2). There are two possible explanations for this. One, these two lowermost radiocarbon dates reflect an increase in the relative amount of reworked dead carbon (either through increased flux of reworked carbon, or decreased flux of modern carbon, or both) and hence these dates are unreliable. Alternatively these two dates are accurate and reflect dramatically low sedimentation rates (clastic and biogenic) during the early post-glacial time period. We conservatively choose the first explanation and disregard these two radiocarbon dates until independent means of dating this material become available (e.g. Brachfeld et al. Reference Brachfeld, Domack, Kissel, Laj, Leventer, Ishman, Gilbert, Camerlenghi and Eglinton2003, Ingalls et al. Reference Ingalls, Anderson and Pearson2004).

Fig. 2. Uncorrected, reservoir corrected, calibrated (CALIB v5.0) radiocarbon data, our age model, and total organic content (TOC) for PC-61. Note the lowermost two (2) radiocarbon dates are disregarded in the age model.
For our age model, rather than using a high order polynomial, we use a simple linear sedimentation rates between all reliable radiocarbon dates (Fig. 2). Disregarding the lowest two dates, we extrapolate the sedimentation rate from immediately up-core, which is to say, starting at 9040 cal yr bp through the pebbly sandy stratified mud (PSSM) unit. Hence, our age model suggests the lift-off of grounded ice and the earliest deglaciation age at ~10 650 cal yr bp. We acknowledge possible problems in assuming a constant sedimentation rate in the PSSM unit, and suggest caution in interpreting the climate signal from this section of core until better age constraints are available.
Sediment and stratigraphic facies analyses
Sediment facies were chosen based upon a suite of observations. X-ray radiograph analysis displays sharp contacts at 575 cm and at 655 cm, dividing the section into three units, each with a unique character and appearance (Fig. 3). In addition to X-ray radiographs, obvious contacts in the core appear visually (overall olive grey above 575 cm, dark olive grey 575–655 cm, dark grey below 655 cm), in grain size distribution (Figs 4 & 5), grain sorting, pebble content and petrology (Fig. 6), magnetic susceptibility (Fig. 7), and microfossil content. Furthermore, shear strength gradually increases down-core to 660 cm (0–0.10 kg cm-3), with a sharp increase just below the lower contact at 670 cm (to 0.40 kg cm-3). Hence, detailed descriptions of these three major stratigraphic units are presented below, from oldest to youngest, with specific emphasis on X-ray radiographs, grain size, and petrographic analysis (Figs 3–6). These stratigraphic facies are similar to those described elsewhere (Anderson Reference Anderson1999, Domack et al. Reference Domack, Jacobson, Shipp and Anderson1999, Evans & Pudsey Reference Evans and Pudsey2002, Heroy & Anderson Reference Heroy and Anderson2005). However, the specific attributes of this core highlight the unique sedimentary patterns of the Bransfield Basin region.

Fig. 3. Schematic representation of X-radiographs (negative images) for PC-61. Diatomaceous mud, PSSM, and Diamicton units are identified, each formed in distinct sedimentary environments (open marine, glacial proximal, and subglacial, respectively).

Fig. 4. Ternary diagram comparing the relative (%) sand/silt/clay grain sizes fractions for the three stratigraphic units (10 cm sampling interval) found in PC-61.

Fig. 5. Grain size frequency distributions for all of the samples run in the three stratigraphic units in PC-61, presented on a log-linear plot from Malvern laser particle grain size analysis. Volume is reported as a percent (%) of total bulk (< 1 mm) sample.

Fig. 6. a. Relative abundances for the major petrologies of the > 0.5 mm fraction. b. Absolute tephra and non-tephra grains on a log-linear plot. Non-tephra grains are interpreted as ice-rafted debris (IRD).

Fig. 7. Magnetic susceptibility, total diatom abundance, and sedimentation rate plotted versus our age model for PC-61. Mean of 3 is a calculated running average of diatom abundance data. Facies BS-5 through BS-2 represent diatomaceous muds and open marine conditions; PSSM/BS-1 represents pebbly sandy stratified mud and the earliest post-glacial marine sediments; Diamicton represents subglacial sediments and is absent of diatoms. Note concomitant peak diatom abundance, sedimentation rate, and low magnetic susceptibility in BS-3.
Diamicton unit
The bottom-most unit in PC-61 is a dark grey, matrix-supported, pebbly diamicton. X-ray radiographs reveal a homogeneous, massive diamicton extending from the bottom of the core to an abrupt upper contact at ~655 cm interrupted only by occasional cracks, artefacts of the coring process (Fig. 3). In this unit, X-radiograph analysis reveals that pebbles compose ~25–30% by volume and display random orientation. The largest pebble measures 9.0 cm, while most pebbles measure roughly 3–8 mm (long-axis measurement).
Figure 4 shows the percent sand/silt/clay components for all the samples measured from PC-61. In ternary space, samples from the diamicton and diatomaceous mud units form two distinct populations, both overlapped by samples from the PSSM unit. This overlap is also reflected in grain size statistics, where the coarser average (mean) grain size of diamicton is not significantly different than the PSSM (P ≤ 0.1521; Table II). Hence, other grain size parameters must be examined in order to distinguish these two facies. To this end, in Fig. 5, diamicton samples qualitatively yield more consistent grain size distributions and less variable modes than PSSM samples, reflecting the homogeneous nature of the diamicton unit. Quantitatively, sorting (i.e. standard deviation; Table II) successfully allows us to distinguish diamicton from PSSM sediments, where diamicton is significantly (P ≤ 0.000) more poorly sorted than PSSM (i.e. very poorly sorted vs poorly sorted, respectively).
Table II. Statistics and grain size analysis* results for the three sedimentary facies in PC-61. See text for further discussion.

* Statistical parameters determined using graphical methods after Folk & Ward (Reference Folk and Ward1957). φ = log2d where d = the grain size diameter in mm
** Probability (p-value) associated with a Students t-test, with a two-tailed distribution assuming unequal variance, α = 0.95
Petrologic analysis indicates the diamicton unit is dominated by felsic volcanics and “other” grains (Fig. 6a). Felsic volcanics include rhyolites and andesites, with minor to trace tuff and volcaniclastics. These felsic volcanics are probably eroded from the Middle Jurassic Antarctic Peninsula Volcanic Group, widespread in the northern Aureole Hills of the Trinity Peninsula (Fleming & Thomson Reference Fleming and Thomson1979). The “other” category is dominated by semi-consolidated till pellets, presumably reworked from older glacial deposits but also includes minor to trace amounts of the only sedimentary rock grains found in this core. These sedimentary rocks include sandstones and breccias, probably from the Upper Palaeozoic Trinity Peninsula Group (Fleming & Thomson Reference Fleming and Thomson1979). The diamicton unit also contains minor amounts (~4–9%) of plutonic grains and meta-igneous grains rich in pyrite, as well as trace amounts (~0.5–3%) of mafic volcanic grains and clear quartz crystals of unknown origin. Relative abundance of tephra grains is very low below 675 cm (Fig. 6a) despite high absolute abundances (Fig. 6b).
Other characteristics of this diamicton unit include high shear strength (~0.30–0.33 kg cm-2), high gamma density, and high magnetic susceptibility, all three with an abrupt upper contact at 655 cm, and an absence of microfossils.
Pebbly Sandy Stratified Mud (PSSM) unit
Directly above the diamicton lays a heterogeneous ~80 cm thick deposit with a sharp lower and gradational upper contact referred to as the PSSM unit. In X-radiograph, this unit is characterized by alternating bands or layers of pebbles, sand, mud, and diamicton, with occasional diffuse diatom laminations (Fig. 3). This facies fines upwards, with layers of diamicton or pebbly muddy sand towards the bottom, and pebbly sandy mud with thin intervals of sandy mud towards the top. Pebbles range from 5–10% by volume toward the bottom of this unit to 1–5% toward the top, with an average size of 2–5 mm, and with the largest pebble measuring 1.5 cm long. Horizontal pebble orientation becomes more dominant toward the top of this unit. Prominent but disturbed diatom-rich laminations occur from 630–640 cm, and less pronounced laminations at ~610 cm.
In ternary space, PSSM sediments overlap both the diamicton and diatomaceous sediments (Fig. 4), with the relative amount of sand decreasing and silt increasing up-core (clay abundance does not vary significantly). The heterogeneous nature of PSSM sediments is best displayed in Fig. 5, where the mode of these sediments varies widely, roughly ranging from ~8–80 µm, while diamicton sediments vary from ~10–50 µm, and diatomaceous mud from ~9–25 µm (with the one exception of the tephra layer at 210 cm). This unit also features sorted silt and fine sand modes (Fig. 5). Individual samples of PSSM sediments are significantly less poorly sorted than diamicton (mean standard deviation of 1.87 φ and 2.09 φ, respectively; p-value for standard deviation ≤ 0.000; Table II), but still more poorly sorted than diatomaceous mud (mean standard deviation of 1.69 φ; p-value for standard deviation ≤ 0.000; Table II).
Petrologic analysis of the PSSM unit indicates a significant tephra component, dominated by volcanic glass, and with significant amounts of scoria and pumice (Fig. 6a). Abundances of felsic volcanics and “other” grains (predominantly till pellets) drop off relative to the diamicton unit and decrease up-core through the PSSM unit, along with a slight decrease in meta-igneous grains. Likewise, the PSSM unit has slightly increased components of plutonics, mafic volcanics, and schist (absent in the diamicton unit) relative to the diamicton unit.
Other characteristics of PSSM include low shear strength (~0.25 kg cm-2), sharp colour changes from dark grey to olive green, and decreasing (up-core) gamma density and magnetic susceptibility. This unit marks the first appearance of diatoms (at 653 cm).
Diatomaceous mud unit
The youngest unit is the 575 cm thick diatomaceous mud unit, which appears in X-radiograph as homogeneous to mottled (bioturbated) mud with occasional burrows as well as diatom, sand, and pebble layers or laminations scattered throughout (Fig. 3). The high levels of bioturbation throughout the core suggest that these diatom laminations result from decreased bioturbation rather than diatom bloom events. The one exception to this may be the 2–3 cm diffuse diatom zone at 450 cm (Fig. 3), which correlates with the peak total diatom abundance data and exceptionally high diatom flux. A prominent graded, well sorted tephra layer occurs from 201–211 cm, with a sharp lower and gradational upper contact. A second significantly more bioturbated tephra layer occurs from 300–305 cm. Scattered pebbles commonly have horizontal orientation. Finally, a heavily bioturbated sand layer occurs at 400 cm.
The diatomaceous mud unit is tightly grouped in Fig. 4, with the lowest sand and highest silt component of the three units. The only two outliers are the two aforementioned tephra layers (both with sand contents ~20%). This tight grouping is also evident in Fig. 5, where all samples have dominant modes that range from ~9–25 µm, with the obvious exception the only well sorted tephra layer in the entire core, at 210 cm. In addition, many diatomaceous mud samples feature a significant very coarse sand component (~1000 µm; Fig. 5). This unique characteristic of the diatomaceous mud unit shows up statistically as being significantly more coarsely (negatively) skewed (-0.08) than both PSSM (-0.02) and diamicton (-0.05; P ≤ 0.0082 and P ≤ 0.0155, respectively; Table II). Finally, this unit is the best sorted of the three units, although still considered poorly sorted, with the lowest mean standard deviation.
Large variations in grain petrology in the diatomaceous mud unit are largely a function of tephra content (Fig. 6a & b). In particular, the absolute abundance of lithic (non-tephra) grains remains consistently low, while large variations of tephra abundances occur throughout the core (Fig. 6b). High absolute abundances occur at 30, 130, 155, 205, 230, 280, 305, and 355 cm, in contrast to low abundances between 30–55 cm and 455–575 cm. The largest change in the lithic fraction is at 305 cm. Here, feldsic volcanics dominate the non-tephra component (probably from the Middle Jurassic Antarctic Peninsula Volcanic Group), followed by mafic volcanics with minor to trace amounts from other grains of unknown origin (Fig. 6a). In addition, the lithic components at 75 cm includes an abundance of meta-igneous grains.
Other characteristics of this diatomaceous mud unit include olive grey to olive green colour, homogeneous to mottled texture, low to very low shear strength (0–0.15 kg cm-2), and low magnetic susceptibility and gamma density. Arenaceous foraminifera, dominated by Miliammina arenacea, are common throughout this unit. The tephra layer at 201–211 cm helped preserve the only carbonate foraminifera in this core, dominated by Miliammina and Globocassidulina, with abundant Fursenkoina and Pullenia, minor Nonionella, Cassidulinoides and Globigerina, trace Uvigerina. This is similar to the Fursenkoina spp. assemblage as defined by Ishman & Domack (Reference Ishman and Domack1994), which is closely associated with Weddell Sea Transitional Water. High carbonate dissolution rates, probably due to local water conditions, do not allow for further foraminifer analysis in this core.
Diatom analysis
Diatom abundance
The transition from diamicton to PSSM is marked by the first occurrence of diatoms in low abundance, 1.8 × 10⁶ valves/gram dry sediment (v gds-1) at 653 cm, with total abundances increasing to 1 × 10⁸ v gds-1 in the PSSM. In the diatomaceous mud unit, diatom abundance varies between 1 × 10⁸ and 6 × 10⁸ v gds-1. The highest diatom abundance at 450 cm correlates to a diffuse laminated section of the core (Fig. 3). Reduced diatom abundance corresponds with the major sand and tephra layers (200–210 cm, 300 cm, and 400–410 cm) (Fig. 8). A general trend of decreasing diatom abundance takes place from 390 to 300 cm, with the lowest diatom abundance in the diatomaceous mud between 300 and 200 cm. Chaetoceros resting spores (rs) make up 70–96% (88% average) of the total diatom assemblage in the PMMS and diatomaceous mud units (Fig. 8).

Fig. 8. Distribution of diatom species and total diatom abundances for PC-61 in % abundance and valves per gram of dry sediment (v/gds). Trends in diatom data and associated climate signals are discussed in the text.
Diatom assemblage, non-Chaetoceros
Based on the abundances of 25 species (which occur with > 2% of total non-Chaetoceros abundances) the diatom assemblage is divided into five zones. These five zones, BS-1 through BS-5, are determined using psimpoll (www.kv.geo.uu.se/psimpll.html, accessed 8/2005) and constrained cluster analyses (Fig. 8). One sample was identified as an outlier and removed (610 cm) from cluster analyses. Significant species (P < 0.05) within zones were identified by SNK (Student-Newman-Keuls Multiple Comparison) following Taylor et al. Reference Taylor, McMinn and Franklin1997.
BS-1 (641–596 cm) is marked by the high abundances of both Thalassiosira antarctica (55.4%) and Fragilariopsis vanheurckii (6.1%) and by significantly lower abundance of both Porosira spp. and Fragilariopsis kerguelensis. Thalassiosira antarctica is commonly associated with cold water masses (Zielinski & Gersonde Reference Zielinski and Gersonde1997) and newly formed platelet ice (Smetacek et al. Reference Smetacek, Scharek, Gordon, Eicken, Fahrbach, Rohardt and Moore1992, Cunningham & Leventer Reference Cunningham and Leventer1998). Fragilariopsis vanheurckii is probably related to cold water conditions (Taylor & Sjunneskog Reference Taylor and Sjunneskog2002) and is sometimes included in the sea ice assemblage (Bárcena et al. Reference Bárcena, Gersonde, Ledesma, Fabrés, Calafat, Canals, Seirro and Flores1998), although its modern distribution is not well documented.
In BS-2 (596–466 cm) E. antarctica var. recta (straight form) reaches its highest abundance (average 2.9%) and F. kerguelensis, F. cylindrus and Thalassiosira gracilis increase in relative abundance. The dominate species is T. antarctica with an abundance of 48.7%. The indicator species for BS-2, E. antarctica var. recta, is considered a polar cold water species (Fryxell Reference Fryxell1991, Fryxell & Prasad Reference Fryxell and Prasad1990). Associated with melting sea ice, F. cylindrus is commonly grouped together with F. curta in the “sea ice assemblage” (Leventer et al. Reference Leventer, Domack, Ishman, Brachfeld, McClennen and Manley1996). Thalassiosira gracilis on the other hand is associated with outer continental shelf environment and open water (Zielinski & Gersonde Reference Zielinski and Gersonde1997, Crosta et al. Reference Crosta, Romero, Armand and Pichon2005). Another important feature is the appearance of Eucampia antarctica var. antarctica (asymmetric form) at the base of BS-2.
The most prominent feature of BS-3 (466–346 cm) is the peak abundance of E. antarctica var. antarctica (~450–375 cm; 14%, average 7.9%) and a significant increase of F. curta (19.1%). Although in low abundance, F. kerguelensis reaches its highest average abundance (7%) in this zone. The two morphological varieties of E. antarctica are suggested to have different environmental preferences, and E. antarctica var. antarctica is considered a sub-polar “warm water” species (Fryxell Reference Fryxell1991, Zielinski & Gersonde Reference Zielinski and Gersonde1997, Taylor & Sjunneskog Reference Taylor and Sjunneskog2002, Whitehead et al. Reference Whitehead, Wotherspoon and Bohaty2005). Fragilariopsis kerguelensis is one of the most important indicators for open water deposition in the Antarctic and associated with the Antarctic Circumpolar Current (Leventer Reference Leventer1992, Taylor et al. Reference Taylor, McMinn and Franklin1997, Zielinski & Gersonde Reference Zielinski and Gersonde1997).
The transition to BS-4 (356–126 cm) is characterized by the decline of E. antarctica var. antarctica to near absence. The increase of T. antarctica (34.1%) is significant in addition to species such as F. cylindrus, Actinocyclus actinochilus (2.7%), Cocconeis spp. (2.7%), and Corethron criophilum (1.6%). The diatom species of BS-4 represent a variety of different environments. For example, A. actinochilus is associated with long periods of sea ice cover and cold water (Pichon et al. Reference Pichon, Labracherie, Labeyrie and Duprat1987, Zielinski & Gersonde Reference Zielinski and Gersonde1997, Armand et al. Reference Armand, Crosta, Romero and Pichon2005), whereas high sediment abundances of C. criophilum is often associated with blooms and open water with little sea ice; however, sometimes it is found in association with ice edge melting (Fryxell & Hasle Reference Fryxell and Hasle1971, Leventer & Dunbar Reference Leventer and Dunbar1987, Leventer et al. Reference Leventer, Domack, Ishman, Brachfeld, McClennen and Manley1996). Cocconeis is a shallow water (benthic) genus characteristic of sub-tidal flats (Krebs Reference Krebs1987, Whitehead & McMinn Reference Whitehead and McMinn1997).
Several species occur in relatively low abundances in BS-5 (126–0 cm), such as Cocconeis spp. (4.2%), Proboscia inermis (1.2%), P. truncata (3.4%), and Rhizosolenia spp. (4.2%). The abundance of T. antarctica (25.8%) is the lowest recorded in PC-61, whereas T. gracilis and T. lentiginosa associated with the open ocean and Antarctic Polar Front (Crosta et al. Reference Crosta, Romero, Armand and Pichon2005) reach their highest abundances.
Discussion and interpretations
Sedimentologic model and depositional environment
Diamicton unit (subglacial environment)
Proper interpretation of diamictons on the Antarctic shelf is the subject of significant controversy in the literature, with possibilities including grounding zone deposits, debris flows, iceberg turbates, and iceberg rafted debris (Anderson et al. Reference Anderson, Kurtz, Domack and Balshaw1980, Reference Anderson, Kennedy, Smith, Domack, Anderson and Ashley1991, Dowdeswell et al. Reference Dowdeswell, Whittington and Marienfeld1994, Powell et al. Reference Powell, Dawber, McInnes and Pyne1996, Licht et al. Reference Licht, Jennings, Andrews and Williams1996, Reference Licht, Dunbar, Andrews and Jennings1999, Domack et al. Reference Domack, Jacobson, Shipp and Anderson1999). However, the suite of observations of the diamicton unit is consistent with the interpretation of subglacial till (Anderson Reference Anderson1999).
Overall, the diamicton unit lacks any sediment structures such as stratification, layering, or bioturbation. While this is true of most diamictons, we argue that this homogeneity reflects glacial remobilization and continued mixing process associated with basal transport, both within the ice and within deformation till layers (Anderson Reference Anderson1999, Domack et al. Reference Domack, Jacobson, Shipp and Anderson1999). This homogeneity is also reflected in the relatively tight grouping of grain size in ternary space (Fig. 4), overall consistency in grain size distributions (Fig. 5), and very poorly sorted sediments, characteristics also common to till (Anderson Reference Anderson1999, Domack et al. Reference Domack, Jacobson, Shipp and Anderson1999). Finally, this unit is rather stiff, yielding moderate to high shear strengths (0.30–0.33 kg cm-2). This observation has often been used to suggest a subglacial origin (Anderson et al. Reference Anderson, Kurtz, Domack and Balshaw1980, Evans & Pudsey Reference Evans and Pudsey2002, Ó Cofaigh et al. Reference Ó Cofaigh, Dowdeswell, Allen, Hiemstra, Pudsey, Evans and Evans2005) based on the argument that over-compaction resulted from the weight of the overlying ice sheet combined with deformation and/or lodgement processes (Anderson Reference Anderson1999, Ó Cofaigh et al. Reference Ó Cofaigh, Dowdeswell, Allen, Hiemstra, Pudsey, Evans and Evans2005).
In terms of petrology, significant tephra content (5–25%), particularly in the upper 50 cm of the diamicton unit, suggests the sediment of this unit was at one time exposed to an open marine setting (Fig. 6a). This is not surprising, as these deposits are probably reworked marine sediments deposited prior to the most recent ice sheet advance. In addition, high abundance of pelletized till (the dominant component of the “other” grains; Fig. 6a) in the diamicton unit is consistent with the interpretation that the most recent glacial advance reworked till from previous glacial episodes. Overall, the petrography of the diamicton unit reflects glacial reworking and erosion of the Antarctic Peninsula Volcanic Group, granites, granodiorites, and Tertiary volcanics found on nearby Tower and Trinity islands and the Trinity Peninsula (Fleming & Thomson Reference Fleming and Thomson1979, Thomson & Swithinbank Reference Thomson and Swithinbank1985).
Perhaps the most convincing evidence that this diamicton was deposited in a subglacial setting is the glacially sculpted and streamlined seafloor documented by multibeam swath bathymetry data (Shipp et al. Reference Shipp, Anderson and Domack1999, Ó Cofaigh et al. Reference Ó Cofaigh, Dowdeswell, Allen, Hiemstra, Pudsey, Evans and Evans2005, Domack et al. Reference Domack, Duran, Leventer, Ishman, Doane, McCallum, Amblas, Ring, Gilbert and Prentice2005, Heroy & Anderson Reference Heroy and Anderson2005, Fig. 1c). In addition, multibeam records help to rule out sediment gravity flows because of the core location on a bathymetric high, and the lack of obvious features (e.g. gouges or furrows) suggesting prominent iceberg turbation (Wellner et al. Reference Wellner, Heroy and Anderson2006). Finally, slow moving ice and scalloped features have been associated with lodgement till, which is consistent with our findings of high shear strengths (Wellner et al. Reference Wellner, Lowe and Anderson2001, Shipp et al. Reference Shipp, Wellner, Anderson, Dowdeswell and Ó Cofaigh2002). Hence, we are confident in the interpretation that this diamicton unit was deposited in a subglacial environment, and that the above units therefore capture the most recent deglacial event at this location.
PSSM unit (glacial proximal/sub-ice shelf)
Perhaps the most difficult facies to interpret, as well as the most interesting in terms of recording the actual deglacial event, is the PSSM unit. Although the exact sedimentary environment may be difficult to pinpoint (i.e. grounding zone, sub-ice shelf, or proximal marine; Anderson Reference Anderson1999), we interpret this unit as glacial proximal sediments. This facies is similar both in description and interpretation to other studies (Kennedy & Anderson Reference Kennedy and Anderson1989, Anderson et al. Reference Anderson, Kennedy, Smith, Domack, Anderson and Ashley1991, Pope & Anderson Reference Pope and Anderson1992, Pudsey et al. Reference Pudsey, Barker and Larter1994, Reference Pudsey, Murray, Appleby and Evans2006, Powell et al. Reference Powell, Dawber, McInnes and Pyne1996, Domack et al. Reference Domack, Jacobson, Shipp and Anderson1999, Reference Domack, Duran, Leventer, Ishman, Doane, McCallum, Amblas, Ring, Gilbert and Prentice2005, Nishimura et al. Reference Nishimura, Tanahashi, Tokuhashi, Oda and Nakasone1999, Pudsey & Evans Reference Pudsey and Evans2001, Evans & Pudsey Reference Evans and Pudsey2002, Ó Cofaigh et al. Reference Ó Cofaigh, Dowdeswell, Allen, Hiemstra, Pudsey, Evans and Evans2005).
The PSSM unit is largely differentiated from the diamicton unit by the presence of stratification, generally reflecting the settling out of debris through the water column after the ice sheet decoupled from the sea floor. The three sedimentary processes that probably drove the stratification of this facies include melt-out, current transport, and advection of marine sediments. The layers of diamicton, pebbles, and pebbly muddy sands were deposited dominantly from rain out of the basal debris layers of a floating ice shelf. Sorted (relative to the diamicton unit) fine sand and silts (Fig. 5) reflect deposition from bottom current activity, probably from subglacial meltwater. Diatom-rich laminations (~610 and 635 cm; Fig. 3) and the up-core increase of diatom abundance (Fig. 8) and tephra content (Fig. 6a) are probably the result of advection from marine surface waters. The overall up-core decrease in grain size reflects the decrease in the supply of coarse debris and rain out in response to the retreat of the grounding line. The up-core decrease in the abundance of till pellets and feldsic volcanics, both characteristic of the till unit, also supports a retreating grounding line.
An ice shelf rather than an open marine environment is considered probable during the deposition of this unit for the following reasons. 1) Glacial proximal sediments here resemble those described by other researchers of modern and Holocene ice shelf environments, including stratified pebbly muds, low diatom abundances and TOC content, and abundant till pellets (Powell et al. Reference Powell, Dawber, McInnes and Pyne1996, Domack et al. Reference Domack, Jacobson, Shipp and Anderson1999, Reference Domack, Duran, Leventer, Ishman, Doane, McCallum, Amblas, Ring, Gilbert and Prentice2005, Pudsey & Evans Reference Pudsey and Evans2001, Evans & Pudsey Reference Evans and Pudsey2002, Ó Cofaigh et al. Reference Ó Cofaigh, Dowdeswell, Allen, Hiemstra, Pudsey, Evans and Evans2005). 2) Although no modern ice shelves exist in the Bransfield Basin, nearby regions in the Weddell Sea and Marguerite Bay have significant ice shelves. We suggest suppressed mean summer temperatures during the early post-glacial cycle and/or abundant small island pinning points (e.g. South Shetland Islands, etc.) would probably result in an ice shelf in the Bransfield Basin. PC-61 does not, however, include a terrigenous mud facies (Kennedy & Anderson Reference Kennedy and Anderson1989) nor a “null zone” (Domack et al. Reference Domack, Jacobson, Shipp and Anderson1999) interpreted as indicating a sub-ice shelf environment. This may reflect a shorter duration and/or smaller size of the ice shelf or perhaps differences in local geology and oceanography. Also, the presence of modern diatoms is not inconsistent with an ice shelf environment; optimal oceanographic conditions may advect significant quantities of diatoms beneath an ice shelf from nearby areas of seasonally open surface waters (Anderson et al. Reference Anderson, Kennedy, Smith, Domack, Anderson and Ashley1991, Pudsey & Evans Reference Pudsey and Evans2001, Evans & Pudsey Reference Evans and Pudsey2002).
PC-61 differs significantly from sediment cores from the Ross Sea, where the mud and transitional sediment comprise a mixture of diatom assemblages spanning the Tertiary (up to 50%) and Quaternary (Sjunneskog & Scherer Reference Sjunneskog and Scherer2005). In contrast, the diatom flora is entirely composed of modern diatoms in PC-61, and the reworked component is less than 0.1%. This probably reflects the fact that the parent material in the Ross Sea is largely Cenozoic marine sedimentary deposits whereas the parent material in the Bransfield is mostly igneous, metamorphic, and non-marine sedimentary rock (Anderson Reference Anderson1999).
Diatomaceous mud unit (open marine)
Perhaps the most common Modern sedimentary facies on the Antarctic shelf is a massive, heavily bioturbated diatomaceous mud interpreted as a seasonally open marine deposit (e.g. Anderson et al. Reference Anderson, Kurtz, Domack and Balshaw1980, Domack et al. Reference Domack, Jacobson, Shipp and Anderson1999). The high diatom abundance, bioturbation, and TOC content of this upper-most stratigraphic unit, in combination with the modern-day seasonally open marine conditions, strongly supports this interpretation. Occasional pebbles with horizontal orientation are interpreted as ice-rafted debris (IRD). Tephra layers as well as interspersed tephra sands are interpreted as ejecta from explosive volcanic events, probably from eruptions from nearby Deception Island (Fig. 1). Detailed geochemical analysis of the 201–210 cm tephra layer clearly indicates this layer is from Deception Island (Keller, personal communication 2005).
Sand content, pebble abundance, and magnetic susceptibility have successfully been used as climate proxies in glaciomarine settings (e.g. Heinrich Reference Heinrich1988, Kanfoush et al. Reference Kanfoush, Hodell, Charles, Guilderson, Mortyn and Ninnemann2000, Domack et al. Reference Domack, Leventer, Dunbar, Taylor, Brachfeld and Sjunneskog2001, Reference Domack, Leventer, Root, Ring, Williams, Carlson, Hirshorn, Wright, Gilbert and Burr2003). Unfortunately, these proxies are complicated in PC-61 by the dominance of volcanic activity in the Bransfield Basin region, making the smaller climate driven changes in sedimentation patterns difficult to discern. Changes in tephra content (Fig. 6a & b) are probably related to changes in volcanic activity with perhaps some secondary oceanographic effects, such as surface flow direction or sea-ice cover. Lower absolute abundances (< 100 grains 20 cc-1) of tephra between 480–555 cm and 55–80 cm are interpreted as periods of reduced volcanic activity, from ~1000–2000 cal yr bp and 7000–8500 cal yr bp. Highest abundances of tephra between 105–355 cm (~2000–6000 cal yr bp) is interpreted as a period of high volcanic activity, with two major eruptions c. 3870 and 5500 cal yr bp.
In Fig. 6b, the absolute abundances of tephra grains are compared with non-tephra grains in an attempt to resolve a separate IRD signal. In general, the IRD (non-tephra) grains show no strong trends over this time period (~9000 cal yr bp to present). The one exception to this is an anomalously high lithic content as well as unusual petrographic signature at 305 cm, suggesting a single large IRD event c. 5500 cal yr bp. In addition, samples below 580 cm (i.e. in the PSSM unit) have high abundances of both tephra and non-tephra grains, which reflects the increased flux of coarse grains due to the increased proximity of the grounding line. Hence, unlike other studies from nearby areas, our data indicates there was no increase in the output of IRD during the Neoglacial Period (Domack et al. Reference Domack, Leventer, Dunbar, Taylor, Brachfeld and Sjunneskog2001, Reference Domack, Leventer, Root, Ring, Williams, Carlson, Hirshorn, Wright, Gilbert and Burr2003). On the contrary, the highest IRD flux is recorded during the relatively warm period c. 5500 cal yr bp, perhaps reflecting increased melting and calving in fjords. Moreover, the lowest two IRD abundances are at 55–80 cm, during the Neoglacial time period. This result is the opposite of what is predicted by other studies (Heinrich Reference Heinrich1988, Kanfoush et al. Reference Kanfoush, Hodell, Charles, Guilderson, Mortyn and Ninnemann2000, Domack et al. Reference Domack, Leventer, Dunbar, Taylor, Brachfeld and Sjunneskog2001, Reference Domack, Leventer, Root, Ring, Williams, Carlson, Hirshorn, Wright, Gilbert and Burr2003). Reasons for this are unclear. Perhaps the lack of any strong trend reflects the more distal (marine influenced) and more northerly location of our core, out of reach from all but unusually large icebergs.
Sedimentation rates show a positive correlation with diatom abundance (Fig. 7). This is not a surprising result, as diatom frustules compose the dominant component of this sedimentary unit. High sedimentation rates have been associated with the Holocene climatic optimum (e.g. Domack et al. Reference Domack, Leventer, Dunbar, Taylor, Brachfeld and Sjunneskog2001); however, in contrast to the Palmer Deep, our study indicates a climatic optimum period of much shorter duration. This relatively short lived optimum is also reflected as a low value in magnetic susceptibility data, indicating the relatively low abundance of terrigenous (ferrous) minerals (Fig. 7). Magnetic susceptibility data also show two spikes at 3870 and 5500 cal yr bp, reflecting tephra layers discussed previously. Finally, the overall higher magnetic susceptibility values of BS-4 may be attributed to increased volcanic activity rather than IRD content (Fig. 7).
Diatom climate proxy
Because of complication from volcanic input as well as high carbonate dissolution rates, the major climatic changes have been defined through diatom analysis. Detailed interpretations of this analysis and possible implications on regional and local climate change are discussed here.
Late deglacial, 653–596 cm, > 9000 cal yr bp (BS-1)
The diatom record in the PSSM with low total diatom abundance and low percent of Chaetoceros (rs) is indicative of low primary productivity, potentially caused by unstable water stratification and/or long periods of ice cover (Leventer et al. Reference Leventer, Domack, Ishman, Brachfeld, McClennen and Manley1996, Sjunneskog & Taylor Reference Sjunneskog and Taylor2002, Maddison et al. Reference Maddison, Pike, Leventer and Domack2005, Stickley et al. Reference Stickley, Pike, Leventer, Dunbar, Domack, Brachfeld, Manley and McClennan2005). The non-Chaetoceros diatom assemblage is dominated by T. antarctica, a species related to unconsolidated ice and platelet and coastal ice, occurring in high abundance in the Weddell and Ross Seas and Prydz Bay where large ice shelves persist today (Taylor et al. Reference Taylor, McMinn and Franklin1997, Cunningham & Leventer Reference Cunningham and Leventer1998, Armand et al. Reference Armand, Crosta, Romero and Pichon2005). High abundance of T. antarctica in Bransfield Strait in recent time has been related to intrusion of cold surface water from the Weddell Sea. Cunningham et al. (Reference Cunningham, Leventer, Andrews, Jennings and Licht1999) hypothesize that high abundance of T. antarctica may be related to sub ice-shelf melting and late season productivity. Late summer and autumn diatom productivity of T. antarctica is consistent with results from a study of laminated sediment with seasonal resolution in Palmer Deep and Iceberg Alley (Maddison et al. Reference Maddison, Pike, Leventer and Domack2005, Stickley et al. Reference Stickley, Pike, Leventer, Dunbar, Domack, Brachfeld, Manley and McClennan2005). Assuming the environment in Bransfield Strait was similar to the current Ross and Weddell Seas and Prydz Bay during the late deglacial, we suggest the high abundance of T. antarctica is related to the ice-edge environment. Furthermore, the low (trace) abundance of open ocean species indicates reduced connection to the open ocean. The diatom assemblage is similar to that observed in Palmer Deep and Lallemand Fjord south of Bransfield Strait and may be regarded as a typical deglaciation sequence (Taylor et al. Reference Taylor, Whitehead and Domack2001, Sjunneskog & Taylor Reference Sjunneskog and Taylor2002, Taylor & Sjunneskog Reference Taylor and Sjunneskog2002).
Early–mid-Holocene, 596–466 cm 9000–6800 cal yr bp (BS-2)
The change observed in BS-2 is an increase in total diatom abundance, percent Chaetoceros rs, and species commonly associated with cold open water and reduced summer sea ice (Crosta et al. Reference Crosta, Romero, Armand and Pichon2005), such as F. kerguelensis and T. gracilis. This suggests a retreat of the ice shelf, ameliorating conditions, and increased intrusion of surface water from the outer continental shelf and from Weddell Sea approaching modern ocean circulation. In BS-2 E. antarctica var. recta (polar variety) peak in abundance whereas E. antarctica var. antarctica (sub-polar) remain in low abundance, waiting until BS-3 for their distinct increase. This section corresponds to the first climate optimum as recorded in Lallemand Fjord and Palmer Deep (Taylor et al. Reference Taylor, Whitehead and Domack2001, Sjunneskog & Taylor Reference Sjunneskog and Taylor2002, Taylor & Sjunneskog Reference Taylor and Sjunneskog2002) indicating a regional trend of early Holocene ameliorating climate conditions along the coast of the Antarctic Peninsula.
Mid-Holocene Climatic Optimum, 466–346 cm, 6800–5900 cal yr bp (BS-3)
The Mid-Holocene Climatic Optimum, widely recognized in the circum-Antarctic, is characterized in PC-61 by highest total diatom abundance and the peak abundance of E. antarctica var. antarctica. In contrast to the Palmer Deep record where there is a reduction in Chaetoceros vs relative abundance, these values remain stable in PC-61 (Fig. 8). Not surprisingly, this period is also characterized by the lowest magnetic susceptibility and highest sedimentation rates (Fig. 7). A distinct down-core distribution of the two morphological varieties of Eucampia is observed at several sites around the Antarctic Peninsula (Patterson et al. Reference Patterson, Leventer, Drake, Domack, Buffen, Ishman, Szymcek, Brachfeld and Backman2005, Leventer et al. Reference Leventer, Olson, Domack, Dunbar and Taylor2006). Although it has been suggested that the asymmetric form is associated with sub-polar conditions (Fryxell Reference Fryxell1991, Zielinski & Gersonde Reference Zielinski and Gersonde1997, Whitehead et al. Reference Whitehead, Wotherspoon and Bohaty2005), the environmental preference for this variety is still debated. The appearance of E. antarctica var. antarctica in PC-61 is very similar both in timing and magnitude to that of the Palmer Deep record, where E. antarctica var. antarctica appear at 8000–6000 cal yr bp in laminated sections interpreted as the climatic optimum (Taylor & Sjunneskog Reference Taylor and Sjunneskog2002, Sjunneskog & Taylor Reference Sjunneskog and Taylor2002). Hence, the diatom record of PC-61 suggests improved conditions for diatom growth and either intrusion of warm surface water or possibly a reduction in Weddell Sea water intrusion. During this interval, the sea ice related species F. curta has its highest abundance; we suggest this results from the rapid melting of the sea ice and stabilization of the water column similar to Mid-Holocene Climate Optimum records from western Ross Sea (Cunningham et al. Reference Cunningham, Leventer, Andrews, Jennings and Licht1999).
A warming period from 6800–5900 cal yr bp is significantly shorter than recorded elsewhere around the Antarctic Peninsula. In the Palmer Deep, the Mid-Holocene Climatic Optimum is interpreted to span 9000–3700 cal yr bp based on sediment grain size and benthic foraminifera (Domack et al. Reference Domack, Leventer, Dunbar, Taylor, Brachfeld and Sjunneskog2001, Ishman & Sperling Reference Ishman and Sperling2002). Diatom assemblage data in the Palmer Deep suggests the climatic optimum may be divided into two phases, with a cooling interval from ~7000–5000 cal yr bp (Taylor & Sjunneskog Reference Taylor and Sjunneskog2002). Yoon et al. (Reference Yoon, Park, Kim and Kan2002) recognize a climatic optimum on the outer shelf of the Antarctic Peninsula c. 6000–2500 cal yr bp based on sedimentological and diatom evidence. Further to the south, Bentley et al. (Reference Bentley, Hodgson, Sugden, Roberts, Smith, Leng and Bryant2005) cite the collapse of the George IV Ice Shelf, probably from local or regional warming, between ~9500–7900 cal yr bp. Discrepancies in the exact timing (i.e. onset and termination) of the climatic optimum in different locations surrounding the Antarctic Peninsula may reflect regional climate variations in atmospheric or oceanic circulation patterns. Such differences are intriguing and may be important in terms of understanding the rapid regional warming of the Antarctic Peninsula in light of modern-day global warming.
Mid–Late Holocene 346–126 cm, 5900–2600 cal yr bp (BS-4)
The rather short-lived peak of climatic optimum is followed by a period of increased abundance of T. antarctica together with increased abundance of A. actinochilus and T. gracilis, indicative of colder surface water and increased winter sea ice (Pichon et al. Reference Pichon, Labracherie, Labeyrie and Duprat1987, Crosta et al. Reference Crosta, Romero, Armand and Pichon2005, Armand et al. Reference Armand, Crosta, Romero and Pichon2005). Also increasing in relative abundance are Cocconeis spp., indicating transport from shallow water and benthic habitats (Leventer et al. Reference Leventer, Williams and Kennett1982). The change in diatom assemblage suggests a shift in predominant water masses, with colder water, increased wave action, and prolonged sea ice cover. This interpretation is supported by the reduced total diatom abundance, and hence inferred primary productivity. During this time interval a second diatom productivity event that was recorded in the high resolution Palmer Deep site, not evident in PC-61. This may be a result from lower resolution in PC-61 or a local difference in wind stress or surface currents form the more sheltered Palmer Deep.
Neoglacial, 126–0 cm, 2600 cal yr bp to present (BS-5)
The rather subtle transition from BS-4 to BS-5 is marked by an increase of Rhizosolenia spp., Proboscia truncata, P. inermis, and Thalassiosira lentiginosa (all in low abundance), suggested to be indicative of fall/late season productivity and post-bloom events and related to cold open water masses (Crosta et al. Reference Crosta, Romero, Armand and Pichon2005, Stickley et al. Reference Stickley, Pike, Leventer, Dunbar, Domack, Brachfeld, Manley and McClennan2005). The diatom abundance remains low but with a slight peak in diatom abundance c. 1300–500 cal yr bp and again decreasing towards modern day, a phenomena that is also recognized by Bárcena et al. (Reference Bárcena, Gersonde, Ledesma, Fabrés, Calafat, Canals, Seirro and Flores1998, Reference Bárcena, Isla, Plaza, Flores, Sierro, Masque, Sanchez-Cabeza and Palanques2002). Similar to the Palmer Deep record, Cocconeis spp. and T. gracilis have their highest abundance in the late Holocene, interpreted as increased storm frequency and wave action (Taylor & Sjunneskog Reference Taylor and Sjunneskog2002). Decreased water column stratification due to wind action may partly explain the reduced diatom abundance despite evidence of recent climate warming. Frequent “neoglacial events” are inferred for the last c. 3 kyr based on variation in diatom abundance and species composition from the Bransfield Strait diatom record (Bárcena et al. Reference Bárcena, Gersonde, Ledesma, Fabrés, Calafat, Canals, Seirro and Flores1998, Reference Bárcena, Isla, Plaza, Flores, Sierro, Masque, Sanchez-Cabeza and Palanques2002). We cannot address these events nor the Little Ice Age and medieval climate anomaly adequately in PC-61 due to its relatively low sedimentation rates; such fine scale investigation requires a higher resolution sediment record and well-constrained chronology.
The question whether the last decades of increased warming is unprecedented remains unanswered; however, the early and mid-Holocene climate optimum both in Palmer Deep and in the Bransfield Basin was a time of dramatic changes in sediment diatom assemblages that are not seen in the modern sediment record. In addition, low accumulation and high bioturbation rates for this core location do not allow us to resolve climate events of shorter duration, such as the little ice age, Medieval Warm Period, or the recent warming trend. We suggest longer cores in the central Bransfield Basin are necessary to define the Mid-Holocene Climatic Optimum as well as other shorter duration events, and to compare these events to recent warming trends.
Conclusions
This paper highlights major changes in stratigraphy and in diatom associations in the Bransfield Basin. These changes are believed to correspond to significant changes in both the depositional setting and climate. Important findings include:
1) PC-61 was obtained from the mid-shelf region in the western Bransfield Basin. Multibeam swath bathymetry indicates the core was obtained from a small ridge, near the ice divide between the Gerlache–Boyd and the Orleans–Tower Island palaeoice streams. Streamlined features and drumlins suggest the ice sheet was grounded in this region during the last glacial maximum.
2) Ten AMS radiocarbon dates are used to develop an age model for PC-61. The two lowermost dates were anomalously old (19 190 and 20 130 cal yr bp) and probably contaminated with reworked (dead) carbon. The oldest date within the smooth age-depth progression is 9040 cal yr bp, suggesting the ice decoupled from the seafloor prior to this time. Acknowledging possible errors in the assumption of a constant sedimentation rate through the glacial proximal unit, we estimate the age of the retreat of the grounded ice was ~10 650 cal yr bp.
3) Three stratigraphic units are identified. The oldest is a diamicton unit, interpreted as subglacial till. This unit is characterized by massive, very poorly sorted sediment, a lack of sedimentary structures (e.g. stratification, bioturbation), and high shear strength. The second is a pebbly sandy stratified mud (PSSM) unit, interpreted as deposited in a glacial proximal setting, probably beneath an ice shelf. It is also characterized by the first appearance (and lowest abundance) of diatoms, layers of pebbles, sand, and mud. The third unit is a diatomaceous mud, interpreted as an open marine deposit. The unit has high diatom content, is strongly bioturbated, and has numerous tephra layers. With noteworthy exceptions such as high tephra content, these facies descriptions and interpretations are similar to sedimentary facies reported elsewhere.
4) We note increased volcanic activity between ~2100–6500 cal yr bp, with two significant tephra layers at 3870 and 5500 cal yr bp, probably from nearby Deception Island. IRD flux appears relatively constant over this time period, with one large IRD event ~5500 cal yr bp. Abundant tephra sands and pebbles make a climatic interpretation of magnetic susceptibility difficult.
5) Five separate climate regimes are interpreted based on diatom analysis. The first is the deglacial period (> 9000 cal yr bp) which correlates to the PSSM unit. This period is characterized by low primary productivity, high abundance of T. antarctica, and is interpreted as a restricted open ocean circulation, possibly a sub-ice shelf environment. The second period (9000–6800 cal yr bp) is characterized by an increase in F. kerguelensis and T. gracilis, interpreted as indicating a retreat of the ice shelf and the beginning of near-modern ocean circulation. The third is the Mid-Holocene Climatic Optimum (6800 to 5900 cal yr bp), marked by the highest Eucampia antarctica var. antarctica and Fragilariopsis curta abundance and the highest total diatom abundance, along with the highest sediment accumulation rates and the lowest magnetic susceptibility. The forth period (5900–2600 cal yr bp) is characterized by an increased abundance in T. antarctica, A. actinochilus, and T. gracilis, indicating colder surface waters and increased winter sea ice. The Neoglacial period (2600 cal yr bp to present) includes an increase of Rhizosolenia spp., associated with cold open water masses.
6) The Mid-Holocene Climatic Optimum is significantly shorter here than suggested in other studies (e.g. Palmer Deep). Likewise, the Neoglacial is less pronounced. Reasons for this remain unclear; however, such discrepancies in timing may reflect important regional climate variations reflecting changes in atmospheric or oceanic circulation.
Acknowledgements
This research was funded by the National Science Foundation, Office of Polar Programs grant number OPP-9909734 to John Anderson. The authors extend their appreciation to the crew and scientific party of the RV/IB Nathaniel B. Palmer. Gratitude is also extended to the Florida State University Antarctic Research Facility curatorial staff for their assistance and sense of humour. Thanks also to Randy Keller for geochemical analysis of our 200–210 cm ash bed. We thank the referees for their valuable comments.


