I. INTRODUCTION
One of the major developments in the characterization of solid state materials of the last century was the discovery of the diffraction phenomena coming from powdered materials and the extraordinary progress of X-ray powder diffraction. Powder diffraction was invented almost simultaneously by Paul Scherrer and Peter W. Debye (Debye and Scherrer, Reference Debye and Scherrer1916), at the University of Göttingen, in Germany, and Albert W. Hull (Hull, Reference Hull1917a), in the Research Laboratory of the General Electric Company, Schenectady, NY, USA. It has become one of the most powerful methods used in the characterization of materials for scientific and technological purposes in diverse areas such as materials science, chemistry, physics, mineralogy, environmental sciences, biotechnology, and biomedicine, among others. These characterizations, performed in an impressive array of materials, have been carried out under different conditions in in situ experiments in which the materials are being examined and even solid-state chemical reactions are followed as a function of temperature, pressure, and mechanical energy, and in different gas environments. During the last few years, one of the most impressive applications has been the analysis of martian soil carried out with CheMin, a miniaturized X-ray diffraction/X-ray fluorescence instrument, which was sent to Mars on board the Curiosity rover as part of the Mars Science Laboratory (Bish et al., Reference Bish, Blake, Vaniman, Sarrazin, Bristow, Achilles, Dera, Chipera, Crisp, Downs, Farmer, Gailhanou, Ming, Morookian, Morris, Morrison, Rampe, Treimanl and Yeng2014).
Initially, after some unsuccessful attempts, Paul Scherrer, under the guidance of Peter W. Debye, was able to record the X-ray diffraction pattern of a powdered sample of lithium fluoride (Debye and Scherrer, Reference Debye and Scherrer1916). The correct interpretation of the recorded pattern led to the crystal structure of this material. Among the many new developments advanced by Debye and Scherrer, in their landmark work, were the design of the famous cylindrical camera which bears their names, “the Debye–Scherrer camera”, and the experimental set up, “the Debye–Scherrer geometry”, still used today. The great majority of textbooks and specialized publications centers their presentation of the origins of powder diffraction in the groundbreaking contributions of Debye and Scherrer. Usually, little attention is paid to the important work and legacy of Albert W. Hull. An account of his contributions to Powder Diffraction and Crystallography, in general, is the subject of this communication.
It must be mentioned that within the celebration of the 100 years of X-ray diffraction in 2012, the International Year of Crystallography in 2014 and the 100 years of X-ray powder diffraction last year, many outstanding reviews and articles have been published. Among these publications, it is noteworthy the superb book written by Authier (Reference Authier2013) and the well-prepared review articles of Ilyushin and Kovalchuk (Reference Ilyushin and Kovalchuk2012), and Etter and Dinnebier (Reference Etter and Dinnebier2014). Two major sources of historical prospective on important aspects of diffraction and crystallography, in general, are the compilations edited by Ewald (Reference Ewald1963) and McLachlan and Glusker (Reference McLachlan and Glusker1983), for the International Union of Crystallography (IUCr) and the American Crystallographic Association (ACA), respectively.
A. Albert Wallace Hull, the scientist
The crystal structure of iron, determined using X-ray powder diffraction, was presented by Albert W. Hull in October of 1916 during the 84th regular meeting of the American Physical Society (APS) gathered near Cleveland, Ohio, USA (Hull, Reference Hull1917a). In his presentation, Hull described the novel and groundbreaking method used by him to carry out the structure determination of iron. The first manuscript included in the proceedings of this meeting, published in the January 1917 issue of Physical Review (American Physical Society, 1917), is the report prepared by Hull. His talk was one of 22 presentations delivered in this meeting, held at the Nela Research Laboratory, National Lamp Works of the General Electric Company, Nela Park, in East Cleveland. Professor Robert A. Millikan, of the University of Chicago, who later, in 1923, was awarded the Nobel Prize in Physics “for his work on the elementary charge of electricity and on the photoelectric effect” (Nobelprize.org, 1), presided over the meeting in which 45 registered attendees participated. Millikan was then the President of the APS. At the meeting, there were three sessions for presentations, one on Friday 27th (in the afternoon) and two on Saturday 28th (morning and afternoon).
Albert Wallace Hull was a research physicist working at the General Electric Research Laboratory. Hull began his association with the GE Laboratory in 1914 after receiving his B.A. in Liberal Arts in 1905 and a PhD degree in Physics in 1909, both from Yale University. He was an instructor in physics at the Worcester Polytechnic Institute from 1909 to 1913 (Brittain, Reference Brittain2010). At GE, Hull had an illustrious career along with many very distinguished scientists. He was the author of numerous technical and scientific articles and of more than 90 patents. He was awarded the prestigious Morris N. Liebmann Prize in 1930 from the Institute of Radio Engineers (IRE), which along with the American Institute of Electrical Engineers (AIEE) merged into the contemporary Institute of Electrical and Electronics Engineers (IEEE). Hull served as President of the American Physical Society in 1943. He also was elected a member of the US National Academy of Sciences and a member of the Electrical Engineering Hall of Fame of IEEE. In the Biographical Memoirs published by the US National Academy of Sciences, C. G. Suits and J. M. Lafferty referred to Hull as “the world's most prolific inventor of electron tubes” (Suits and Lafferty, Reference Suits and Lafferty1970). Figure 1 shows a photograph of Albert W. Hull taken at the GE Laboratory.

Figure 1. Albert Wallace Hull. This photograph was taken at the GE Laboratory (Courtesy of the Museum of Innovation and Science, miSci, Schenectady, New York).
Among the scientists contemporary with Hull at the GE Laboratory were Irving Langmuir, who in 1932 was awarded the Nobel Prize in Chemistry “for his discoveries and investigations in surface chemistry” (Nobelprize.org, 2), William D. Coolidge, the inventor of the modern X-ray tube, and other devices, and Saul Dushman, an inventor of many vacuum tube devices and author of several classical books among them “Scientific Foundations of Vacuum Technique”, the prime reference on the subject during the vacuum tube technology era. Wheeler P. Davey, who edited the first Powder Diffraction File in 1941, was also a research physicist at the GE Laboratory between 1914 and 1926. There, Davey designed a 15 specimen powder diffraction camera (Davey, Reference Davey1921) and, with Hull, produced one of the first systematic procedures for indexing the powder diffraction patterns of non-cubic materials (Hull and Davey, Reference Hull and Davey1921). The work carried out by Hull and Langmuir on high-vacuum electronics and by Coolidge on tungsten provided the foundation for the electronics business of General Electric for many years.
An important part of the success of the GE Research Laboratory has been credited to the leadership of Willis R. Whitney (Suits, Reference Suits1960), the organizer and first director of the laboratory, the first industrial research facility in the USA. Within the scientific environment created by Whitney at the GE Research Laboratory, it was the custom to have a colloquium each Saturday afternoon. Many well-known scientists were invited to give a talk and to spend the day at the laboratory to meet and talk to the scientists working in the lab. Toward the end of 1914, William Henry Bragg accepted an invitation to go to the USA and Canada to give several lectures (Jenkin, Reference Jenkin2008). He was invited to visit Harvard University and the General Electric Company. After the talk presented by W. H. Bragg at the GE Research Laboratory, on the use of X-rays in the characterization of structures, Hull turned his attention for a few years on X-ray diffraction.
B. The beginning
In the “Personal Reminiscence” section of the commemorative volume “Fifty Years of X-ray Diffraction” edited by P. P. Ewald (Ewald, Reference Ewald1963; IUCr, 1), Hull remembered that in 1914 he was working under the direction of Langmuir and soon discovered the negative resistance dynatron (Hull, Reference Hull1918). He mentioned:
“At this point something fortuitous happened. Sir William Bragg visited our laboratory and spoke at our colloquium, telling us about the X-ray crystal analysis work which he and his son were doing. In the discussion I asked if he had found the crystal structure of iron, which I thought might be a clue to its magnetism. He might have answered, ‘no, but I think we shall have it soon’, and that would have ended it. But he replied, ‘no, we have tried but haven't succeeded.’ That was a challenge, and I decided to find the crystal structure of iron.
It was a rash decision, for I was totally unfamiliar with both X-rays and crystallography. But I had the Coolidge X-ray tube, and the new Kenotron rectifiers, which Dr. Saul Dushman of our laboratory had just developed. With these rectifiers I constructed a 100 000 volt d.c. power equipment, filtering the rectified current by a pair of condensers with an inductance between them.
From the start I had planned to use powder for my X-ray crystal analysis, since it was common knowledge that single crystals of iron had not been produced. I visualized that all the Bragg reflections would be recorded simultaneously, and might be unscrambled”.
Hull began the written report of his presentation at the APS meeting (Hull, Reference Hull1917a) stating that:
“In the X-ray analysis of iron a special procedure is necessary on account of the difficulty of obtaining large crystals”.
Initially, Hull carried out a structural analysis on a single crystal of “silicon steel”, an iron containing 3.5% of silicon crystal, of about 6 × 6 mm2 square and 2 mm thick, which led to a body-centered cubic arrangement of atoms. Then, he used this result to rationalize the powder diffraction data recorded for iron, demonstrating that these data were compatible with the structure determined in the single crystal study.
He described the methodology used to record and interpret the powder diffraction of iron in the following terms:
“Pure iron was then investigated in the form of very fine powder, obtained by reduction of the oxide with hydrogen. A narrow beam of rays from a tungsten target passed through the powder and formed on the photographic plate a kind of generalized Lane (sic) photograph, in which every possible plane in the crystal structure had an equal opportunity of reflecting, and reflected all wave-lengths present. What was actually observed was the position of the K lines, which, with the tube running at 110 000 volts, stood out very clearly on the continuous background. The reflection of these lines in different planes appeared on the plate as concentric, nearly circular, lines, whose distance from the center should be inversely proportional, approximately, to the spacing of the planes. The distance of these lines from the center can be measured and compared with the values calculated for the assumed crystal structure. If the assumed structure is correct, every calculated line must be present, and no more, and the intensity must fall off in the manner predicted”.
The position of the reflections observed were rationalized by Hull as coming from “A lattice having atoms at cube corners and cube centers ..”
After examining the difference observed among the intensities of the reflections recorded, Hull stated that the intensity of the lines falls off continuously with increasing distance from the center of the pattern because the scattering of the X-rays is due to the electrons in the atoms. Assuming that the electrons were displaced along the cube diagonals, he calculated the diffracted intensities and found a good agreement with the observed values. It must be noted that Hull was among the first to believe that the electrons were responsible for the diffraction phenomena. A year earlier, in March, W. H. Bragg (Reference Bragg1915) had commented in his Bakerian lecture before the Royal Society on the decline of the diffracted intensities with the increasing order of the reflection. He suggested that a possible explanation might be because “the scattering power of the atom is not localized at one central point, but is distributed through the volume of the atom”. The same year, in a letter published in Nature in April, A. H. Compton (Reference Compton1915) stated that “there are good reasons for believing that it is the electrons in atoms that scatter the X-rays”. In a short commentary published with this letter, Bragg reiterated the idea advanced before the Royal Society, stating: “I believe Mr. Compton is right in ascribing the rapid decline in the intensities of the X-ray spectra as we proceed to higher orders to the fact that the atom should not be treated as a point, but as a distribution of electrons in space”.
C. The method
In a more complete article published in December of 1917 (Hull, Reference Hull1917b), Hull explained in details the new methodology used in the iron work and in the determination of the crystal structure of other elements.
Hull began stating that,
“The beautiful methods of crystal analysis that have been developed by Laue and the Braggs are applicable only to individual crystals of appreciable size, reasonably free from twinning and distortion, and sufficiently developed to allow the determination of the direction of their axes. For the majority of substances, especially the elementary ones, such crystals cannot be found in nature or in ordinary technical products, and their growth is difficult and time-consuming.”
The method described below is a modification of the Bragg method, and is applicable to all crystalline substances…”.
The new method was described by Hull in the following terms:
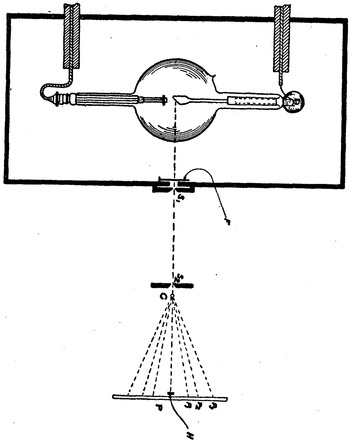
“The method consists in sending a narrow beam of monochromatic X-rays ( Figure 2 ) through a disordered mass of small crystals of the substance to be investigated, and photographing the diffraction pattern produced. Disorder, as regards orientation of the small crystals, is essential. It is attained by reducing the substance to as finely divided form as practicable, placing it in a thin-walled tube of glass or other amorphous material, and keeping it in continuous rotation during the exposure”.

Figure 2. Experimental setup designed by A.W. Hull for the collection of powder diffraction pattern of iron. It is clearly different to the circular camera designed by Debye and Scherrer. It was Figure 2 of the original paper (Hull, Reference Hull1917b). © 1917 by The American Physical Society.
It must be noticed that Hull clearly recognized the importance of the random orientation of the small crystals in the sample and the need for a “continuous rotation during the exposure” of the sample to obtain good results.
The arrangement used by Hull to register the powder diffraction patterns was quite different from the setup used by Debye and Scherrer (see Figure 2). Although both were in transmission mode, the recording photographic film of Hull was planar, placed directly in front of the sample while Debye and Scherrer, as it is well known, used a circular photographic film wrapped around the diffracting sample. Figure 3 shows the diffraction pattern recorded for aluminum using the experimental setup designed by Hull.

Figure 3. Diffraction pattern of aluminum, the first pattern presented by Hull (Reference Hull1917b). © 1917 by The American Physical Society.
In his remarkable publication of 1917 (Hull, Reference Hull1917b), Hull in a clear and concise manner stated some of the key fundamental aspects of the new technique.
“The total possible number of … lines (observed) depends upon the crystal structure and the wave-length (used)”.
“The positions of these lines, in terms of their angular deviation from the central beam, are completely determined by the spacing of the corresponding planes, according to the classic equation nλ = 2d sin θ, where θ is the angle between the incident ray and the plane, hence 2θ is the angular deviation, d the distance between consecutive planes, λ the wave-length of the incident rays, and n the order of the reflection”.
“The relative intensity of the lines, when corrected for temperature, angle, and the number of cooperating planes, depends only upon the space distribution of the electrons of which the atoms are composed”.
Regarding the nature of the materials to be examined, Hull pointed out:
“The Bragg method of X-ray crystal analysis is by far the simplest whenever single crystals of sufficient perfection are available. If, however, perfect order of crystalline arrangement cannot be had, the next simplest condition is perfect chaos, that is, a random grouping of small crystals, such that there is equi-partition of reflecting opportunity among all the crystal planes. This has two disadvantages, viz., that the opportunity of any one plane to reflect is very small, so that long exposures are necessary; and the images from all planes appear on the same plate, so that it is impossible, without calculation, to tell which image belongs to which plane. It has the advantages, on the other hand, of allowing a definite numerical calculation of the position and intensity of each line, and of being free from uncertainties due to imperfection and twinning of crystals. In the latter respect it serves as a valuable check on the direct Bragg method”.
Hull also reported several new and important developments which soon became incorporated as integral parts of the powder diffraction technique. One of those developments was the use of a filter to suppress, from the incident X-ray beam, most of the background radiation and other characteristic X-ray lines (the “Bremsstrahlung”) except the Kα lines of the corresponding anode.
“In order to produce monochromatic rays, it is necessary to use a target which gives a characteristic radiation of the desired wave-length, and to run the tube at such a voltage that the radiation of this wavelength will be both intense and capable of isolation by filtering.….”
Although it is impossible to produce truly monochromatic radiation by filtering, it is easy to obtain a spectrum containing only ‘one line’, and in which the intensity of this line is more than thirty times that of any part of the general radiation. To accomplish this, use is made of the sudden increase in absorption of the filter at the wave-length corresponding to the limit of one of its characteristic series; that is, at the wave-length which is just short enough to excite in the filter one of its characteristic radiations….. For example, to isolate the K lines of molybdenum whose wave-length is 0.712 Å, the most appropriate filter is zirconium, the limit of whose K series is at λ = 0.690 Å”.
Besides presenting a more detailed account of the process he used for the determination and the description of the structure of iron, Hull reported the crystal structure of the following elements: aluminum and nickel (fcc structure), lithium and sodium (bcc structure), magnesium [hexagonal close-packed (hcp) structure], silicon (diamond structure), and graphite. It is worth mentioning that Hull, with the determination of the structure of magnesium, was the first to report a structure based on a hcp arrangement of atoms.
Hull later determined the structure of chromium [body-centered cubic (bcc)] (Hull, Reference Hull1919a), calcium [face-centered cubic (fcc)] (Hull, Reference Hull1921a); α-cobalt, iridium, palladium, platinum, and rhenium (fcc), molybdenum, and tantalum (bcc), β-cobalt, cadmium, ruthenium, zinc (hcp), and indium (face-centered tetragonal) (Hull, Reference Hull1921b); thorium (fcc), cerium, titanium, osmium, and zirconium (hcp) (Hull, Reference Hull1921c); vanadium (bcc) and germanium (diamond structure) (Hull, Reference Hull1922).
Hull also demonstrated that it was possible to perform non-ambient diffraction studies. He carried out a study of single crystals of “silicon steel”, a single crystal of iron containing 3.5% of silicon, at liquid air temperature, room temperature, and 1000 °C (Hull, Reference Hull1917b). He also recorded several powder diffraction photographs of iron at different temperatures between 700 and 900 °C, although these photographs were ruined, either by chemical fog because of the heating of the photographic plate, or by growth of crystals during exposure.
D. On the indexing of powder diffraction patterns
Hull and Wheeler P. Davey, working at that time in the GE Research Laboratory, produced the first practical systematic procedure for indexing the powder diffraction patterns of non-cubic materials (Hull and Davey, Reference Hull and Davey1921). They developed a graphical method to index powder diffraction patterns of tetragonal and hexagonal symmetry. In charts, later called the Hull–Davey charts, they plotted the variation of c / a v the quantity [(h 2 + k 2) + 1 2/( c / a )2] for particular values of hkl and c / a , in a semilog paper. Each set of indices hkl produced a different curve. The clever procedure devised by Hull and Davey is the following. From the peak positions, 2θ, of the diffraction pattern registered, their corresponding calculated d spacings are marked off on the edges of a strip of paper with a semilog scale. The paper strip is then placed on the chart and moved about, both vertically and horizontally, until a position is found where each mark on the strip coincides with a line on the chart. When this happens, the indices of each diffraction peak line are simply read from the corresponding curves, and the approximate value of c / a is taken from the vertical position of the chart. After all the peaks have been indexed in this way, the d values of the two highest-angle lines are used to set up two mathematical relations, using the equations which govern the relations between the unit-cell parameters and the Miller indices for the hexagonal and tetragonal system. Solving simultaneously the two equations, the values of a and c can be determined.
For many years, this procedure was extensively used. It was included in all of the major textbooks on the subject up to the 1970s, when computer programs to carry out autoindexing became readily available. It must be mentioned that a general approach to the problem of indexing a pattern was devised by Runge (Reference Runge1917), but it had to wait until the computer era and the contributions of Ito (Reference Ito1949), de Wolff (Reference de Wolff1957) and Visser (Reference Visser1969) to be implemented.
E. The use of powder diffraction as an analytical technique
Around the world, in the academic sector as well as in industry, powder diffraction is most commonly used as an analytical technique in the identification of phases in a polycrystalline sample. This use was also pioneered by Hull in another groundbreaking contribution published with the title of “A new method of chemical analysis” (Hull, Reference Hull1919b). For this work, Hull used a modified experimental setup to collect the powder diffraction pattern reported, as it can be seen in Figure 4. Once again, Hull clearly stated fundamental aspects of X-ray powder diffraction. Based on experimental evidence, he asserted:
“.. substances with different crystalline structure will give entirely different patterns of lines… Substances of similar chemical nature, on the other hand, will in general have similar crystal structure, and give similar patterns, so that it is often possible to identify a photograph at a glance as belonging to a certain type of element or compound. Thus, lithium, sodium and potassium fluorides, sodium and potassium chlorides, and magnesium oxide ( Fig. 3 ) all have the same arrangement of atoms in their crystals, and all give precisely similar patterns of lines, the one being simply a magnified image of the other. The magnification or spread of the pattern is different for each one, being inversely proportional to the cube root of the molecular volume. Since no two similar substances have exactly the same molecular volume, it is easy to distinguish them, as the difference is cumulative for lines far from the center”.
The arrangement of apparatus is shown in Fig. 1. T is a transformer furnished with an extra coil for lighting the filament of the X-ray tube; X a Coolidge X-ray tube; F a sheet of metal, properly chosen, serving as a filter; S 1 and S2 slits in thin sheets of lead; T a thin-walled tube, about one mm. in diameter, of some light amorphous material, such as glass, celluloid, or collodion, containing the powdered substance to be tested; and F a narrow strip of photographic film bent over a semicircular strip of brass or wood, concentric with T”.
He noted that “The lines farthest from the center diverge even more than the difference in molecular volume, since the cube root of molecular volume is strictly proportional, inversely, to the ‘sine’ of the angles of reflection, whereas the distances of the lines from the center are proportional to the angles themselves. The difference is negligible for lines near the center (small angles), but for large angles the dispersion thus produced is very large, so that two exactly similar substances differing in molecular volume by less than 1% could easily be distinguished”.

Figure 4. Experimental setup used by Hull in 1919. It corresponds to Figure 1 of his original publication (Hull, Reference Hull1919b). © American Chemical Society.
He clearly pointed out the fingerprint nature of the powder diffraction patterns, one of key aspects of the strength of powder diffraction as an analytical technique: “… the same substance always gives the same pattern; … in a mixture of substances each produces its pattern independently of the others, so that the photograph obtained with a mixture is the superimposed sum of the photographs that would be obtained by exposing each of the components separately for the same length of time. This law applies quantitatively to the intensities of the lines, as well as to their positions, so that the method is capable of development as a quantitative analysis”.
Hull explained two examples to show some of the outstanding capabilities of the newly developed technique, which he announced “.. give(s) information which no other method of analysis can furnish”.
For the first example, Hull recorded the powder diffraction pattern “.. of a sample of sodium fluoride, taken from the stock, labelled ‘C.P.’”. “A sample of very pure sodium fluoride was then prepared and photographed”. After comparing the two patterns, he noticed some additional lines in the pattern of the sodium fluoride taken from the stock. “In order to determine the nature of the impurity, a series of photographs was taken of substances which were considered the most probable constituents, such as sodium carbonate, sodium chloride, sodium hydrogen fluoride, etc”. By comparing the different patterns recorded, based on Figure 5 of his paper (see Figure 6), Hull concluded “It is evident at a glance that it (NaHF2) corresponds to the impurity in the test sample of sodium fluoride… In other words, sodium hydrogen fluoride is the only impurity that is present in appreciable quantity”.

Figure 5. X-ray powder diffraction patterns of several compounds crystallizing with the same crystal structure as shown in Figure 3 of the original publication (Hull, Reference Hull1919b) © American Chemical Society.

Figure 6. Comparison of the diffraction pattern recorded for NaF reagent with the pattern of pure NaF and NaHF2 (after Figure 5 of Hull, Reference Hull1919b). © American Chemical Society.
He even suggested that “The amount present can be roughly estimated from the-relative intensity of the lines, and this could be made into a quantitative method by preparing for comparison a series of photographs of mixtures of known composition”.
As a second example, Hull analyzed two samples of identical chemical compositions. Both samples contained 33.5% potassium, 19.7% sodium, 16.3% fluorine, and 30.5% chlorine. The recorded powder diffraction patterns for the samples were totally different. Comparing directly the pattern of each sample with the patterns previously recorded for NaF, KF, NaCl, and KCl, Hull demonstrated that one sample contained NaF and KCl, while the other sample contained NaCl and KF. His reasoning was as follows:
“The photographs given by these two samples are shown together, for comparison, in Fig. 6 (see Figure 7 ). It is evident that the two samples are far from being identical, in fact, that they contain nothing in common.”
The first of these photographs is shown again in Fig. 7 (see Figure 8 ), in comparison with sodium fluoride and potassium chloride, and is seen to contain all the lines of both of them, and no other lines. Hence this sample consists of a mixture of sodium fluoride and potassium chloride (36% sodium fluoride, 64% potassium chloride) and nothing else. To show how conclusive the test is, this same sample is shown again in Fig. 8 (see Figure 9 ) in comparison with sodium chloride and potassium fluoride. It is evident that neither of these patterns is present in the sample.
… … … .
The second sample is shown in Fig. 9 (see Figure 10 ), in comparison with sodium chloride and potassium fluoride, and it is evident that it consists of a mixture of these two salts (50.2% sodium chloride, 49.8% potassium fluoride) and ‘nothing else’”.

Figure 7. Pattern diffraction patterns of two samples with identical chemical composition containing Na, K, F, and Cl (Figure 6 of Hull, Reference Hull1919b). © American Chemical Society.

Figure 8. Comparison of the diffraction pattern recorded for a NaF–KCl mixture (sample 1) with the patterns of pure NaF and KCl (Figure 7 of Hull, Reference Hull1919b). © American Chemical Society.

Figure 9. Comparison of the diffraction pattern recorded for a NaCl–KFl mixture (sample 1) with the patterns of pure NaCl and KF (Figure 8 of Hull, Reference Hull1919b). © American Chemical Society.

Figure 10. Comparison of the diffraction pattern recorded for a KF–NaCl mixture (sample 2) with the patterns of pure KF and NaCl (Figure 9 of Hull, Reference Hull1919b). © American Chemical Society.
After showing the unique power of X-ray diffraction to identify phases based on the crystal structure instead of on the composition, Hull concluded:
“These examples are very simple ones. It is possible to go much further. By narrowing the slits and using a smaller tube of test material very sharp, narrow lines can be obtained, and a mixture of several substances analyzed without ambiguity. Furthermore, by long exposures, so as to greatly overexpose the principal components of a mixture, substances present only in very small amounts can be made to show”.
Hull envisioned the great potential of Powder Diffraction as an analytical technique. He anticipated the need for more precise measurements in order to be able to identify the components of mixtures containing many phases. He pointed out that higher resolution would be achieved with the use of narrower slits.
The practical application of the newly developed technique advanced tremendously after the classification and search scheme implemented by Hanawalt and Rinn (Reference Hanawalt and Rinn1936), and Hanawalt, Rinn, and Frevel (Hanawalt et al., Reference Hanawalt, Rinn and Frevel1938), of the Dow Chemical Company. Their central idea was to create a reference library containing diffraction patterns of known materials and use it in the same way that fingerprints were used to identify a person. Their methodology facilitated greatly the identification of unknown materials based on their diffraction patterns. Many other laboratories had started collections of reference diffraction patterns of materials. A key concept developed by the Dow team was the use of a permuted index to quickly identify materials. The index became a practical necessity because of the increasing number of reference patterns that made side by side film comparisons as shown in Figures 7–10 impractical.
In 1937, the American Society for Testing and Materials (ASTM) formalized the creation of a committee chaired by Wheeler P. Davey, then a Professor in the School of Chemistry and Physics of The Pennsylvania State College. This committee led to the formation of the “Joint Committee on Chemical Analysis by X-ray Diffraction Methods”. The first set of the Powder Diffraction File, edited by Davey, was published by the ASTM in 1941. In 1969, the Joint Committee became the “Joint Committee on Powder Diffraction Standards” (JCPDS), which in 1978 was renamed International Centre for Diffraction Data, ICDD (Messick, Reference Messick2012).
Hull continued working on X-ray diffraction for a few years before returning to his primary interests in electronics. Among his many inventions, it is noteworthy the magnetron, a device that converts electrical energy into electromagnetic radiation of the microwave region. An improved version of this device, designed by John Randall and Harry Boot in 1940 at the University of Birmingham, England, was used in the development of the radar which was of paramount importance for the allied victory in War World II. A modern version of the magnetron is currently used in all microwave ovens.
ACKNOWLEDGMENTS
The author gratefully acknowledges Dr. Timothy Fawcett and Dr. Thomas Blanton, of the International Centre for Diffraction Data (ICDD), for the critical reading of the manuscript and their valuable and relevant suggestions. The author also appreciates the revision performed and the suggestions provided by Professor Graciela Díaz de Delgado (Universidad de Los Andes, Mérida, Venezuela). Thanks are due to Mr. Chris Hunter, Vice-president of Collections and Exhibitions of the Museum of Innovation and Science (miSci), Schenectady, New York, for kindly facilitating the photograph of Albert W. Hull.