


Introduction
Poor oocyte quality has a drastic effect on fertility of bovine and other farm animals. Fertility of dairy cows has declined gradually over the last 3 decades. Low fertilization rates and reduced embryonic survival were the most noticeable features of this decline (Moore and Thatcher, Reference Moore and Thatcher2006). One of the primary mechanisms that may be responsible for such abnormal pre- and postimplantation embryo development in lactating cows is poor oocyte quality (Snijders et al., Reference Snijders, Dillon, O’Callaghan and Boland2000; Krisher, Reference Krisher2004; Lucy, Reference Lucy2007). Oocyte quality has also had great contribution to application of assisted reproductive technologies in bovine. In vitro maturation of bovine oocytes followed by in vitro fertilization (IVF) and culture is rapidly increasing around the world for the production of cows with superior genotypes. Thousands of IVF-generated embryos are transferred to recipient cows annually to speed up the dissemination of offspring of superior genetic merit. However, in vitro-produced embryos have frequently shown severe anomalies such as high birth weight, congenital malformations and impaired growth and development (Farin et al., Reference Farin, Piedrahita and Farin2006). These problems were originally derived from the fact that heterogeneous populations of oocytes with varied intrinsic quality are commonly used for IVF that in turn, reflect functional differences in their ability to generate healthy survived offspring (Rizos et al., Reference Rizos, Ward, Duffy, Boland and Lonergan2002; Krisher, Reference Krisher2004; Lonergan and Fair, Reference Lonergan and Fair2008). Therefore, identification of oocyte quality molecular markers is the first step in improving assisted reproductive techniques and farm reproductive performance.
Bull fertility is the other important side of the bovine fertility. As individual bulls service many females, a deficiency in the breeding ability of one bull has a larger effect on herd productivity than fertility problems in a single female. Sperm quality is one of the main factors affecting fertilization success, and differences in embryo production rate among bulls are commonly reported (Larsson and Rodríguez-Martínez, Reference Larsson and Rodríguez-Martínez2000). Another aspect that should be taken into consideration is the genetic information transmitted by spermatozoa to the embryo. The expression of compromised genetic information from the spermatozoa can impair embryo quality (Leibfried-Rutledge, Reference Leibfried-Rutledge1999) and interfere with an in vitro embryo programme’s success. Recently, novel loci harbouring ITGB5 gene whose associations with the bull fertility suggest that it may play a role in sperm–egg interaction and early embryo development (Feugang et al., Reference Feugang, Kaya, Page, Chen, Mehta, Hirani, Nazareth, Topper, Gibbs and Memili2009). Therefore, this study was carried out to gain insights into oocyte transcriptome changes between animals with different genetic merit for fertility in addition to find out possible association between SNPs of maternal candidate genes on bull fertility traits.
Materials and Methods
Animal handling and management
The rules and regulations of the German law of animal protection were completely adhered to throughout handling and management of experimental animals and in accordance with European Union legislation of animal welfare.
Chemicals and reagents
All the chemicals, media, reagents, and other constituents were purchased from Sigma-Aldrich Chemicals, USA.
Experiment I: Transcript profile of oocytes from high versus low fertility cows
Experimental animals and reproductive management
Healthy Holstein-Friesian cows (n = 16) aged between 1.9 and 2.5 years were used in this study (Kommadath et al., Reference Kommadath, Mulder, de Wit, Woelders, Smits, Beerda, Veerkamp, Frijters and Te Pas2010). The experimental animals were reared under identical conditions of feeding and management in the research farm at Waiboerhoeve, Lelystad, The Netherlands. The animals at their calving date were selected with high (EBV-F > 100) or low genetic (EBV-F < 100) merit for fertility. Their estimated breeding value for fertility (EBV-F) (calculated from EBV of their sire and dam’s sire weighted 2 and 1, respectively) ranged between 93 and 103. The EBV-F calculation was based on time to first insemination, percentage non-return within 56 days after first insemination and inter-calving interval (NRS, 2009). In this study, progesterone-peak concentration was correlated to the estimated breeding value for fertility (EBV-F). According to this, the experimental animals were divided into two main groups. The first group contained animals with high estimated breeding value for fertility and progesterone-peak concentration (H-EBV-F > 100; n = 8) and the second group contained animals with low estimated breeding value for fertility and progesterone-peak concentration (L-EBV-F < 100; n = 8). Each group was divided again into subgroups according to the phase of the estrous cycle (day 0 = follicular, day 12 = luteal phase).
Post calving, from 30 days in milk (DIM) onwards, they were monitored daily for signs of behavioural oestrus (continuous observations of 30 min in the morning and afternoon). Behaviours were recorded and scored according to the protocol of Van Eerdenburg (Reference Van Eerdenburg2006): mucous vaginal discharge (3 points), cajoling/flehmen (3), restlessness (5), being mounted but not standing (10), sniffing the vulva of another cow (10), resting with chin on the back of another cow (15), mounting other cows, or attempting to (35), mounting head side of other cows (45), standing heat (100). Points were summed over a rolling 24-h interval and it was assumed that the total score identified oestrus when accumulating to 50 or more. Transrectal ultrasonography was carried out daily during the week preceding expected oestrus. This helped accurately assess the day of ovulation and mapped the timing of each cow’s estrous cycle. Milk progesterone levels were assessed twice a week from 30 DIM onwards and classified according to Mann et al. (Reference Mann, Mann, Blache and Webb2005).
Oocyte collection
Eight cows from each group were humanely euthanized at two different phases of estrous cycle (follicular vs. luteal) after 70 DIM. Each group was divided again into subgroups according to estimated breeding value for fertility (H-EBV-F vs. L-EBV-F). The follicles were classified according to their size into three categories: small (3–5 mm), medium (6–8 mm) and large follicles (≥9 mm). The follicular content of each size category for each female was aspirated individually into modified Parker maturation medium (MPMM) supplemented with 15% oestrus cow serum (OCS), 0.5 mM l-glutamine, 0.2 mM pyruvate, 50 μg/ml gentamycin sulphate, 10 μl/ml follicle stimulating hormone (FSH) (Follitropin; Vetrepharm, Canada) and kept at 39 °C in a thermos flask. The follicular fluid contents were poured into a square grid dish to facilitate finding of oocytes under a stereomicroscope. The collected oocytes were kept in the same maturation medium used for collection before being separated from the surrounding cumulus cells. Morphologically good quality compact cumulus–oocyte complexes (COCs; with clear and homogenous cytoplasm and 3–5 cumulus cells layers) were only used in this experiment. Oocytes from each follicular size category, phase and EBV-F were handled and separately.
Oocytes denudation and storage
In this study, only COCs from the small follicles (3–5 mm) at days 0 and 12 after oestrus were used for the analysis of transcript abundance. Cumulus cells were removed from the oocytes of each day of estrous cycle by repeat pipetting in maturation medium supplemented with hyaluronidase 1 mg/ml until all cumulus cells were removed under a stereomicroscope. Cumulus-free oocytes and the corresponding cumulus cells from each day were washed two times in phosphate-buffered saline (PBS) and snap frozen separately in cryo-tubes containing 20 μl of lysis buffer [0.8 % IGEPAL, 40 U/μl RNasin (Promega Madison WI, USA), 5 mM dithiothreitol (DTT) (Promega Madison WI, USA)] and kept at −80 °C until RNA isolation.
In vitro embryo production
Ovaries of cows slaughtered at a local abattoir were collected and transported within 2–3 h in a thermo flask containing physiological saline solution at 30 °C. Good quality COCs with homogenous cytoplasm and multiple layer of cumulus were aspirated from follicles with 2–8 mm diameter and were washed in modified tissue culture medium (TCM199) supplemented with 33.9 mM NaCHO3, 4.4 mM HEPES, 2.9 mM calcium lactate, 2 mM pyruvate, 12% (v/v) fetal calf serum, 55 μg/ml gentamicin. The collected COCs were cultured in groups of 50 in 400-μl maturation medium supplemented with 10 μg/ml FSH (FSH-p; Sheering, Kenilworth, NJ, USA), and covered with mineral oil in an incubator with a humidified atmosphere with 5% (v/v) CO2 in air for 24 h at 39 °C.
Fertilization was carried out in 400 μl of fertilization medium (Fert-TALP) medium supplemented with 10 μM hypotaurine, 20 μM penicillinamine, 2 μM noradrenaline, 50 μg/ml gentamicin, 6 mg/ml bovine serum albumin (BSA), and 1 μg/ml heparin. Finally, concentration of sperm in fertilization droplets was adjusted to 2 × 10⁶ sperms/ml for a group of 50 oocytes. Presumed zygotes were washed three times from sperms and denuded from cumulus cells after 18 h of incubation. Zygotes were washed three times and cultured in CR-1aa culture medium (Rosenkrans and First, Reference Rosenkrans and First1994) overlaid with mineral oil in an incubator with a humidified atmosphere and 5% (v/v) CO2 in air for 24 h at 39 °C.
RNA isolation from oocytes and in vitro-produced embryos
Total RNA was extracted at three different time points: (1) six pools of oocytes, each with 30 oocytes from H-EBV-F vs. L-EBV-F at follicular phase (day 0) which used for the first gene expression profile experiment; (2) six pools of oocytes, each with 30 oocytes from H-EBV-F vs. L-EBV-F at day 12 of estrous cycle (luteal phase) which used for a second gene expression profile experiment; and (3) two pools of different stages of preimplantation period each containing 10 of each stage of immature oocytes (IMO), matured oocytes (MO), zygote (ZT), two-, four-, eight-, morula (Mor) and blastocyst (Blst) used for semi-quantitative PCR. In all cases, total RNA was extracted according to PicoPureTM RNA Isolation kit (MDS Analytical Technologies GmbH, Ismaning, Germany). Briefly, oocytes were mixed and incubated with 100 µl extraction buffer and for 30 min at 42 °C to release RNA. The lysate was loaded onto a spin column and centrifuged for 1 min, at 16,000 g at room temperature followed by DNA digestion using DNase I (Qiagen GmbH, Hilden, Germany). The spin column was washed twice with two different washing buffers and RNA was eluted with nuclease-free water (30 µl). The total volume of RNA from each pool of oocytes was divided into two 15 µl aliquots. One aliquot was used for cDNA microarray analysis, while the other aliquot was used for real-time PCR validation. The quality and concentration of each RNA of all samples was evaluated using a NanoDrop spectrophotometer (Thermo Fisher Scientific). The absorbance at A260/A280 was in the range 1.9–2.1. In addition, gel electrophoresis was performed to check RNA purity. RNA from all samples was adjusted before RNA amplification for transcriptome profile experiments. The same adjustment was done before cDNA synthesis using an oligo(dT)23 primer (Invitrogen, Karlsruhe, Germany), while the T7 promoter attached to an oligo(dT)21 primer was used for array work.
RNA amplification, labelling and hybridization
RNA amplification was performed as described in our previous studies (Mamo et al., Reference Mamo, Sargent, Affara, Tesfaye, El-Halawany, Wimmers, Gilles, Schellander and Ponsuksili2006; Ghanem et al., Reference Ghanem, Hölker, Rings, Jennen, Tholen, Sirard, Torner, Kanitz, Schellander and Tesfaye2007) using the AmpliScribe T7 transcription kit (Epicentre Technologies, Oldendorf, Germany). The amplified RNA (3 μg) was first labelled with aminoallyl-dUTP then with n-hydroxysuccinate (NHS)-derivatized Cy3 and Cy5 dyes (Amersham Biosciences, Freiburg, Germany). Dye-swap labelling was performed per each sample for three independent biological replicates (six arrays for each experiment). Array hybridization was carried out according to Hedge et al. (Reference Hedge, Qi, Abernathy, Gay, Dharap, Gaspard, Hughes, Snesrud, Lee and Quackenbush2000); Mamo et al. (Reference Mamo, Sargent, Affara, Tesfaye, El-Halawany, Wimmers, Gilles, Schellander and Ponsuksili2006); and Ghanem et al. (Reference Ghanem, Hölker, Rings, Jennen, Tholen, Sirard, Torner, Kanitz, Schellander and Tesfaye2007). The samples were applied to a bovine-specific array (Sirard et al., Reference Sirard, Dufort, Vallee, Massicotte, Gravel, Reghenas, Watson, King and Robert2005) for 16–20 h at 42 °C for incubation in a hybridization chamber (GFL, Dülmen, Germany). The arrays were first washed twice with 2× standard saline citrate (SSC), 0.1% N-lauroyl sarcosine (SDS) buffer at 42 °C for 5 min, then once with 1× SSC, 0.2× SSC and 0.1× SSC at room temperature for 5 min. The slides were finally dried by centrifugation for 2 min at 2000 rpm.
Array scanning and data analysis
An Axon GenePix 4000B scanner (Axon Instruments, Foster City, CA, USA) was used for scanning all arrays. The analysis of array data was done using Linear Models for Microarray Data (LIMMA) maintained by Bioconductor. For obtaining genes differentially expressed in this study, the false discovery rate (FDR) was set at 10% and a P-value of ≤ 0.05. Additionally, guidelines for the Minimum Information About Microarray Experiments (MIAME) have been followed throughout the array work.
Quantitative real-time PCR
For validation of the transcriptome profile, genes differentially regulated (n = 11) were profiled using quantitative real-time PCR (Table 1). Housekeeping gene GAPDH was used as an internal control, and was run first with all cDNA samples on an ABI PRISM® 7000 sequence detection system (Applied Biosystems, Foster City, CA, USA). All PCR reactions were carried out in a 20 µl total volume containing 10 µl of Fast SYBR® iQ® RealMasterMixTM (Eppendorf, Hamburg, Germany). The cDNA samples were run in duplicate using the same PCR cycling settings (3 min at 95 °C then 15 s at 95 °C for 40 cycles and 30 s at 60 °C). The relative standard curve method was performed to analyse the real-time PCR results as the relative transcript abundance after normalization with GAPDH result.
Table 1. Details of primers used for quantitative real-time PCR analysis
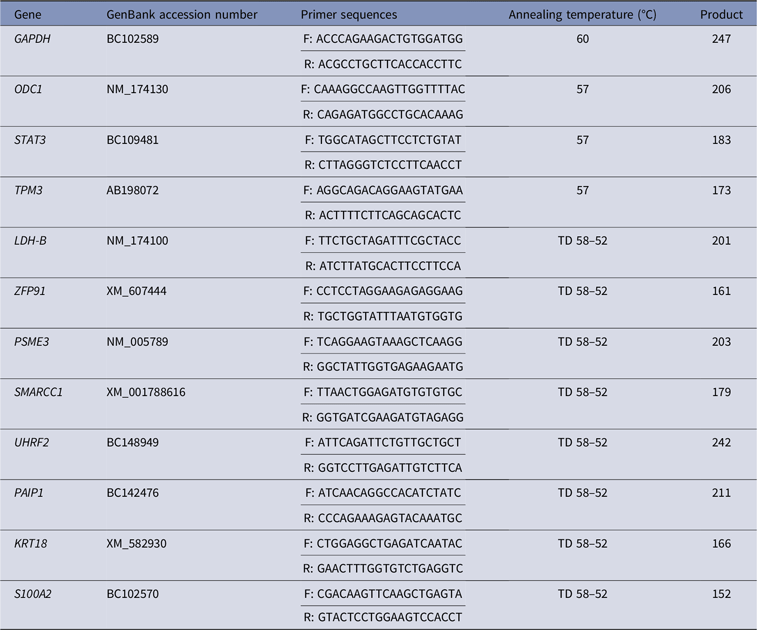
TD, Touchdown PCR.
Semi-quantitative PCR
Reverse transcription coupled with PCR was used to find out the spatiotemporal expression of ODC1 and STAT3 throughout different stages of preimplantation development. PCRs were performed in a 20-μl reaction volume containing 0.5 μl of each primer (10 pmol), 2 μl of 10× PCR buffer, 0.5 μl of dNTP (50 μM), 0.5 U Taq DNA polymerase, 14.4 μl Millipore H2O which finally added to 2 μl cDNA templates and 2 μl of Millipore H2O as the negative control. PCR reactions were carried out in a PT-100 Thermocycler (MJ Research), the thermal cycling program was set as: denaturation at 95 °C for 5 min, followed by 35 cycles at 95 °C for 30 s, annealing at the corresponding temperature (as shown in Table 1), extension at 72 °C for 1 min and a final extension step at 72 °C for 10 min. Finally, PCR products were separated by agarose gel electrophoresis and observed under ultraviolet illumination in the presence of ethidium bromide. All fragments were sequenced and their lengths were as expected and identical to the known bovine sequences deposited in the NCBI database.
Experiment II: Association analysis of some candidate genes with bull fertility
Bull population and semen quality
Eleven cattle breeds (Limousin, Gelbvieh, Blond d’Aquitaine, Salers, Vorderwälder, Hinterwalder, Charolais, Red Angus, Piemontese, Pinzgauer, and Galloway) were used to screen for SNPs. Semen samples were collected from 310 German Holstein bulls belonging to the Rinder-Union West eG (RUW, Münster, Germany) station and were used for association studies. The minimum number of insemination recorded for each was 1000. Semen quality traits including sperm volume per ejaculate (ml), sperm concentration (109/ml), sperm motility (%), and survivability after thawing (%) were available. In addition, acrosomal integrity (PNA/PSA), plasma membrane integrity (PMI) and DNA fragmentation index (DFI) were estimated for each individual bull using flow cytometry. The non-return rate (NRR) in addition to other information including inseminator, region, status of cow (heifer, cow and multi calving), insemination date, status of bull (birth date) for each animal were derived from the RUW centre, Germany.
DNA isolation
Semen straws were first thawed and mixed with 4 ml of saline solution. The mixture was centrifuged at 5000 g for 10 min and the supernatant was removed. The pellet was resuspended in 4 ml digestion buffer containing proteinase K, SDS and mercaptoethanol, then incubated at 56 °C overnight to digest protein. Afterwards, DNA was extracted using phenol–chloroform (1:1 v/v) and centrifugation (5000 g for 10 min) two times. DNA was precipitated by adding 3 M sodium acetate (pH 5.2) and isopropanol accompanied by gentle shaking. The DNA pellet was washed with 70% ethanol twice and dried at room temperature. Finally, the washed DNA pellet was resuspended with 1 ml Tris-EDTA (TE) buffer and diluted to a final concentration of 50 ng/ μl and kept at 4 °C until genotyping.
Comparative sequencing for SNP detection
A set of specific primers (Table 2) that covered the detected SNPs of ODC1 and STAT3 genes was designed before samples were sequenced. PCRs were conducted under the same conditions detailed for semi-quantitative PCR and 5 μl of the product was checked on 1.5% agarose gel. The remaining PCR product was used as the template in a second PCR called the sequencing PCR after purification with ExoSAP-IT (USB Corporation). Sequencing PCR was performed using a CEQ 8000 Genetic Analysis System (Beckman coulter). This PCR contained 8 μl of Millipore water, 2 μl of 1.6 pmol of forward or reverse specific primers and 4 μl of DTCS Quick Start Master Mix (Beckman Coulter). PCR sequencing reactions were performed for 30 cycles at 96 °C for 20 s, 50 °C for 20 s, with a final step at 60 °C for 4 min. The sequencing PCR product was transferred to a 1.5 ml sterile tube and mixed with 5 μl stop solution (2 μl 3M NaOAc, 2 μl 100 mM EDTA, and 1 μl glycogen). The DNA pellet was washed several times with descending concentrations of ethanol and finally dried using a speed vacuum concentrator and loaded for sequencing. The final sequence of each DNA fragment was blasted against the GenBank database (http://www.ncbi.nlm.nih.gov/blast/).
Table 2. Details of primers used for genotyping

TD, Touchdown PCR.
Genotyping/restriction fragment length polymorphisms (RFLP)
To detect polymorphisms of ODC1 and STAT3 genes, 310 German Holstein bulls were genotyped after genomic DNA extraction from all semen samples. Genotyping for polymorphism was performed using polymerase chain reaction-restriction fragment length polymorphism (PCR-RFLP) using specific primers that cover each SNP of the corresponding gene. The selection of each restriction enzyme was performed based on the recognition site of each polymorphic site (http://tools.neb.com/NEBcutter2/index.php). ODC1 SNPs were confirmed using PCR-RFLP with restriction enzymes SphI and RsaI, respectively. In addition, Tsp45I and MspI restriction enzymes were used to confirm STAT3 SNPs. In all cases, the PCR-RFLP product was incubated with restriction enzymes in a 10 μl reaction volume (1 unit of restriction enzyme, 1 μl of 10× restriction buffer, 3.9 μl ddH2O and with 5 μl PCR product) and incubation overnight over the range 37 °C to 65 °C for 1–6 h according to conditions for each restriction enzyme. Digested products were then visualized on a 3% agarose gel stained with ethidium bromide. Different fragment lengths between non-digested and digested DNAs reflected the genotype of a specific DNA sample, as shown in Fig. 1.

Figure 1. PCR-RFLP for genotyping of STAT3 and ODC1 using restriction enzymes.
Statistical analysis
Real-time PCR data analysis
Data for relative transcript abundance were analyzed using the General Linear Model (GLM) of the Statistical Analysis System (SAS) software package version 8.0 (SAS Institute Inc., NC, USA). Differences in mean values were tested using analysis of variance (ANOVA) followed by a multiple pairwise comparison t-test.
Association analysis of ODC1 and STAT3 sequence variant
Allelic, and genotype frequencies as well as the Hardy–Weinberg equilibrium were analyzed using the Pearson’s chi-squared test. For the association analysis of SNPs, the following traits were observed: NRR; semen quality traits namely VOL, CONC, MOT and SUVR; and sperm flow cytometry parameters namely PMI, positive acrosomal (PAS) and DFI. Data were analyzed using the GLM. P-values ≤ 0.05 were considered as having significant association. All analyses were conducted using the SAS 9.1 Package (SAS Inc., NC, USA).
Model for NRR (Model I)
NRR was calculated by dividing number of cows that were inseminated and did not return for another A.I. service (56-days from last service) by total number of inseminated cows. The bull fertility traits were assumed to be normally distributed for each bull. In this association analysis, the genotype variant, breeds and farms were considered as main effects that influence bull fertility:
 $$ yijk{\rm{ }} = {\rm{ }}\mu + {\rm{ }}GENi{\rm{ }} + {\rm{ }}BRj{\rm{ }} + {\rm{ }}Fk{\rm{ }} + {\rm{ }}\left( {GEN\, {*}\, BR} \right)ij{\rm{ }} + {\rm{ }}\left( {GEN\, {*}\, F} \right)ik{\rm{ }} + {\rm{ }}\left( {GEN\, {*}\, BR\, {*}\, F} \right)ijk{\rm{ }} + {\rm{ }}\varepsilon ijk $$
where y = Non-return rate; µ = The overall mean; GENi = Effect of the genotype for the gene under investigation for bull i; BRj = Effect for the colour of bull (Black or brown) j; Fk = Effect of farm for each cow k; (GEN * BR)ij = Interactional effect of genotype and the colour of each bull; (GEN * F)ik = Interactional effect of bull genotype and farm for each cow; (GEN * BR * F)ijk = Interactional effect of genotype and colour of bull and farm for each cow; and ϵijk = Error.
Model for sperm quality traits (Model II)
For sperm quality traits, statistical analyses were performed using GLM with the main effects of genetic variations and breeds. Multiple pairwise comparisons were conducted using the Tukey–Kramer test. Differences of P ≤ 0.05 were considered as significant:
 $$ yij{\rm{ }} = {\rm{ }}\mu + {\rm{ }}GENi{\rm{ }} + {\rm{ }}BRj{\rm{ }} + {\rm{ }}\left( {GEN\, {*}\, BR} \right)ij{\rm{ }} + {\rm{ }}\varepsilon ij $$
y = Ejaculate volume/ concentration/ motility/ survivability; µ = The overall mean; GENi = Effect of the genotype for the gene under investigation for bull i; BRj = Effect for the colour of bull (Black or brown) j; (GEN * BR)ij = Interactional effect of genotype and the colour of each bull; and ϵij = Error.
Model for sperm flow cytometric parameters (Model III)
For sperm flow cytometric parameters, statistical analyses were performed using GLM with the main effects of genetic variations, breeds and farms. Multiple pairwise comparisons were conducted using the Tukey–Kramer test. Differences of P ≤ 0.05 were considered as significant association. The following model was used:
 $$ yijk{\rm{ }} = {\rm{ }}\mu + {\rm{ }}GENi{\rm{ }} + {\rm{ }}BRj{\rm{ }} + {\rm{ }}Fk{\rm{ }} + {\rm{ }}\left( {GEN\, {*}\, BR} \right)ij{\rm{ }} + {\rm{ }}\left( {GEN\, {*}\, F} \right)ik{\rm{ }} + {\rm{ }}\left( {GEN\, {*}\, BR\, {*}\, F} \right)ijk{\rm{ }} + {\rm{ }}\varepsilon ijk $$
y = PMI/ PAS/ DFI; µ = The overall mean; GENi = Effect of the genotype for the gene under investigation for bull i; BRj = Effect for the colour of bull (Black or brown) j; Fk = Effect of farm for each bull k; (GEN * BR)ij = Interactional effect of genotype and the colour of each bull; (GEN * F)ik = Interactional effect of genotype and the farm of each bull; (GEN * BR * F)ijk = Interactional effect of genotype, colour and farm of each bull; and ϵijk = Error.
Results
Transcript profile of oocytes from high versus low fertility cows
To get differentially expressed transcripts with strong confidence, P-values (P < 0.05) and FDR (< 5%) were together used for genes selection cut-off. Data analysis using the R-program package revealed, in total, 62 and 69 genes to be differentially expressed between oocytes recovered from cows with high versus low fertility merit at days 0 and 12 of the estrous cycle, respectively. At day 0, there were 32 upregulated and 30 downregulated genes in high compared with low fertility merit-derived oocytes (Tables 3 and 4). Furthermore, the transcript abundance of 32 genes was overexpressed, while 37 genes were lower expressed in high compared with low fertility merit-derived oocytes recovered at day 12 (Tables 5 and 6).
Table 3. Genes upregulated in high compared with low fertility merit-derived oocytes at day 0 (N = 18)

Table 4. Genes downregulated in high compared with low fertility merit-derived oocytes at day 0 (N = 24)
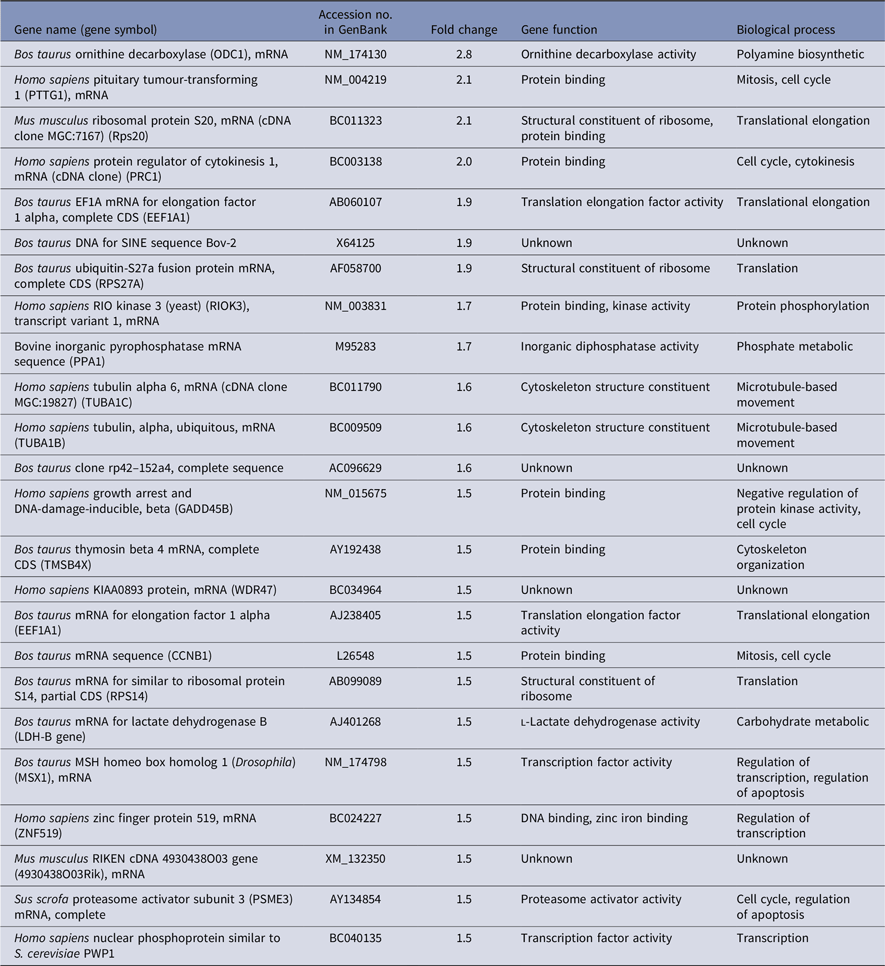
Table 5. Genes upregulated in high compared with low fertility merit-derived oocytes at day 12 (N = 27)
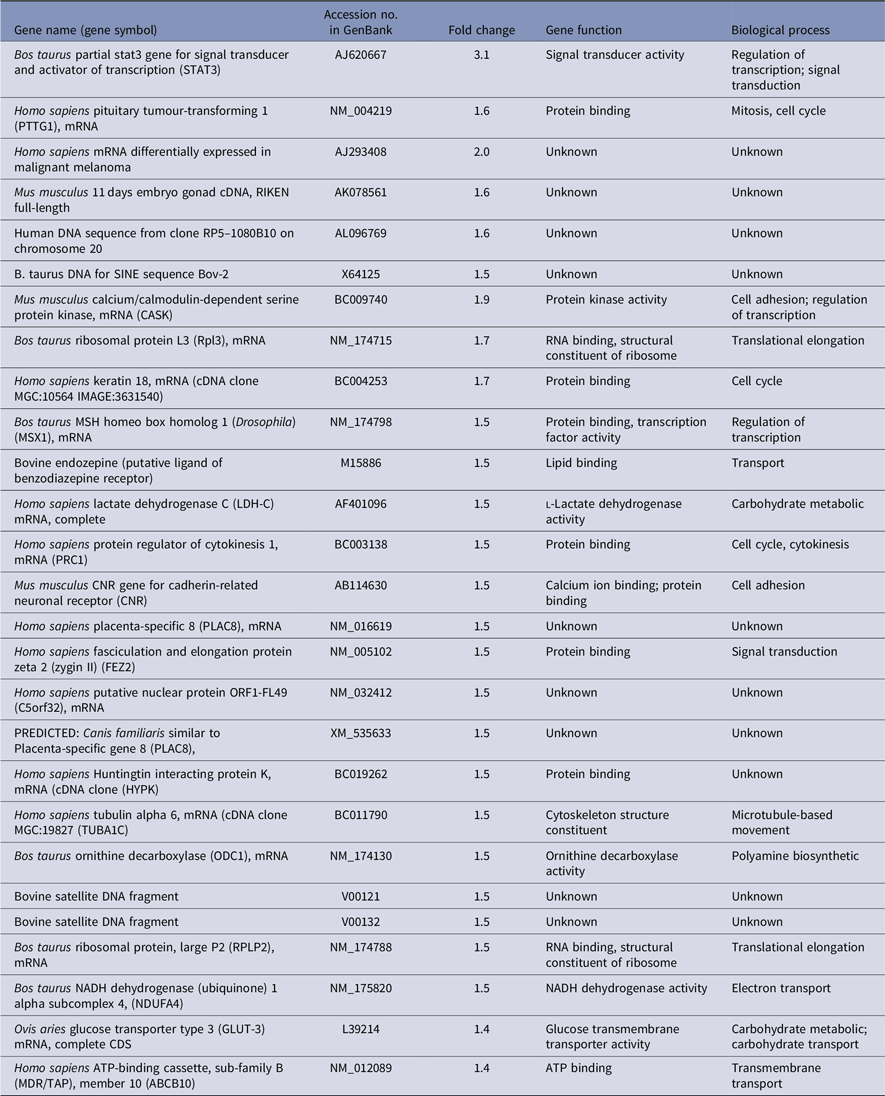
Table 6. Genes downregulated in high compared with low fertility merit-derived oocytes at day 12 (N = 30)

Functional classification of target genes
The ontological classification of differentially regulated genes in high versus low fertility merit recovered oocytes were performed using the Gene Ontology Consortium classifications (http://www.geneontology.org), which annotates transcripts in regard to their biological processes and molecular functions. The resulting data were supplemented with additional information from the Centre and CowBase at the AgBase database (www.agbase.msstate.edu). We observed that certain functional annotations were more represented in either high or low fertility merit recovered oocytes.
Furthermore, several genes were shown not only to be regulated by fertility merit but also by the day of oocyte recovery during the estrous cycle. Signal transducer and activator of transcription 3 (STAT3) was overexpressed in oocytes recovered from animals with high fertility merit at both days 0 and 12. Other genes such as PTTG1, MSX, ODC1 and TUBA1C were downregulated at day 0 and upregulated at day 12 in high compared with low fertility merit recovered oocytes. In contrast, the transcript abundance of CH1, ORCS13962 and TPM3 were upregulated at day 0 and downregulated at day 12 in high compared with low fertility merit recovered oocytes.
Transcript profile of oocytes from high versus low fertility cows at follicular phase
High fertility merit recovered oocytes at day 0 were enriched with transcripts regulating transcription (ZFP91), spindle organization and biogenesis (AURKA), electron transport (FL405 and ORCS12350), chromatin remodelling (SMARCC1) translation (RPS25) and G-protein coupled receptor signalling (GPR15). While low genetic merit recovered oocytes at the same day overexpressed genes with ornithine decarboxylase activity (ODC1), translation (RPS20, RPS14 and RPS27A), protein and amino acid phosphorylation (RIOK3) microtubule-based movement (TUBA1C and TUBA1B), metabolism (LDH-B) and negative regulation of protein kinase activity (GADD45B).
Transcript profile of oocytes from high versus low fertility cows at luteal phase
Conversely, genes involved in transcription (CASK), translation (RPL13), signal transduction (FEZ2), cell adhesion (CNR) and transport (GLUT-3 and ABCB10) were overexpressed in high genetic merit recovered oocytes at day 12. Moreover, low genetic merit recovered from oocytes on the same day expressed genes that mainly regulated mRNA processing (PAPOLG), steroid biosynthesis (HSD17B11), protein transport (ARF4), transcription (LMO3 and MYF5) and cell to cell signalling (DLGAP5).
Quantitative real-time PCR confirmation
Quantitative real-time PCR (q-PCR) analysis was carried out using both amplified and non-amplified RNA of the same samples. In total, 11 differentially expressed genes (ODC1, STAT3, LDH-B, ZFP91, PSME3, TPM3, SMARCC1, UHRF2, PAIP1, KRT18 and S100A2) were selected and quantified using qPCR. The relative abundance of the GAPDH gene was first tested and showed no variability between the samples under investigation. Accordingly, at day 0 of the oestrous cycle, the transcript abundance of five genes out of seven was in accordance with the microarray result (Fig. 2). The expression profile of TPM3 and SMARCC1 genes could not be confirmed by qPCR. Similarly, at day 12 of the oestrous cycle, five genes out of seven showed significant differences in gene expression between oocytes derived from high vs. low fertility derived oocytes as observed in array analysis (Fig. 3). The transcript abundance for ODC1 and S100A2 were also confirmed but the differences between the two groups of oocytes were not statistically significant. Semi-quantitative analysis of ODC1 and STAT3 genes revealed the detection of these two genes throughout the bovine preimplantation period (Fig. 4).

Figure 2. Quantitative real-time PCR validation of seven differentially expressed genes in oocytes derived from high and low progesterone level at day 0 of the estrous cycle as identified by microarray data analysis. The relative abundance of mRNA levels represents the amount of mRNA compared with the calibrator (with the lowest normalized value). Bars with different superscripts (a, b) are significantly different at P < 0.05.

Figure 3. Quantitative real-time PCR validation of seven differentially expressed genes in oocytes derived from high and low progesterone level at day 12 of the estrous cycle as identified by microarray data analysis. The relative abundance of mRNA levels represents the amount of mRNA compared with the calibrator (with the lowest normalized value). Bars with different superscripts (a, b) are significantly different at P < 0.05.

Figure 4. Semi-quantitative PCR validation of ODC1 and STAT3 genes in bovine preimplantation period. Developmental stages is indicated above each lane: immature oocytes (IMO), matured oocytes (MO), zygote (ZT), two-, four-, eight-cell, morula (Mor) and blastocyst (Blst). The fragment size corresponding to each gene indicated in the right side. RT-PCR was performed using corresponding primers listed in Table 1 and Millipore water was the negative control and GAPDH was the housekeeping gene.
Association study
Polymorphisms in ODC1 and STAT3
Two candidate genes (STAT3 and ODC1) were selected for SNP screening. Chi-squared test revealed that ODC1 and STAT3 loci were in Hardy–Weinberg equilibrium in the bull population (Table 7). For ODC1, two polymorphisms were found at positions 89,914,567 and 89,914,800 in chromosome 11. The former SNP had a transition from adenine (A) to guanine (G) and the later showed a transversion from thymine (T) to adenine (A). These SNPs were confirmed by PCR-RFLP with restriction enzymes SphI and RsaI, respectively. For ODC1 89,914,567, genotyping results showed that among the animals 97 (32.8%) were homozygous ‘AA’, 157 (53%) were heterozygous ‘AG’ and 42 (14.2%) were homozygous ‘GG’. Frequencies of the allele ‘A’ and ‘G’ were 59.3% and 40.7%, respectively. For ODC1 89,914,800, genotyping results showed that among animals 283 (95.6%) were homozygous ‘AA’ and the heterozygote ‘AT’ was rare with only 13(4.4%) frequency in the bull population. Frequencies of the allele ‘A’ and ‘T’ were 97.8% and 2.2%, respectively. Details of genotypes and allele frequencies are shown in Table 7.
Table 7. Genotype, allele frequencies and the chi-squared test of ODC1 and STAT3 loci

Comparative sequencing revealed six polymorphisms in STAT3 at position 43,774,184, 43,774,202, 43,774,208, 43,774,252, 43,774,324 and 43,758,551 in chromosome 19. These SNPs were transition from guanine (G) to adenine (A), guanine to adenine, thymine (T) to cytosine (C), guanine to adenine, adenine to guanine and guanine to adenine, respectively. Only two of these located at position 43,774,208 and 43,758,551 were confirmed by PCR-RFLP using restriction enzyme Tsp45I and MspI, respectively. STAT3 43774108 was found in intron part of the genome. The frequencies of homozygote ‘TT’, ‘CC’ and heterozygote ‘TC’ of STAT3 43,774,108 were 14.5%, 43.9% and 41.6%, respectively. The frequency of allele ‘T’ was nearly twice as the frequency of allele ‘C’ (Table 7). Polymorphism of STAT3 43,758,551 was found in the coding region at exon 20. It is a synonymous SNP (silent mutation, CCG→CCA) in which both forms lead to the coding of same amino acid. The frequency of homozygote ‘GG’ was 79.4%. However, homozygote ‘AA’ and heterozygote ‘AG’ were rare in the bull population with only 0.7% and 19.9%, respectively (Table 7). Allele ‘G’ of STAT3 43,758,551 was extremely high in allele frequency, nearly 90%. The rest 10% was for allele ‘A’.
Association of ODC1 and STAT3 polymorphisms with bull fertility traits
Association of polymorphisms with NRR
The NRR (%) was calculated by number of non-return cows (56 days last service) divided by number of inseminations. Association of loci ODC1 and STAT3 with NRR was analyzed by using the GLM (Model I). The statistical results were given as least square means and their standard errors. The mean value of these genotype variants were in a very small range, between 71.51% and 73.9% within bull population (Table 8). Therefore, it is not surprising that genotype variants of these four SNPs were not associated with NRR.
Table 8. Single nucleotide polymorphisms in ODC1 and STAT3 and their association with NRR (%)
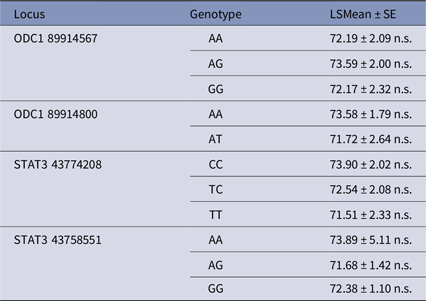
n.s. No significant difference.
Association of polymorphisms with sperm quality parameters
The result (Table 9) revealed that ODC1 and STAT3 were significantly associated with semen volume per ejaculation (VOL) and sperm concentration (CONC), except sperm concentration in genotype variants of STAT3 43,774,208. For example, heterozygote ‘AT’ of ODC1 89,914,800 was higher in VOL and CONC compared with homozygote ‘AA’. Additionally, STAT3 43,774,208 has significant effect on sperm survival rate after thawing (SUVR), and STAT3 43,758,551 was highly associated with sperm motility (MOT). In bull populations, homozygote ‘CC’ of STAT3 43,774,208 and heterozygote ‘AG’ of STAT3 43,758,551 were higher in SUVR and MOT, respectively.
Table 9. Single nucleotide polymorphisms in ODC1 and STAT3 and their association with sperm quality traits
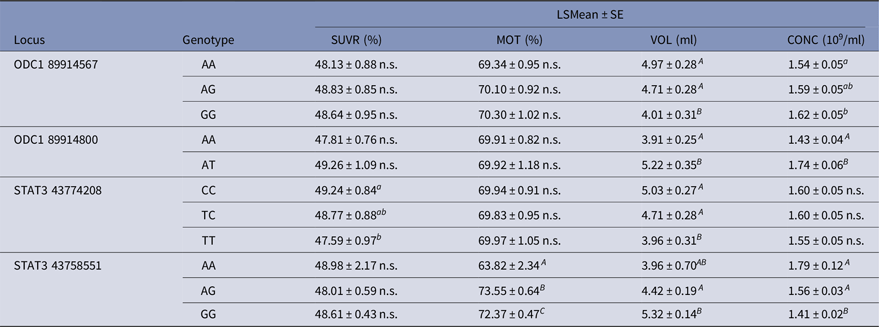
a,bP < 0.05; A,B P < 0.0001; n.s. No significant difference.
Association of polymorphisms with sperm flow cytometry parameters
Effects of ODC1 and STAT3 on sperm flow cytometry parameters were performed using the GLM (Model III). Three main effects, genotype variants, breeds and farms, were taken into consideration in this association analysis.
The analyzed data (Table 10) revealed that ODC1 and STAT3 were significantly associated with PMI, PAS and DFI. However, no association of STAT3 43,774,208 with PAS was found. Accordingly, ODC1 89,914,800 sequence variants were highly associated with PMI, PAS and DFI, and their related P-value was less than 0.0001. Homozygote ‘AA’ had higher PMI and less DNA damage, but was lower in PAS integrity. For STAT3 43,758,551, genotype ‘AG’ and ‘GG’ had better performance in PMI and degree of DNA damage compared with genotype ‘AA’. However, genotype ‘AA’ and ‘AG’ were higher in PAS integrity compared with genotype ‘GG’.
Table 10. Single nucleotide polymorphisms in ODC1 and STAT3 and their association with sperm flow cytometry parameters

a,bP < 0.05; A,BP < 0.0001; n.s. No significant difference.
Discussion
The developmental potential of an oocyte is determined by multifactor interactions, and that multiple factors must be considered simultaneously to accurately predict its quality (Feng et al., Reference Feng, Sui, Han, Chang, Zhou, Liu, Bao and Tan2007). Although there is an increasing interest in identifying markers for oocyte competence, however few studies have reported the influence of genetic merit on oocyte quality. In a large embryo transfer study, the maternal genetic ability to respond to superovulation was demonstrated (Govignon et al., Reference Govignon, Rohou, Ponsart, Delcroix and Humblot2000) as well as the contribution of recipient cattle to fertility after embryo transfer (McMillan and Donnison, Reference McMillan and Donnison1999). Tamassia et al. (Reference Tamassia, Heyman, Lavergne, Richard, Gelin, Renard and Chastant-Maillard2003) showed a distinctive variation in number of oocytes recovered by ovum pick-up per cow allowing the classification of some cows as systematically ‘good’ or ‘bad’ oocyte producers. The same effect was also observed for blastocyst production, with cows showing a phenotype of ‘good’ or ‘bad’ blastocyst producer. Yang et al. (Reference Yang, Zhao, Li, Liu, Huang, Huang, Zeng and Zeng2008) demonstrated that an individual oocyte donor may have an effect on nuclear transfer efficiency and cloned embryo development in vitro. At this point, it was not possible to identify the origin of this maternal effect as it could be of genetic or nuclear (Watson et al., Reference Watson, Westhusin, De Sousa, Betts and Barcroft1999; Picton, Reference Picton2001) or cytoplasmic origin (Cummins, Reference Cummins2001; Duranthon and Renard, Reference Duranthon and Renard2003). Therefore, the current study was performed to get insight into oocyte transcriptome changes between animals with different genetic merit for fertility.
In this study, progesterone-peak concentration of the females used for oocyte retrieval was correlated to the estimated breeding value for fertility (EBV-F). The calculation of the EBV-F used the non-return percentage at day 56 post insemination, calving interval and interval to first insemination as fertility parameters. Especially, the first two parameters were positively influenced by a high embryo survival rate, and linked to high P4 level. This makes sense because reduction in circulating progesterone concentrations was likely to be one cause of reduced fertility in lactating dairy cows. Progesterone and the overall fertility of the dairy cow have been shown to be connected in many different ways. Cows with higher progesterone concentrations after insemination have been reported to be more fertile (Butler et al., Reference Butler, Calaman and Beam1996; Stronge et al., Reference Stronge, Sreenan, Diskin, Mee, Kenny and Morris2005; Demetrio et al., Reference Demetrio, Santos, Demetrio and Vasconcelos2007) and cows with a double ovulation had higher progesterone concentrations and tended to be more fertile even when used as embryo transfer recipients (Sartori et al., Reference Sartori, Gümen, Guenther, Souza, Caraviello and Wiltbank2006). Positive association between milk or plasma P4 concentration and embryo survival on days 4–6 of the estrous cycle (Green et al., Reference Green, Hunter and Mann2005; McNeill et al., Reference McNeill, Diskin, Sreenan and Morris2006) and elevated concentrations of progesterone during diestrus positively affected pregnancy rate (França et al., Reference França, da Silva, Pugliesi, Van Hoeck and Binelli2017). While elevated systemic progesterone from day 3 post-conception was associated with advanced conceptus elongation (Carter et al., Reference Carter, Forde, Duffy, Wade, Fair, Crowe, Evans, Kenny, Roche and Lonergan2008). Coordination of progesterone and other regulators (like IFNT, and prostaglandins) control expression of genes involved in embryo-endometrial cross talk, which govern conceptus growth and survival (Spencer et al., Reference Spencer, Forde and Lonergan2016). Indeed, embryo development was reduced following inhibition of progesterone synthesis by cumulus cells or blocking of nuclear progesterone receptor activity during in vitro maturation, which supported the idea that progesterone has a potential role in determining oocyte quality (Aparicio et al., Reference Aparicio, Garcia-Herreros, O’Shea, Hensey, Lonergan and Fair2011). Consistent with this idea, the two promising candidate genes (STAT3 and ODC1) were detected in this study and linked with oocyte developmental capacity of cows with superior fertility and higher progesterone concentration.
STAT3, a member of the signal transducer and activator of transcription (STAT) family was overexpressed in oocytes recovered from highly fertile cows with a high progesterone profile at both days 0 and 12. It is not surprising that the STAT3 transcript is the one of our top candidate genes highly expressed in competent oocytes. As we have shown in another study performed in our laboratory, this gene was also overexpressed in developmentally competent oocytes when selected based on BCB staining in bovine (Torner et al., Reference Torner, Ghanem, Ambros, Hölker, Tomek, Phatsara, Alm, Sirard, Kanitz, Schellander and Tesfaye2008), and equine species (Mohammadi-Sangcheshmeh et al., Reference Mohammadi-Sangcheshmeh, Held, Ghanem, Rings, Salilew-Wondim, Tesfaye, Sieme, Schellander and Hoelker2011) and a study done in camel by an other group (Fathi et al., Reference Fathi, Ashry, Salama and Badr2017). Activation of STAT3 induces cumulus expansion and oocyte maturation, while inhibition markedly prevented the cumulus expansion process (Tscherner et al., Reference Tscherner, Brown, Stalker, Kao, Dufort, Sirard and LaMarre2018). STAT3 transcript abundance revealed an increased expression in MII oocytes compared with α-amanitin-treated 8-cell embryos and suggested the essential roles of this gene as transcription factors during embryonic genome activation and maternal-to-embryonic transition (Misirlioglu et al., Reference Misirlioglu, Page, Sagirkaya, Kaya, Parrish, First and Memili2006). The essential nature of relationships between STAT family and progesterones concerning fertility was illustrated by mouse knockout models, wherein phenotypic changes observed in progesterone-null mice has led to female infertility as observed in mice lacking a functional STAT5 gene (Conneely et al., Reference Conneely, Lydon, DeMayo and O’Malley2000). Disruption of STAT5 has led to infertility in females as a result of small-size or an absent corpora lutea (Teglund et al., Reference Teglund, McKay, Schuetz, van Deursen, Stravopodis, Wang, Brown, Bodner, Grosveld and Ihle1998). Because the primary source of progesterone is the corpora lutea of the ovary, lack of development of corpora lutea would have significant effects on the establishment of pregnancy. Conversely, mice lacking both progesterone isoforms have pleiotropic reproductive abnormalities including an inability to ovulate, uterine hyperplasia and inflammation, and defects in uterine implantation (Lydon et al., Reference Lydon, DeMayo, Funk, Mani, Hughes, Montgomery, Shyamala, Conneely and O’Malley1995). In fact, STAT3-deficient mice die early in embryogenesis, prior to gastrulation (Takeda et al., Reference Takeda, Noguchi, Shi, Tanaka, Matsumoto, Yoshida, Kishimoto and Akira1997). A significant reduction in the number of viable fetuses on gestational day 18 increased fetal resorptions and disrupted placental morphology and were evident causes of the reduced fertility of mice (Robker et al., Reference Robker, Watson, Robertson, Dunning, McLaughlin and Russell2014). STAT3 activity was detected during early postimplantation development in the mouse, suggesting that STAT3 plays a role during early embryogenesis (Duncan et al. Reference Duncan, Zhong, Wen and Darnell1997). Truchet et al. (Reference Truchet, Chebrout, Djediat, Wietzerbin and Debey2004) reported that STAT1 and STAT3 are expressed in mouse oocytes and preimplantation embryos and concluded that these two genes might have functional importance in early embryonic development because of their roles in the cell cycle and apoptosis. Similarly, ODC1 and STAT3 were detected in all stages of bovine preimplantation embryo development as shown in Fig. 4. In the current study, because of the very small range of genotype variants within bull population, it was not surprising that genotype variants of STAT3 SNPs were not associated with NRR. However, STAT3 SNP43774208 had a significant effect on sperm survival rate after thawing, and STAT3 SNP43758551 was highly associated with sperm motility. Furthermore, analyzed data revealed that STAT3 was significantly associated with PMI and PAS except for STAT3 43774208 and DFI. Accordingly, the STAT3 43758551, genotype ‘AG’ and ‘GG’ had better performance in PMI and a degree of DNA damage compared with genotype ‘AA’, while, genotype ‘AA’ and ‘AG’ were higher in PAS integrity compared with genotype ‘GG’. Similarly, significant association of STAT3 SNP25402 with fertilization rate and SNP19069 with early embryonic survival in cattle (Khatib et al., Reference Khatib, Huang, Mikheil, Schutzkus and Monson2009a) has been revealed. The same research group (Khatib et al., Reference Khatib, Monson, Schutzkus, Kohl, Rosa and Rutledge2008, Reference Khatib, Maltecca, Monson, Schutzkus and Rutledge2009b) showed that the CC genotype of SNP G/C in exon 8 of bovine STAT5A was also associated with higher rates of fertilization and early embryonic survival. Relevant to our approach, STAT5A as a member of STAT family was identified as a candidate gene affecting early embryonic survival as well as bull fertility (Khatib et al., Reference Khatib, Monson, Huang, Khatib, Schutzkus, Khateeb and Parrish2010). A possible role in mitochondrial activity of STAT3 was suggested as the mechanism by which this gene modulated sperm functions and male fertility (Lachance et al., Reference Lachance, Goupil, Leclerc and Stattic2013). From a genome-wide association study, STAT1 and STAT3 were identified as strongly putative candidate genes affecting age at first calving in Nellore cattle (Mota et al., Reference Mota, Guimarães, Fortes, Hayes, Silva, Verardo, Kelly, de Campos, Guimarães, Wenceslau, Penitente-Filho, Garcia and Moore2017). Collectively, from our results and the above-mentioned studies, STAT3 as a member of the STAT family could be considered as a candidate gene for oocyte developmental potential associated with both female and male bovine fertility.
ODC1 was the second candidate gene upregulated in competent oocytes from highly fertile cows at day 12. Localization of ODC1 in rat oocytes suggested its involvement in maintenance of oocyte physiology (Fernandes et al., Reference Fernandes, Jain and Banerjee2017). Additionally, ODC1 was among overexpressed transcripts in developmentally competent bovine (Torner et al., Reference Torner, Ghanem, Ambros, Hölker, Tomek, Phatsara, Alm, Sirard, Kanitz, Schellander and Tesfaye2008) and equine (Mohammadi-Sangcheshmeh et al., Reference Mohammadi-Sangcheshmeh, Held, Ghanem, Rings, Salilew-Wondim, Tesfaye, Sieme, Schellander and Hoelker2011) and buffalo (Sadeesh et al., Reference Sadeesh, Fozia and Meena2017) oocytes of BCB model. However, it was not stably overexpressed in competent oocytes at both days of estrous cycle, but it rather overexpressed at the luteal phase. Stage of estrous cycle and progesterone profile could be more influential than quality of the oocyte, as evidenced by direct inhibition that produced a marked fall in the levels of plasma progesterone at diestrus of mice (Bastida et al., Reference Bastida, Tejada, Cremades and Peñafiel2002). ODC1 was detected as a good oocyte marker in bovine and other species. Frogs oocytes injected with antisense morpholino oligonucleotides that inhibit ODC translation has demonstrated an elevation in ROS in ODC-deficient oocytes and the majority of embryos exhibited clear fragmentation and died shortly afterwards (Zhao et al., Reference Zhao, Chi, Yu, Liu, Su, Ma, Shan and Yang2008). Therefore, ROS suppression is a likely mechanism for ODC in promoting cell survival (Zhao et al., Reference Zhao, Chi, Yu, Liu, Su, Ma, Shan and Yang2008). Mouse embryos that lack ODC developed normally to the blastocyst stage and implanted but died shortly thereafter (Pendeville et al., Reference Pendeville, Carpino, Marine, Takahashi, Muller, Martial and Cleveland2001). In two studies performed in our laboratory, the ODC1 gene was found to be more abundant in biopsies from blastocysts that led to resorption compared with those from calf delivery (El-Sayed et al., Reference El-Sayed, Hoelker, Rings, Salilew, Jennen, Tholen, Sirard, Schellander and Tesfaye2006). In addition, increased expression of ODC1 was also detected in receptive bovine endometrium at day 7 and day 14 of the oestrous cycle (Salilew-Wondim et al., Reference Salilew-Wondim, Hölker, Rings, Ghanem, Ulas-Cinar, Peippo, Tholen, Looft, Schellander and Tesfaye2010). Conversely, the second experiment evidenced that the ODC1 locus was significantly associated with semen quality traits such as volume per ejaculation and sperm concentration. For example, heterozygote ‘AT’ of ODC1 89,914,800 was higher in VOL and CONC compared with homozygote ‘AA’. Additionally, ODC1 89,914,800 sequence variants were highly associated with PMI, PAS and DFI. Homozygote ‘AA’ had higher PMI and less DNA damage. These results are in agreement with previous reports that demonstrated that ODC is essential for spermatogenesis (Coffino, Reference Coffino2000; Ivanov et al., Reference Ivanov, Rohrwasser, Terreros, Gesteland and Atkins2000). Other studies suggested that ODC plays an important role during early spermiogenesis (Alcivar et al., Reference Alcivar, Hake, Mali, Kaipia, Parvinen and Hecht1989; Kaipia et al., Reference Kaipia, Toppari, Mali, Kangasniemi, Alcivar, Hecht and Parvinen1990) and stimulation of DNA synthesis of late spermatogonia (Hakovirta et al., Reference Hakovirta, Keiski, Toppari, Halmekytö, Alhonen, Jänne and Parvinen1993). Therefore, the instability of ODC1 expression in this study and its association with sperm quality traits indicated that further investigations are needed to shed light on the actual role that gene could play in bovine gametes.
Taken together, the findings of the present study have clearly shown that the transcript abundance of STAT3 gene influenced greatly cow fertility and stage of estrous cycle. Therefore, this gene could be a potential molecular marker of oocyte developmental competence. Furthermore, association of STAT3 and ODC1 variants with semen quality indicated that they are also good markers for bull fertility. However, further validation of these data in a large population of bulls is urgently required. Finally, simultaneous selection of superior gametes is a priority for developing a good breeding programme.
Acknowledgements
The authors thank Marc-André Sirard for the provision of bovine cDNA microarray slides. GN was supported by the German Academic Exchange Programme (DAAD).
Financial support
This work was financially supported by the European Commission, within the Sixth Framework Programme, contract no. FOOD-CT-2006-016250.
Conflicts of interest
None.
Ethical standards
The rules and regulations of the German law of animal protection were completely adhered throughout handling and management of experimental animals and in accordance with European Union legislation of animal welfare.


