


Introduction
The ovary is the source of female germ cells (oocytes) and therefore critical for sexual reproduction and propagation of species. The follicle is the functional unit of the ovary and responsible for the production of hormones estradiol (E2) and progesterone (P4), as well as growth of oocytes ready for fertilization. These functions are carried out by the antral follicles, each consisting of a developing oocyte surrounded by granulosa cells (GCs) and a vascularized layer of theca cells (Skinner, Reference Skinner2005; Mora et al., Reference Mora, Fenwick, Castle, Baithun, Ryder, Mobberley, Carzaniga, Franks and Hardy2012; Araújo et al., Reference Araújo, Gastal, Figueiredo and Gastal2014). GCs are the most important cells in contributing to follicle formation. GCs are the only somatic cells that closely interact with the oocyte from the moment of follicular formation until ovulation (Baumgarten and Stocco, Reference Baumgarten, Stocco and Skinner2018).
Much knowledge on ovarian development and its physiological function has been gained using follicles as well as somatic cell cultures, including GCs and theca (Baufeld and Vanselow, Reference Baufeld and Vanselow2018). In this context, primary GC culture has been widely used to understand the molecular aspects of follicle growth as well as differentiation, oocyte development, and ovulation in different species such as sheep (Campbell et al., Reference Campbell, Onions, Kendall, Guo and Scaramuzzi2010), bovine (Doyle et al., Reference Doyle, Walker and Donadeu2010) and rat (Robker and Richards, Reference Robker and Richards1998). Culture of GCs has provided a useful tool to understand the molecular processes underlying ovarian follicle development (Mohammed and Donadeu, Reference Mohammed and Donadeu2018).
During the early stages of growth, GCs in smaller follicles express only the mRNA of receptors for follicle-stimulating hormone (FSH), which is secreted from the anterior pituitary gland and stimulates follicle growth (Matti et al., Reference Matti, Irving-Rodgers, Hatzirodos, Sullivan and Rodgers2010). Therefore, GCs are steroidogenically active as they continue to express FSH receptors (Taru Sharma et al., Reference Taru Sharma, Dubey and Sai Kumar2011). At very late stages in follicular development in follicles >8 mm, GCs also express mRNA receptors for luteinizing hormone (LH), and follicles that have GCs that express these receptors are capable of ovulation in response to LH surge released from the anterior pituitary (Sartori et al., Reference Sartori, Fricke, Ferreira, Ginther and Wiltbank2001; Gougeon, Reference Gougeon2010; Palma et al., Reference Palma, Arganaraz, Barrera, Rodler, Mutto and Sinowatz2012). The proper regulation of genes involved in follicular growth and differentiation is essential. These genes include CYP19A1 encoding cytochrome P450, family 19, subfamily A; FSHR encoding follicle-stimulating hormone receptor; LHCGR encoding luteinizing hormone/choriogonadotropin receptor; and other important genes for GCs function (Park et al., Reference Park, Maizels, Feiger, Alam, Peters, Woodruff, Unterman, Lee, Jameson and Hunzicker-Dunn2005; Law et al., Reference Law, Weck, Kyriss, Nilson and Hunzicker-Dunn2013). FSHR is responsible for growth, proliferation, and differentiation of GCs (Hunzicker-Dunn and Maizels, Reference Hunzicker-Dunn and Maizels2006) and the growth of healthy follicles (Hatzirodos et al., Reference Hatzirodos, Irving-Rodgers, Hummitzsch, Harland, Morris and Rodgers2014). AMH is responsible for GC growth toward the pre-ovulatory follicular stage (Salmon et al., Reference Salmon, Handyside and Joyce2004). Therefore, its serum concentration represents an increased number of growing small follicles in the pre-antral and antral stages (Koskela, Reference Koskela2013; Zahid, Reference Zahid2014).
Caspases play important roles in the process of early apoptosis. Caspase-3 is a critical apoptosis protease downstream of the caspase cascade. Its activity reflects early apoptosis (Wei et al., Reference Wei, Shen, Gong, Deng, Lai and Liang2017). GCs from healthy follicles possess, almost exclusively, the inactive form of caspase-3, whereas GCs from atretic follicles demonstrate increased concentrations of activated caspase-3 (Boone and Tsang, Reference Boone and Tsang1998). Most PLA2s are widely expressed in different tissues, where they are involved in different biological processes such as inflammation, tissue repair, and apoptosis (Fitzpatrick and Soberman, Reference Fitzpatrick and Soberman2001; Fuentes et al., Reference Fuentes, Hernández, Fernández-Avilés, Crespo and Nieto2002). Phospholipase A2 (PLA2) is involved in phospholipid digestion and in the production of prostaglandins (Lappas and Rice, Reference Lappas and Rice2004). Proliferating cell nuclear antigen (PCNA) is an essential regulator of the cell cycle (Bravo and Macdonald-Bravo, Reference Bravo and Macdonald-Bravo1987). PCNA expression has been localized in the ovary in association with the studies of initiation and early events of follicular growth in vivo in rat (Oktay et al., Reference Oktay, Schenken and Nelson1995) and in vitro in cow (Wandji et al., Reference Wandji, Sršeň, Voss, Eppig and Fortune1996) and baboon (Wandji et al., Reference Wandji, Sršeň, Nathanielsz, Eppig and Fortune1997).
Buffalo is an important world-wide species in terms of milk and meat production. It represents an indispensable livestock resource with great economic potential to small holders in Egypt and several developing countries (El-Salam and El-Shibiny, Reference El-Salam and El-Shibiny2011; FAOSTAT, 2015). The intense need for improving the reproductive performance of buffalo presupposes a better understanding of the mechanisms controlling ovarian follicular growth and development. So far, little information is known about regulatory genes that could play a vital role during ovarian follicular development in Egyptian buffaloes. Therefore, our study aimed to: (i) morphologically as well as molecularly characterize cultured GCs from different size follicles; and (ii) select a suitable model according to the follicular size that maintained GC function during in vitro culture. Therefore, we selected some candidate genes. These were differentiation-related genes such as follicle-stimulating hormone receptor (FSHR), cytochrome P450 19 (CYP19), and luteinizing hormone/choriogonadotropin receptor (LHCGR); cell proliferation-related genes such as proliferating cell nuclear antigen (PCNA); proapoptotic marker genes like apoptosis-related cysteine peptidase (CASP3); key mediators in steroidogenesis regulation like anti-Müllerian hormone (AMH); and induced lipid mediators such as phospholipase A2 group III (PLA2G3).
Materials and methods
All chemicals and reagents were purchased from Qiagen (Hilden, Germany), unless otherwise stated in the text.
Collection of ovaries
Ovaries were collected from apparently healthy 156 multiparous buffaloes during the breeding season (September–February) at a Bahtim private abattoir, Al-Qaliobia, Egypt, and then placed in chilled normal saline (0.9% NaCl) containing 50 µg/ml gentamycin. Samples were immediately transported on ice to the laboratory for further processing. Ovaries were washed at least three times in warm saline, and then disinfected once in 70% ethanol and washed again with warm saline.
Classification of follicles
The range of follicular size from 2–20 mm was selected according to Kruip and Dieleman (Reference Kruip and Dieleman1982), with some modifications in that antral ovarian follicles were categorized into four groups. The first group contained cells that were ≤ 4 mm, second group 5–8 mm, third group 9–15 mm and fourth group 16–20 mm in diameter, using a caliper.
Collection of follicular fluid and GCs pellet
Follicular fluid was gently aspirated with an 18-gauge needle attached to a 5 ml sterile syringe. Four syringes were used; one syringe for each category of follicular size. Afterwards, the follicular fluid from each category was poured into 15-ml Falcon tubes perpendicularly on ice for 15 min to give the chance for it to precipitated cumulus–oocyte complexes (COC) and decrease the chance of theca cells contamination. The upper phase of follicular fluids that contained GCs was transferred into new tubes for centrifugation at 750 g for 10 min at 4°C. The clear supernatant was collected for steroid measurement, while GC pellets were divided into two portions: the first portion served as the control fresh pellet and was immediately kept at −80°C, and the second was used for GC culture for 1 week.
Culture of primary GCs
GCs were cultured according to Portela et al. (Reference Portela, Zamberlam and Price2010) with a little modification. In brief, the second portion from the cell pellet was re-suspended in Dulbecco’s Modified Eagle Medium/Nutrient Mixture F-12 medium (DMEM-F12; Biowest, France) supplemented with 10% fetal bovine serum (FBS; Biowest, France), and 10,000 U ml−1 penicillin G, 10 mg ml−1 streptomycin and 25 μg ml−1 amphotericin. Falcon tubes (containing the suspended cells) were centrifuged at low speed (750 g) for 7 min at 4°C, to well wash the pellet. Cells viability was estimated using the trypan blue exclusion method. In brief, we mixed one part of 0.4% trypan blue and one part cell suspension in phosphate-buffered saline (PBS) without Ca2+/Mg2+ (PBS−), and then allowed the mixture to incubate for 3 min at room temperature. A drop of the trypan blue/cell mixture was added to a haemacytometer to count the unstained (viable) and stained (nonviable) cells separately (Strober, Reference Strober2001). The viability of the antral GCs was assessed using trypan blue exclusion and was greater than 95%.
Four groups of cells were seeded in 800 μl DMEM-F12 culture medium, in 24-well culture plates, (Nunc, Roskilde, Denmark). Each plate contained a group at a density of 1 × 10⁵ viable cells/well, and was then incubated at 37°C in a 5% CO2 in air incubator for 1 week, until cells reached confluency. Growing cells were observed daily by microscopic and every 48 h the culture medium was changed (with cell culture supernatant collected for steroid measurement). The behaviour of GCs from all four different sizes of follicle was observed by microscope, daily after seeding, using an Olympus inverted phase-contrast microscope. After cells reached confluency, cells and culture supernatant were collected and kept at −80°C for RNA isolation and steroid measurement, respectively.
RNA isolation and cDNA synthesis
Total RNA was isolated from GCs in fresh pellets (control uncultured cells), and from the four cultured groups using an miRNeasy mini kit (Qiagen, Hilden, Germany). We extracted total RNA according to the manufacturer’s protocol. To remove possible contamination of genomic DNA, the extracted RNA was subjected to on-column DNA digestion, using the RNase-free DNase kit (Qiagen, Hilden, Germany). Isolated total RNA was subsequently stored at −80°C. The concentration of total RNA was determined using a NanoDrop 2000/c spectrophotometer (Thermo Fisher Scientific, Wilmington, USA), and level of degradation was checked using 2% agarose electrophoresis. Samples with clear 28S and 18S ribosomal RNA bands were chosen for gene quantification. cDNA for gene expression analysis was synthesized from the isolated total RNA using the HiSenScript™RH(−) cDNA synthesis kit (Intron Biotechnology, Korea), according to the manufacturer’s protocol. Briefly, 5 μl of each total RNA sample was mixed with 10 μl of 2× reverse transcription (RT) reaction solution, 1 μl of enzyme mix solution with addition DNase-/RNase-free water up to 20 μl and the mixture was run in a thermocycler (Bio-Rad, USA) programmed for 42°C for 60 min, 85°C for 10 min, hold at 4°C, and then stored at −20°C. A specific marker for theca cells, collagen type I A2 (COL1A2), was used to confirm absence of theca cell contamination (Hatzirodos et al., Reference Hatzirodos, Hummitzsch, Irving-Rodgers and Rodgers2015), via amplification of cDNA, using conventional PCR (data not shown).
Quantitative real-time PCR analysis
Gene-specific primers were designed using Primer3 program version 4.0 (http://primer3.ut.ee/) and according to Rozen and Skaletsky (Reference Rozen and Skaletsky2000). Details of primers are described in Table 1. Quantitative real-time PCR of mRNAs was performed on a Stratagene Mx 3000P instrument (Agilent Technologies, USA), using a QuantiTect SYBR Green PCR Kit (Qiagen, Hilden, Germany) and under the following conditions: 95°C for 15 min, 45 cycles at 94°C for 15 s, 60°C for 30 s and 72°C for 30 s. The melting curve was evaluated at the end of the run to observe the specificity of the amplification. Data were analyzed using the comparative threshold cycle (ΔΔCt) method and normalization was performed using the mean of three housekeeping genes GAPDH, β-actin (ACTB) and 18S.
Table 1. List of primers used for qRT-PCR analysis

Measurement of steroid concentration
E2 and P4 concentrations in the cell culture supernatant of different four categories of GCs and their counterparts of follicular fluids were measured using commercial ELISA kits (ChemuxBioScience, South San Francisco, USA), following the manufacturer’s instructions. Optical density value was detected using an ELISA microplate reader (BioTek ELx800, Vermont, USA), at 450 nm wavelength for both E2 and P4.
Statistical analysis
NormFinder was used to select the most stable reference gene for mRNA expression profile (Andersen et al., Reference Andersen, Jensen and Ørntoft2004). Statistical analysis of expression data was performed using an unpaired t-test with Welch’s correction. To determine interactions among groups, one-way analysis of variance (ANOVA) and Tukey’s multiple comparison test were used. The values shown in graphs are presented as the mean ± standard error of the mean (SEM) of at least three independent experiments each done in quadruplicate; P-values ≤ 0.05 were considered statistically significant. GraphPad Prism 5.0 software was used for data plotting (GraphPad Software, Inc., San Diego, CA, USA).
Results
Morphological characterization of primary cultured GCs
Cells cultured in DMEM-F12 supplied with 10% FBS reached confluency within 1 week. Cultured GCs from all categories maintained their viability and morphology, whereas cells formed a monolayer of fibroblastic-like cells at the first three group diameters; ≤ 4 mm, 5–8 mm and 9–15 mm diameter. Cultured GCs from follicles of 16–20 mm diameter revealed a tight clump formation (Fig. 1A–D).

Figure 1. Primary cultured buffalo GCs from different size follicles for 1 week. (A) (≤ 4 mm), (B) (5–8 mm), and (C) (9–15 mm) showed typical monolayer fibroblastic-like cells, while (D) (16–20 mm) revealed aggregated spherical cell-like clumps. Original ×40 magnification.
Molecular pattern of differentiation-related genes (FSHR, CYP19 and LHCGR) in cultured GCs
Expression profiles of FSHR, CYP19, and LHCGR mRNAs were downregulated in all four groups (≤4, 5–8, 9–15 and 16–20 mm) of primary buffalo cultured GCs compared with their counterpart fresh pellet (Fig. 2). This reduction was significant (P < 0.001) for FSHR in all groups (≤4, 5–8, 9–15 and 16–20 mm), (0.001 < P < 0.01) for CYP19 in all groups (≤4, 5–8, 9–15 and 16–20 mm), and (P < 0.001) for LHCGR mRNAs in all groups (5–8, 9–15 and 16–20 mm), except one group (≤4 mm) that was not significantly different.

Figure 2. Quantitative real-time PCR analysis of FSHR, CYP19 and LHCGR genes in buffalo primary cultured granulosa cells from different follicles sizes. Bars are presented as mean ± standard error of the mean (SEM), freshly uncultured pellets (open bars) and primary cultured pellets (solid bars). Data shown are representative of at least three independent replicates. Asterisks represent statistical significance:*P < 0.05; **P < 0.01;***P < 0.001.
Expression pattern of cell proliferation gene (PCNA), and proapoptotic gene (CASP3)
The relative abundance of PCNA and CASP3 mRNAs was significantly (0.001 ≤ P ≤ 0.01) upregulated in 1 week cultured GCs from different size follicles (≤4, 5–8, 9–15 and 16–20 mm), compared with their identical freshly isolated pellets (Fig. 3).
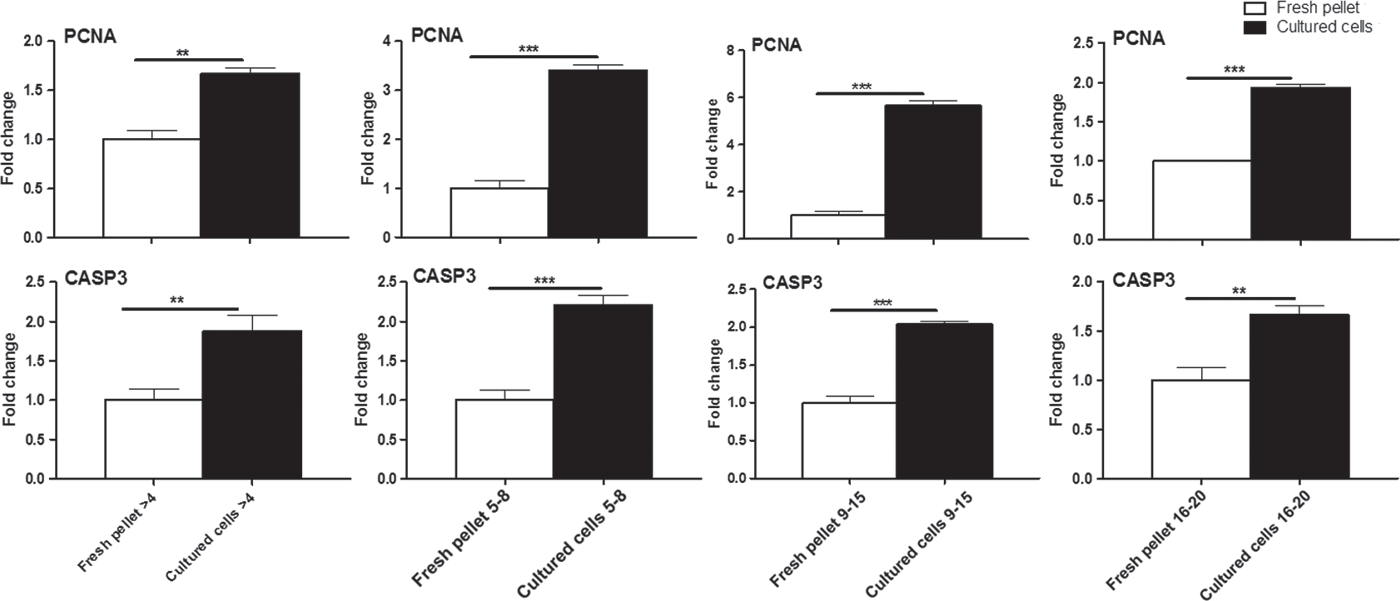
Figure 3. Relative abundance of PCNA and CASP3 mRNAs in buffalo primary cultured granulosa cells from different follicles sizes. Bars are presented as mean ± standard error of the mean (SEM), freshly uncultured pellets (open bars) and primary cultured ones (solid bars). Data shown are representative of at least three independent replicates. Asterisks represent statistical significance: **P < 0.01; ***P < 0.001.
Alterations in the expression of AMH and PLA2G3 mRNAs in primary cultured GCs
The expression profile of AMH mRNA was significantly increased (P < 0.001) in cultured GCs from small follicles (≤4 mm) compared with its freshly isolated pellet. Conversely, the cultured GCs from other three categories of follicular size (5–8, 9–15 and 16–20 mm), revealed a clear reduction (P < 0.001) in AMH mRNA expression in comparison with their freshly isolated pellets (Fig. 4). Interestingly, the relative abundance of PLA2G3 mRNA was significantly (P < 0.001) overexpressed in all cultured GCs from the four different groups (≤4, 5–8, 9–15 and 16–20 mm), compared with their counterpart fresh pellet (Fig. 4).

Figure 4. Expression profile of AMH and PLA2G3 mRNAs in buffalo primary cultured granulosa cells from different follicles sizes. Bars are presented as mean ± standard error of the mean (SEM), freshly uncultured pellets (open bars) and primary cultured ones (solid bars). Data shown are representative of at least three independent replicates. Asterisks represent statistical significance: ***P < 0.001.
Kinetic pattern of steroidal hormones in follicular fluid and cell culture supernatant
E2 concentration in follicular fluid was significantly (P < 0.001) increased with increase in follicular size. However, secreted E2 in the cell culture supernatant was significantly (P < 0.001) decreased during culturing in all groups of cultured GCs (Fig. 5). The P4 level in follicular fluid of freshly isolated GC pellets was significantly higher (P < 0.001) than the secreted P4 in cell culture supernatant from all groups of cultured GCs (Fig. 5). Collectively, the E2 and P4 concentrations in cell culture supernatants decreased with duration of culture.
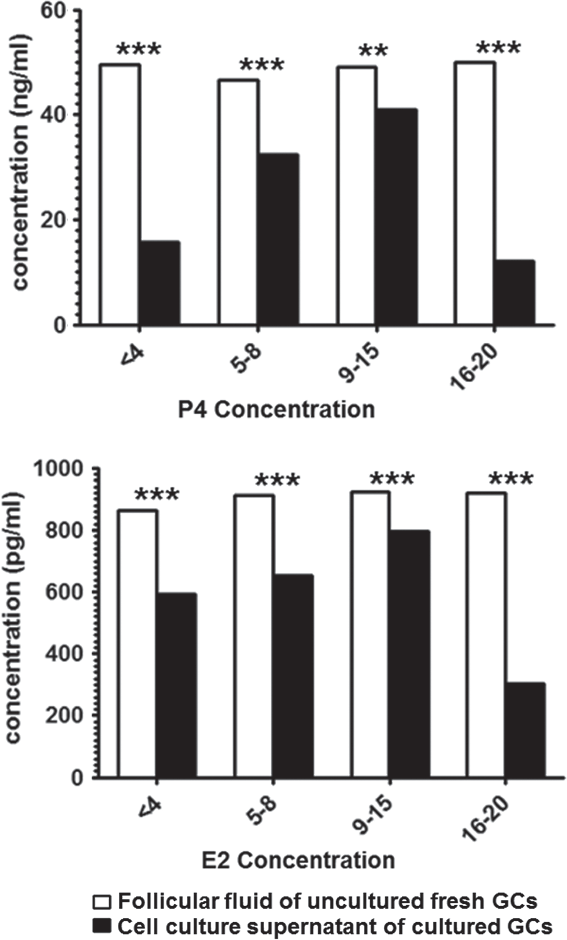
Figure 5. Enzyme-linked immunosorbent assay (ELISA) of P4 and E2 levels in follicular fluid (open bars) and cell culture supernatant of primary cultured granulosa cells in buffaloes (solid bars). Bars are presented as mean ± standard error of the mean (SEM). Asterisks represent statistical significance: **P < 0.01; ***P < 0.001.
There were significant (0.001 ≤ P ≤ 0.01) interactions among all follicle sizes (≤ 4, 5–8, 9–15 and 16–20 mm) in cultured and fresh uncultured GCs, and R squared was 0.95.
Discussion
GCs play a vital role in oocyte maturation and endocrine homeostasis during follicular development (Munakata et al., Reference Munakata, Kawahara-Miki, Shiratsuki, Tasaki, Itami, Shirasuna, Kuwayama and Iwata2016). The current study aimed to: (i) characterize cultured GCs morphological and molecularly in comparison with their in vivo counterparts; and (ii) determine a suitable model that maintained GC function during in vitro culture. Our data showed that basic DMEM-F12 medium supplied with 10% FBS maintained morphological growth as well as viability of cultured GCs. Cultured GCs from these follicle sizes (≤ 4 mm, 5–8 mm and 9–15 mm), grew in monolayers as fibroblastic-like cells. GCs in culture from the follicle size 16–20 mm diameter group grew as tight clumps and had a spherical appearance, which was similar to that of in vivo cells. These findings were in agreement with Gutierrez et al. (Reference Gutierrez, Glazyrin, Robertson, Campbell, Gong, Bramley and Webb1997) and Monga et al. (Reference Monga, Sharma, Datta and Singh2011), and indicated that this culture model maintained the phenotype of GCs and simulated in vivo ones.
The relative abundance of the marker genes in functional GCs (FSHR, CYP19, and LHCGR mRNAs) was reduced compared with their counterparts in fresh pellets. Therefore the culture duration for 1 week was somehow long enough to maintain cells and marker gene expression in a higher fold change (Hatzirodos et al., Reference Hatzirodos, Glister, Hummitzsch, Irving-Rodgers, Knight and Rodgers2017). Furthermore, these data indicated that the cultured GCs did not transform into luteinizing cells, because GCs cultured from all groups still expressed a considerable amount of FSHR and CYP19 mRNAs (Portela et al., Reference Portela, Zamberlam and Price2010; Monga et al., Reference Monga, Sharma, Datta and Singh2011; Yadav et al., Reference Yadav, Agrawal, Pandey, Singh and Onteru2018).
We noticed a fine balance between cell proliferation gene (PCNA), and proapoptotic gene (CASP3) mRNA expression in cultured GCs, this finding demonstrated that the basic DMEM-F12 medium was supplied with 10% FBS, as well as plating density maintained and supported GCs proliferation and death during culture conditions (Portela et al., Reference Portela, Zamberlam and Price2010). It also indicated the ability of cultured cells to continue growth and not undergo atresia (Salvetti et al., Reference Salvetti, Panzani, Gimeno, Neme, Alfaro and Ortega2009).
In mammalian species, AMH is mainly secreted by immature GCs of developing follicles in the ovarian tissues (Bhide and Homburg, Reference Bhide and Homburg2016). It was found that expression of AMH mRNA decreased during the pre-ovulatory stage, which was associated with subsequently reduction in growing follicle response to FSH, to reduce the number of developing follicles (Visser et al., Reference Visser, de Jong, Laven and Themmen2006; Teh et al., Reference Teh, Izzati, Mori, Fuke, Hirai, Kitahara and Yamaguchi2018). Furthermore, AMH played important roles in mammalian ovarian tissues to regulate the response of growing follicles to gonadotrophin during follicular development, as well as decrease the incidence of follicular atresia (Hernandez-Medrano et al., Reference Hernandez-Medrano, Campbell and Webb2012; Seifer and Merhi, Reference Seifer and Merhi2014; Kereilwe and Kadokawa, Reference Kereilwe and Kadokawa2019). The expression profiles of AMH mRNA were changed during culture duration, whereas they were significantly increased in GCs cultured from small follicles (≤4 mm). The opposite pattern was shown in the GCs cultured from other three categories of follicular sizes (5–8, 9–15 and 16–20 mm) compared with their counterpart fresh pellet. This might be because AMH plays a certain role in a small follicle size, as mentioned by Poole et al. (Reference Poole, Ocón-Grove and Johnson2016). In another study, it was mentioned that the long duration of culture resulted in a significant reduction in AMH mRNA expression (Hatzirodos et al., Reference Hatzirodos, Glister, Hummitzsch, Irving-Rodgers, Knight and Rodgers2017). The expression of AMH mRNA in comparison with PCNA mRNA proved that our cultured model maintained the expression of important growth factors such as AMH, a glycoprotein that belongs to the transforming growth factor beta (TGFβ) superfamily. Moreover, PCNA is a nuclear protein that plays a vital role in the regulation of the cell cycle, so it is considered as an essential mediator for granulosa cell proliferation (Sadeu and Smitz, Reference Sadeu and Smitz2008).
To our knowledge, this is the first study to investigate the relative abundance of PLA2G3 mRNA in buffalo primary cultured GCs. We found that PLA2G3 mRNA clearly increased in cultured GCs from four different groups (≤4, 5–8, 9–15 and 16–20 mm), compared with their counterpart fresh pellet; this increase might be necessary for regulation of lipid metabolism and maintaining energy storage during culture (Diouf et al., Reference Diouf, Sayasith, Lefebvre, Silversides, Sirois and Lussier2006; Bertevello et al., Reference Bertevello, Teixeira-Gomes, Seyer, Vitorino Carvalho, Labas, Blache, Banliat, Cordeiro, Duranthon and Papillier2018). The concentrations of E2 and P4 in cell culture supernatant were lower in comparison with their levels in follicular fluid. This could be due to the long culture duration, which might inhibit both E2 and progestagenic pathways. These finding were compatible with qRT-PCR data of FSHR and CYP19 mRNAs that showed a reduction in their expression compared with fresh uncultured GCs pellet (Portela et al., Reference Portela, Zamberlam and Price2010; Monga et al., Reference Monga, Sharma, Datta and Singh2011).
In conclusion, our results revealed that the GCs cultured from small size follicles ≤ 4 mm could be a suitable model for better understanding GC regulation and function in vitro. Further study is required to study the protein profile of the investigated candidate genes and to get more insight into different regulatory mechanism of GCs in Egyptian buffaloes.
Financial support
This study was financially supported by a grant from National Research Centre, Cairo, Egypt, project number 1102101.
Conflicts of interest
The authors declare that there is no conflict of interest that could be perceived as prejudicing the impartiality of the research reported.
Ethical standards
Not applicable as ovaries were obtained from abattoirs.


