

1. Introduction
World Trade Organization (WTO) negotiations generally aim at boosting international trade through liberalization. Recently, however, a new aspect concerning trade facilitation was added. The intuition behind this addition is simple: once formal trade barriers (both tariff and non-tariff) have been substantially reduced, other impediments to trade such as administrative barriers become more apparent and need to be addressed (Njinkeu et al., Reference Njinkeu, Wilson and Fosso2007). Hoekman and Konan (Reference Hoekman and Konan1999) define deep trade integration as explicit government actions aiming to reduce the market segmenting effect of domestic regulatory policies (health and safety regulation, competition laws, licensing and certification regimes, and administrative procedures such as customs clearance) through coordination and cooperation. Thus, trade facilitation could be defined as a process that encompasses various aspects and deals with a wide range of issues that can be summarized in five main points: (i) simplification of trade procedures and documentation; (ii) harmonization of trade practices and rules; (iii) more transparent information and procedures of international flows; (iv) recourse to new technologies promoting international trade; and (iv) more secured means of payment for international commerce (more reliable and quicker). In this paper, administrative barriers are defined as bureaucratic procedures (red tape) related to product shipment from one country to another. It is worth mentioning that this defnition does not include administrative regulations, such as product standards, health, or technical regulations.
Following these two definitions, two main features related to trade facilitation can be derived. First, it is complex as it includes various aspects: infrastructure, logistics, time, etc. Second, trade facilitation aspects vary between developed and developing economies. Table 1 shows that high-income countries perform better than low-income ones in the ‘Logistics Performance Index’, which is 3.7 for the former and 2.3 for the latter. A careful analysis also shows that developed countries have better infrastructure, logistics, and timeliness (3.5, 3.5, and 4 respectively) than developing ones (2, 2.5, and 2.7 respectively).
Table 1. Logistics performance indicators and development level

Note: The LPI index is ranked from 1 to 4. The higher the index, the better the country's performance.
This dataset can be found at (http://info.worldbank.org/etools/tradesurvey/mode1b.asp).
Source: Constructed by the author from ‘Logistics Performance Indicators’, 2007.
From a trade policy point of view, trade facilitation is important for further trade promotion due to two reasons. First, once tariff and non-tariff barriers are reduced, administrative barriers and red tape costs could still impede trade through two main channels (OECD, 2002a). Delays in delivery of imported inputs could actually turn into a severe constraint on production, especially given the increased complexity of commercial regimes (often referred to as a ‘Spaghetti Bowl’) and the increased interdependency of supply chains. At the same time, red tape barriers imply a very high cost to trade, estimated at 2–15% of the value of the traded goods (OECD, 2002b). A number of previous papers have provided evidence about the significance of non-visible barriers. For instance, Cernat (Reference Cernat2001) supports the idea that the solution to the African low trade enigma lies in the lack of trade facilitation. Second, the welfare gain arising from trade facilitation is higher than the one associated with the reduction of classical trade barriers. This is because easing administrative barriers will tend to reduce the waste of real resources, whereas liberalizing more traditional barriers to trade would involve some losses in terms of either rents that were captured by interest groups (quota rents) or foregone tariff revenues for the government (Dennis, 2006). This also explains why a share of the aid for trade has been allocated to trade facilitation, implying reduced transit and clearing time and lower import and export costs, and thereby improving competitiveness and increasing trade and tax revenues in developing countries. Thus, flows from the aid for trade policy and regulations reached in 2011 almost US$1.4 billion. While most of this support goes to trade policy and administration management, the share allocated to trade facilitation has increased by 187% since 2006, and now stands at US$266 million (OECD/WTO, 2011).
The empirical literature on the assessment of trade facilitation in multinational models is sparse. While Ferrantino (Reference Ferrantino2006) simulated the effect of non-tariff barriers on welfare, most of the other work on trade facilitation relied on the GTAP data and model.Footnote 1 Hertel et al. (Reference Hertel, Walmsley and Itakura2001) modified the model in their analysis of the Japan–Singapore free trade agreement by introducing time costs as a technical shift in the Armington import demand function. Similarly, by introducing an import-augmenting technical change, Fox et al. (Reference Fox, Francois and Londoo-Kent2003) simulated the removal of an iceberg tariffFootnote 2 on welfare by applying a positive shock to the technical efficiency of the trade flow. APEC (1999) modeled trade facilitation, through an increase in the productivity of the international transportation sector to capture the downward shift in the supply line of imports resulting from the implementation of cost-reducing measures. Their main result shows that both trade liberalization and facilitation increase real GDP by 0.16% and 0.25% respectively for APEC countries and by 0.1% and 0.15% for the rest of the world. Francois et al. (2003 and 2005) showed that trade facilitation generates one third of the welfare gains, taking into account that such barriers are a ‘pure deadweight loss’, especially for Asia-Pacific developing countries. Finally, Decreux and Fontagné (Reference Decreux and Fontagné2009) introduced an iceberg cost in the MIRAGE model and estimated that trade facilitation would add an annual US$99 billion to world GDP in the long run.
This paper attempts to model trade facilitation in a multi-regional and multi-sectoral computable general equilibrium (CGE) model, MIRAGE. It follows Decreux and Fontagné (Reference Decreux and Fontagné2009) in assuming that administrative barriers are an iceberg cost. I extend their model using more comprehensive measures of AVEs of red tape costs. Therefore, this paper contributes to the empirical literature on trade facilitation in two ways. First, it captures the complexity of the trade facilitation process since the AVEs of administrative barriers are estimated from a gravity model (Zaki, Reference Zaki2009). The AVEs of the time to export and to import also take into account several aspects of trade facilitation: bureaucracy, corruption, internet coverage as a proxy for customs computerization, and the geographical impediments that may increase time to trade. Therefore, they are more comprehensive than other AVEs of time to trade (Hummels, Reference Hummels2001; Minor and Tsigas, Reference Minor and Tsigas2008), and allows a more precise evaluation of the trade facilitation process. This is a quite important contribution since the AVEs have been estimated for non-tariff barriers (Kee et al. Reference Kee, Nicita and Olarreaga2009), for services (Park, Reference Park2002; Walsh, Reference Walsh2006), and for time in transport (Hummels, Reference Hummels2001) but never for non-official barriers. The difference between Hummels' (Reference Hummels2001) AVEs and mine is that the former estimates the ad-valorem impact of ocean and air shipping costs using a discrete choice model. In this paper, I consider a different definition of time required for a trade transaction to fill documents, overcome geographic barriers, and face corruption. This definition can give a better idea about the administrative or the non-official barriers to trade. I have already used these AVEs to assess the impact of trade facilitation on the Egyptian economy where welfare increases by 1.62% when Egypt removes 90% of its red tape costs in a unilateral way (Zaki, Reference Zaki2010). Despite the inclusion of many indicators in our AVEs, other aspects are not taken into account such as regulatory convergence which is excluded from the study.
The second empirical contribution to the literature of this paper is the extension of the methodology of Decreux and Fontagné (Reference Decreux and Fontagné2009) to allow for the explicit introduction of trade facilitation in the multi-regional and multi-sectoral CGE model, MIRAGE. The latter provides a good context to study the impact of trade facilitation for three reasons. First, since trade facilitation has an impact on exports, imports, and therefore production, factors of production and remuneration, a CGE seems to be the appropriate tool to assess the impact of trade facilitation. Second, being a multi-regional model, MIRAGE should determine the largest winners from facilitating trade, especially as there are likely to be several interactions between different countries and that the spectrum of administrative barriers is different between developed and emerging economies. Finally, being a multi-sectoral model, MIRAGE allows taking into account the specificities of various sectors and their response to more facilitated trade.
In order to examine the global impact of trade facilitation, a partial removal of the administrative barriers is simulated by reducing trade costs by 50% for all countries. Moreover, a shock of the same magnitude is introduced for tariff reduction. This should help compare the effects of trade facilitation with those of trade liberalization. It is worth mentioning that the cost of trade facilitaiton was not taken into account since there are no empirical estimates of these costs at the world level.Footnote 3 Therefore, the paper provides estimates of gross gains that could feed into a cost–benefit assessment of individual countries.
The paper has four major findings. Gains derived from trade facilitation are more significant for developing economies (especially for the Middle East and North Africa regions and Sub-Saharan countries) than for developed ones, whether in terms of welfare gain (either in the short or long run) or increase in trade. Second, long-run welfare effects of trade facilitation are much higher than in the short run. Third, trade facilitation helps boost both intra-regional trade and inter-regional trade. Fourth, and most interestingly, it also helps improve export diversification, leading to an expansion in those sectors that are more sensitive to time, such as food, textiles, and electronics.
The remainder of the paper is organized as follows. Section 2 presents the theoretical framework of MIRAGE. Section 3 presents the data. Section 4 discusses the results. Section 5 concludes.
2. Model
As mentioned earlier, this paper models trade facilitation in a multi-regional and multi-sectoral computable general equilibrium (CGE) model, MIRAGE. This section presents the theoretical framework of this model. It first presents the characteristics and main assumptions of the baseline model and then incoroporates trade facilitation aspects.
2.1 Structure and assumptions
MIRAGE is a multi-region and multi-sector CGE model with the following major characteristics.Footnote 4 First, it incorporates imperfect competition in an oligopolistic framework à la Cournot. Footnote 5 Second, product differentiation by variety and by quality, in a sequential dynamic framework, is also incorporated in order to take into account the adjustment period following the removal of administrative barriers to trade. On the one hand, differences in product variety are implemented through the modeling of horizontal product differentiation. On the other, vertical differentiation is captured through two ranges of qualities depending on the origin of production: goods produced in a developing country are assumed to belong to a different quality range than those produced in a developed one. Such differentiation is modeled through a nested Armington–Dixit–Stiglitz utility function in many tiers, as will be shown below.
Supply is assumed to have two levels. At the first level, production in each sector is represented through a Leontief function between intermediate consumption and value added. At the second level, intermediate goods are substitutes through a Constant Elasticity of Substitution (CES) function. The value-added function is also modeled through a CES function of unskilled labor, land, natural resources, and a composite bundle of capital and skilled labor. At the third level, a CES function between capital and skilled labor, taking into account the skill–capital relative complementarity,Footnote 6 is modeled (Figure 1). Installed capital and natural resources are sector-specific, so that their rates of return may vary across sectors and regions. Labour is perfectly mobile within two sets of sectors (agriculture and non-agriculture production) in each country. It is imperfectly mobile between these two sets of sectors and is immobile across countries. In the standard version of the model, labour mobility across the two sets of sectors is represented through the assumption that total labour is a Constant Elasticity of Transformation (CET) bundle of two labour types. Land is imperfectly mobile through a CET.

Figure 1. Structure of the model: production side
As for the demand structure (Figure 2), a representative agent maximizes his utility function through five tiers. The first tier assumes a fixed share of regional income that is allocated to savings, while the rest is used to purchase final consumption goods. The second tier is associated with a Linear Expenditure System–Constant Elasticity of Substitution (LES–CES) function to account for the evolution of the demand structure of each region as its income level changes. The third tier distinguishes between two different quality regions where imports originating from developing countries are considered less substitutable to those from developed ones than to those originating from the same region with an elasticity of substitution σ GEO . Thus, this tier captures vertical differentiation (Fontagné and Freudenberg, Reference Fontagné and Freundenberg1997). At the fourth tier, local and foreign goods are differentiated through the Armington assumption (Armington, Reference Armington1969). Imported goods originating from the same region or another region are modeled through a CES with an elasticity of substitution σ IMP . Finally, the last tier of nested demand models the horizontal differentiation where goods are imperfect substitutes through a CES and an elasticity of substitution σ VAR .Footnote 7 Countries are related to each others through investment flows and external trade.

Figure 2. Structure of the model: demand side
In this model, total demand includes final consumption, intermediate consumption, and capital goods. Sectoral demand of these three components follows the same pattern as final consumption in terms of the demand structure and the functional form. It is noteworthy that the regional representative agent includes the government, so it pays and earns taxes. This is why any decrease in tax revenues (for example as a consequence of a trade liberalization) is compensated by a non-distorting replacement tax.
The dynamics of the model are driven by total factor productivity assumptions, accumulation of capital under a putty–clay framework, and by projections of population taken from the United Nations statistics. The model's dynamics are exclusively of a sequential nature: the equilibrium can be solved successively for each period. The time span is chosen to be 16 years (betweem 2004 and 2020). The closure of the model is based on the following assumptions. First, the share of current account in GDP is considered to be exogenous, suggesting that the real effective exchange rate adjusts in order to harmonize the change in exports, imports, and FDI. Second, savings rates are fixed and the world GDP deflator is the numéraire.Footnote 8 Finally, production factors are assumed to be fully employed and internationally immobile.
2.2 Incorporating trade facilitation
To take into account trade facilitation in a multinational CGE model, I adopt the methodology developed by Decreux and Fontagné (Reference Decreux and Fontagné2009). They model the cost associated with administrative barriers as an iceberg cost (Samuelson, Reference Samuelson1954) since it is one of the most tractable ways of modeling transport costs and it does not have an impact on other markets.Footnote 9 For the sake of simplicity, the equations presented are related to trade facilitation. Appendix 1 presents the mathematical statement of the model (see supplementary material).
The ad-valorem equivalents (AVEs) are introduced in the prices and transport sector equations. The free on board (FOB) price PFOB i,r,s,t of product i exported by region r to region s in year t depends on the iceberg cost tcost i,r,s,t , producer price PY i,r,s,t , perceived elasticity of demand EP i,r,s,t Footnote 10 (where the elasiticity is a positive value) and some taxes (production tax rate txp i,r,s,t , export tax rate texp i,r,s,t , and export tax equivalent to Multi-Fibre Agreement quotas txamf i,r,s,t )
 $$\eqalign{PFOB_{i,r,s,t} = \, & (1 + tcost_{i,r,s,t} )PY_{i,r,s,t} \left( {1 - \displaystyle{1 \over {EP_{i,r,s,t}}}} \right) \cr & \times(1 + txp_{i,r,s,t} )(1 + texp_{i,r,s,t} + txamf_{i,r,s,t} )} $$
The cost insurance and freight (CIF) price PCIF i,r,s,t is modeled by taking the sum of the FOB price and the same transport cost in the following way
 $$PCIF_{i,r,s,t} = PFOB_{i,r,s,t} + (1 + tcost_{i,r,s,t} )\mu _{i,r,s} PTr_{i,r,s,t} $$
where μ i,r,s,t is the demand of transport per unit of traded volume and PTr i,r,s,t is the price of transport.
The demand for transport Tr i,r,s,t takes into account the iceberg cost added to the trade flow Trade i,r,s,t
 $$Tr_{i,r,s,t} = \mu _{i,r,s} (1 + tcost_{i,r,s,t} )Trade_{i,r,s,t} $$
This means that the tcost i,r,s,t parameter is introduced as a deadweight loss, because the demand for transport services increases by a percentage equal to the administrative barriers AVEs, while the volume of transport services actually received is equal to μ i,r,s Tradei,r,s,t . It is worthwhile to note that this specification relies upon the following implicit assumption: resources that are wasted because of the administrative barriers are consumed according to transport sector technologies; and the specific input consumption structure depends on the regions where the associated transport services are produced. Furthermore, the regions from which the wasted resources are taken are those where the associated transport services are produced. In fact, this amounts to lowering the productivities of the transport sectors in all regions. Although there may be other ways to model the administrative barriers, I opt for this way for the sake of simplicity. In addition, introducing explicitly the AVEs in the model helps capture in a more direct way the effect of trade facilitation on the world economy. Those AVEs are computed by taking the average of the AVE of time to export and time to import that have been estimated at both sectoral and country levels in Zaki (Reference Zaki2009) as it will be shown later.
3 Data
3.1 CGE data
This study uses the GTAP 7 (Badri and Walmsley, Reference Badri and Walmsley2008) database that has a 2004 reference year and includes 57 sectors and 113 regions. This dataset is compiled from several sources. Macroeconomic data are from the World Bank, and international trade are from COMTRADE. Tariffs are obtained from MacMAP'sFootnote 11 constructed by the CEPII based on raw data from the International Trade Center (UNCTAD-WTO, Geneva). The business as usual (BAU) scenario is run to take into account the changes that took place in the world economy between 2004 and 2008. Afterwards, World Bank and International Monetary Fund projections have been used to simulate the evolution in the economy without any shock in order to generate the reference scenario.
The GTAP dataset (see Appendices 2 and 3 of the supplementary material) has been aggregated to the MIRAGE level of regions and sectors where 19 regions and 21 sectors are taken into account. Regional and sectoral aggregation are shown in Tables A.3 and A.4 in Appendix 4 of the supplementary material. This aggregation allows taking into account developing regions, which have a poor performance in aspects of trade facilitation so that the benefits of liberalization can be assessed.
3.2 Estimating tariff equivalents for administrative barriers
In order to better assess the impact of trade facilitation, tariff equivalents for administrative barriers to trade should be calculated. This section presents the methodology adopted to estimate the tcost parameter of equations (1)–(3). To this end, I follow the methodology adopted by Kee et al. (Reference Kee, Nicita and Olarreaga2009) who estimate the ad-valorem tariff equivalent for non-tariff barriers based on a gravity model. In the same vein, I rely on a gravity model to estimate the impact of trade facilitation on bilateral trade in a two-step procedure (Zaki, Reference Zaki2009). First, the time to export and time to import are regressed on their determinants which are the number of documents to export and to import (Doc exp.j and Docimp,i ), the internet coverage (Internet j and Interneti ), corruption (Cor j and Cori ),Footnote 12 geographic variables (being landlocked Land j and Landi or an island Isld j and Isldi ), and the number of procedures to start a business (Proc j and Proci ) to capture the institutional environment. A dummy variable Tar ij is added to determine whether there is any tariff barrier between two countries or not (see equations (4) and (5))
 $$\eqalign{ {\rm Ln}(Time_{exp.j} ) =\,& \beta _0 + \beta _1 \ln(Doc_{exp,j} ) + \beta _2 \ln(Internet_j ) \cr & + \beta _{3{\rm}} \ln(Proc_j ) + \beta _4 \ln(Cor_j ) + \beta _5 Land_j + \beta _6 Isld_j + \omega _{\,j{\rm}}} $$
 $$\eqalign{ {\rm Ln}(Time_{imp.i} ) = \,& \gamma _0 + \gamma _1 \ln (Doc_{imp.i} )\gamma _2 + \ln (Internet_i ) + \gamma _3 \ln (\Pr oc_i ) \cr &+ \gamma _4 \ln (Cor_i ) + \gamma _5 Land_i + \gamma _6 Isld_i + \gamma _7 Tar_{ij} + \varepsilon _j} $$
In a second step, the predicted values of the time to export and time to import – obtained from the first step – are introduced in the gravity model. This two-step estimation procedure only takes into account that part of the transaction time that is explained by trade facilitation aspects. The gravity outcome is used to compute ADVs for these two variables. Following Head and Mayer (Reference Head and Mayer2002), the estimable equation (6) is
 $$\eqalign{ \ln\left( {\displaystyle{{m_{ijk}} \over {m_{iik}}}} \right) = &\ln\left( {\displaystyle{{\nu _{\,jk}} \over {\nu _{ik}}}} \right) - \sigma \ln\left( {\displaystyle{{\,p_{\,jk}} \over {\,p_{ik}}}} \right) + \delta (1 - \sigma )\ln\left( {\displaystyle{{d_{ij}} \over {d_{ii}}}} \right) + (1 - \sigma )\ln(1 + t_{ijk} ) \cr & + (\sigma - 1)\lambda L_{ij} - (\sigma - 1)(\theta - \eta )PTA_{ij} + (\sigma - 1)[\rho _1 Col_{ij} \cr & + \rho _2 Comcol_{ij} + \rho _3 Conti_{ij} ] + (1 - \sigma )\mu _1 \mathop {\ln(\widehat{Time}_{imp,i} )}\limits \cr &+\, (1 - \sigma )\mu _2 \mathop {\ln(\widehat{Time}_{exp,j} )}\limits + \, \beta + \varepsilon _{ij}} $$
where (m ijk /miik ) are bilateral imports of product k by country i from country j relative to internal flows of product k, (v jk /vik ) is relative production of product k in countries i and j, (p jk /pik ) is the relative price of product k, (d ij /dii ) is bilateral distance between the countries i and j (d ij ) relative to internal distance (d ii ), (t ijk ) is the bilateral tariff of product k between i and j. Dummies capture whether the two countries share a common language (L ij ), or a commom border (Conti ij ), whether one country was a colony of the other at some point in time (Col ij ), whether the two have been colonized by the same third country (Comcol ij ), the presence of a Preferential Trade Agreement (PTA ij ) between i and j (equals 1 if i and j belong to the same PTA), and β is a the constant and ε ij the error term.Footnote 13 The results of the gravity models are presented in Tables 2 and 3.Footnote 14
Table 2. First step: estimating time to export and to import

Notes: (i) Robust standard errors in parentheses.
(ii) Ordinary least squares method has been used with clustered standard errors (by exporter in column 1 and by importer in column 2).
(iii) ***, **, and * represent respectively statistical significance at the 1%, 5%, and 10% levels.
(iv) Corruption is measured by the corruption perception index ranked from 0 (most corrupted) to 10 (least corrupted).
Table 3. Second step: impact of trade facilitation on bilateral trade

Notes: (i) Robust standard errors in parentheses.
(ii) Ordinary least squares method has been used with clustered standard errors (by country pairs). Results remain robust even when errors are clustered by exporter and by importer.
(iii) ***, **, and * represent respectively statistical significance at the 1%, 5%, and 10% levels.
As Kee et al. (Reference Kee, Nicita and Olarreaga2009) argue, to make trade facilitation aspects comparable with ADVs, the quantity impact of such barriers should be transformed into price equivalents. Therefore, the gravity equation is differentiated with respect to Time Exp. (Time Imp.) to get the AVE of time to export (time to import) as shown in equation (7)
 $$\displaystyle{{d\ln \left( {\displaystyle{{m_{ij,k} } \over {m_{ii,k} }}} \right)} \over {d\ln (\widehat{Time}_{i,k} )}} = \displaystyle{{d\ln\left( {\displaystyle{{m_{ij,k} } \over {m_{ii,k} }}} \right)} \over {d\ln(\,p_{i,k}^d )}}.\displaystyle{{d\ln(\,p_{i,k}^d )} \over {d\ln (\widehat{Time}_{i,k} )}} = \varepsilon _{i,k} .ave_{i,k}^{Time} $$
where ε i,n is the import demand elasticity of good k in country i and p i,k d the domestic price in country i. Hence, solving for ave i,k Time , I get
 $$ave_{i,k}^{Time} = \displaystyle{1 \over {\varepsilon _{i,k}}}. \displaystyle{{d\ln\left( {\displaystyle{{m_{ij,k}} \over {m_{ii,k}}}} \right)} \over {d\mathop {\ln(\widehat{Time}_{i,k} )}\limits\}} $$
In other words, the AVEs are computed by taking the ratio between the coefficient of the predicted time to export (and that to import) and the elasticity of demand as follows
 $$ave_{imp,i,k}^{Time} = \displaystyle{{(\sigma - 1)\mu _1} \over {\varepsilon _{i,k}}} ;\quad ave_{exp,j,k}^{Time} = \displaystyle{{(\sigma - 1)\mu _2} \over {\varepsilon _{\,j,k}}} $$
Equation (9) gives the ad-valorem equivalent of one day to export and one day to import. Demand elasticities come from Kee et al. (Reference Kee, Nicita and Olarreaga2008).Footnote 15 To estimate the AVE specific to each country, the AVE of one day is multiplied by the number of days to export and to import available in the ‘Doing Business’ dataset. Since those tariff equivalents take into account other administrative barriers such as the number of documents, the internet coverage, and corruption, as well as the geographic impediments to trade, they are considered to be a more comprehensive AVE of ‘trade facilitation’. I have calculated the AVEs at the ISIC 3-digits level for 138 countries,Footnote 16 but they have been aggregated to the MIRAGE level of regions and sectors where 19 regions and 21 sectors are taken into account. Those AVEs are computed by taking the average of the AVE of time to export and time to import that have been estimated using the gravity model presented above.Footnote 17
The heterogeneity in terms of trade facilitation among different sectors and countries is confirmed by the estimated AVEs. The calculated AVEs displayed in Table 4 show that the difference between developed and developing countries is very pronounced since the average of the AVE of the time to export (to import) is 4.9% (7.9%) for the former (chiefly the USA and European countries) and 17.6% (34.2%) for the latter (including African and Asian countries), pointing out that developing economies would benefit the most from the elimination of such barriers.
Table 4. Estimating ad valorem equivalents for time of trade: by countries

Notes: (i) Time to export and that to import are recorded in days.
(ii) AVEs are in percentage.
Source: Constructed by the author from the regressions results.
A deeper look at the sectoral characteristics of the AVEs (Table 5)Footnote 18 suggests that the least time-sensitive products appear on the lower bound of the AVEs values. Thus, perishable goods (food and beverages), seasonal goods (garments and textiles), goods that are used as inputs in the production process (machines), and high value added products (professional and scientific equipments) are characterized by higher AVEs than others (wood products or footwear). Regarding the time to export, the lowest values of the AVEs (almost 0%) are the ones associated with tobacco, footwear, and wood products for Japan, USA, and Canada. Chad, Kazakhstan, Kirghizistan, and Rwanda have the highest AVEs for chemicals, transport, and electrical machines and are considered to be quite time-sensitive and to have a short market lifetime with an average AVE equivalent to 112%. As for the time to import, AVE figures are higher than those for the time to export since Chad and Rwanda have an AVE equal to 200% for textiles, garments, and non-ferrous metals. These figures are high due to the higher number of days to export and to import.
Table 5. Estimating ad valorem equivalents for time of trade: by sectors
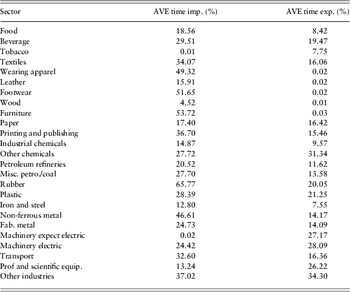
Notes: (i) AVEs are in percentage.
(ii) Since the AVE have been estimated at the sector-country level, I calculated sectoral figures by taking a simple average of the countries included in the sample for each sector.
Source: Constructed by the author from the regressions results.
Figure 3 shows a comparison of the level of administrative trade barriers and formal tariff barriers. It is worth mentioning that the administrative barriers are greater than tariff barriers for both developed and developing countries. For instance, while tariffs in the Middle East (LAC) region amount, on average, to 5.6% (7.4%), red tape barriers reach 31% (14.7%). This is the reason why removing administrative barriers to trade is likely to have a more positive impact on the world economy. This finding is in line with the literature since red tape amounts to an estimated deadweight cost to trade of at least US$650 billion worldwide every year. Estimates of the costs of red tape associated with international trade range from a tenth to a quarter of the total value of world trade. If this cost could be halved, even at the lower end of that range, this could save traders, governments, and consumers around the world an estimated US$325 billion per year (OECD, 2005).

Figure 3. Red tape barriers vs. tariffs (%)
4 Simulation results
Bearing in mind the importance and the complexity of the trade facilitation process, it is important to assess its effects on the world economy to determine which countries gain most from it. In order to examine the global impact of trade facilitation, a first simulation captures the effects of a partial removal of the administrative barriers, which is proxied by reducing trade costs by 50% for all countries. Morevoer, in order to compare the effects of trade facilitation with those of trade liberalization, a second simulation introduces a shock that halves tariff rates. The analysis focuses on the impact of trade facilitation measures on welfare, trade, and exports diversification. I also distinguish between the effects in the short run, which captures the immediate static change implied by each simulation, and the long run, which captures the change in 2020. The dynamics of the model are made by introducing updated equations for all the stock variables (capital stock and labor force) as well as various policy variables and then solving the model period by period with the updated variables.
The main findings show that gains derived from trade facilitation are more significant for developing economies (especially for the Middle East and North Africa regions and Sub-Saharan countries) than for developed ones, whether in terms of welfare gain (either in the short or long run) or an increase in trade. Second, long-run welfare effects of trade facilitation are much higher than in the short run. Third, trade facilitation helps boost both intra-regional and inter-regional trade. Fourth, and most interestingly, it also helps improve export diversification, leading to an expansion in those sectors that are more sensitive to time, such as food, textiles, and electronics.
4.1 Effects on welfare
First, trade facilitation yields welfare gainsFootnote 19 due to an improvement in the terms of trade, as displayed in Table 6. This finding is generalized for the whole world, especially for some developing countries such as sub-saharan Africa (4.7%), other Asia (5.2%), Middle East (3.1%), and North Africa (2.9%) where welfare gains derived from trade facilitation are larger than elsewhere. The only exception to this improvement in the developed world is Japan due to a significant deterioration of its terms of trade and a trivial improvement in its capital accumulation.
Table 6. Trade facilitation impact on welfare and trade (percentage change with respect to the BAU)

Notes: (i) Short run means the immediate static change implied by each simulation, the long run means the change implied in 2020.
(ii) Columns 1, 2, and 3 show the welfare decomposition in the short run. Therefore, 1+2+3=Column 4.
(iii) Columns 5, 6, and 7 show the welfare decomposition in the long run. Therefore, 5+6+7=Column 8.
(iv) Column 12 shows the change in exports diversification with respect to benchmark scenario. Exports diversification is measured by the ‘1-Herfindahl–Hirschman Index’ (HHI=∑ i si 2, where s is the share of product i exports in total exports). Positive variation shows more diversification and negative variations shows less diversification.
Source: Author's calculations using MIRAGE.
In the short run, welfare derived from trade facilation rises by 1.4% in the European Union (EU) whereas the increase amounts to only 0.3% in the case of USA. This difference is explained by the fact that the USA is considered to be the best practice in the sample, which means that trade facilitation will not generate important gains in this case since it has the lowest administrative costs. In contrast, as the EU includes various countries that have different status in trade facilitation aspects (going from the most efficient being Germany to the least efficient such as Greece and Eastern European countries), benefits are relatively considerable.
In general, terms of trade gains significantly improve for most economies because of the reduction in transaction costs as cumbersome and lengthy administrative barriers to trade are eased. Most importantly, such barriers do not generate any revenues (such as tariffs) or rents (such as quotas) and therefore are not associated with significant foregone revenues. Trade facilitation thus changes trade prices with imported goods becoming cheaper in aggregate relative to exported goods.
The results of the second simulation (see Table A.5 in Appendix 6 of the supplementary material) reproducing the effects of a reduction in tariffs by 50% show that trade liberalization yields lower gains for all countries, compared to trade facilitation. In fact, while on average welfare is boosted by 1.8% with trade facilitation, it improves only by some 0.1% when trade is liberalized. This is primarily explained by a lower reduction in trade prices in the former case since tariffs are lower than administrative costs (see Figure 3). For instance, if trade is liberalized by 50%, FOB prices decrease on average, by 0.5%, whereas the same reduction in FOB prices can be obtained when trade facilitation is facilitated by only 10%.Footnote 20
The short-run effects are amplified in the long run as the literature of CGE models has repeatedly shown that static models underestimate the effects of policy changes since they do not take into account capital accumulation and productivity gains. As shown in Table 6, in the long run welfare gains derived from trade facilitation are amplified as a result of higher capital accumulation, as this process enhances the efficiency of capital and labor by moving resources into sectors where they are more valuable at the margin. On average, capital accumulation explains around 50% of the welfare gains in the long run. In Asian countries in particular, capital accumulation and other gains yield large positive welfare gains (8%). Some developing economies, especially Brazil (0.4%), are not greatly affected by trade facilitation in the long run because they already enjoy a relatively efficient environment of goods’ clearance and delivery.
Moreover, the welfare effects of trade liberalization are much lower than those of trade facilitation even in the long run, since, on average, the latter increases welfare by 2.8%, whereas the former increases it only by 0.3%. Last but not least, while welfare gains emerging from trade liberalization are explained by a more efficient allocation of resources, those arising from trade facilitation are primarily the result of a reduction in deadweight loss: changes in terms of trade are far more important as a source of welfare gain in trade facilitation than trade liberalization.
4.2 Effects on trade: level and diversification
Trade facilitation matters more than trade liberalization for developing countries in terms of the effect on trade level.
On the one hand, Table 6 shows that Sub-Saharan African, Asian, Latin American Countries (LACs), and the Middle East exports increase by 22.3%, 16.2%, 16.2%, and 13.8%, respectively following trade facilitation measures. Imports are boosted by almost the same magnitude since the macroeconomic closure of the model evokes a constant share of current account to GDP: ceteris paribus, an increase in exports should be coupled with an increase in imports. While exports and imports of most of the developed countries increase modestly (the USA exports increase only by 3.9%, Japan by 2.1%, and Canada by 5%), those of the EU increase more substantially (by 10.6%) since this bloc includes some countries where trade facilitation (admin costs?) is quite basic (Bulgaria, Poland, and Czech Republic).Footnote 21 As mentioned earlier, the removal of administrative barriers to trade in developing countries leads to an improvement in terms of trade as shown in Table 6 (column 11), in particular the Middle East by 2.3%, North Africa by 3.9%, and Sub-Saharan Africa by 2.3%.
Similar to our findings above with respect to welfare gain, the effects of trade liberalization on trade levels are less considerable than those associated with trade facilitation (see Table A.5 in Appendix 6 of the supplementary material). In fact, apart from a few exceptions (India, Japan, and Brazil that are characterized by a fairly high protection), both exports and imports are less responsive to tariff liberalization than trade facilitation measures.
Trade facilitation effects are not the same at both intra- and inter-regional levels, especially in developing countries.. First, the removal of red tape costs substantially increases intra-regional trade in Asia by 19.5%, in North Africa by 22.1%, in LAC by 33.5%, in the Middle East by 45.1%, and in Sub Saharan African by 77.2%. Given that administrative costs are much higher in developing countries, trade facilitation could potentially be more effective in increasing South–South trade.Footnote 22
Moreover, it is shown that trade facilitation increases inter-regional trade. In fact, the EU increases imports from the Middle East by 14.8%, Sub-Saharan Africa by 28.6%, and North Africa by 13.6%. Even with the rest of Europe and Turkey, intra-European trade is boosted by 12.4%. The USA also imports more, not only from South Africa, the Middle East, and Asian countries but also from Mexico (up by 10.2%), showing that behind-the-border procedures do matter even for well-integrated countries. This is similar to what Fox et al. (Reference Fox, Francois and Londoo-Kent2003) found when assessing the impact of the reduction in border-crossing costs between Mexico and USA using the GTAP model. Finally, Japan's imports significantly increase from Asian countries (by 11.1%), Sub-Saharan ones (by 10.5%), and India (by 5.1%) at the expense of other countries (such as Brazil, North Africa, and LACs).
Moving to a detailed analysis of the trade facilitation effects provides more interesting insights. In fact, it is observed that, ceteris paribus, once trade is facilitated, each region increases its trade in some sectors more than others since it will produce more of the goods that are sensitive to trade facilitation reforms. At the production level, while Australia and New Zealand increase their production of agricultural products – where they have a comparative advantage – by 2%, the Middle East and North Africa increase that of garments and textiles by 23.9% and 20% respectively. The production of electronics is highly boosted in Asian countries (up by 45.4%). Last but not least, LACs experience an increase of textiles and vegetables by 6.2% and 5.9% respectively.Footnote 23
Another interesting finding shown in Table 7 is that developing countries witness a remarkable diversification of exportsFootnote 24 after implementing trade facilitation measures. The majority of gains are reaped by Sub-Saharan Africa where exports increase by 138.7% in electronics, 185.4% in machinery, 321% in metallic products, and 151.8% in textiles and garments. Benefits are lower for other regions. For instance, in the Middle East, exports of textiles and garments, electronics, and chemicals increase by 58%, 43.5%, and 40.3% respectively. The same changes are observed in North Africa but in a more pronouced way (chemicals by 64%, textile and garments by 69.9%, and electronics by 44.5%). LACs gains are distributed among the following sectors: vegetables (23.3%), chemicals (31.2%), textiles (48.1%), metal products (57.6%), and electronics (62.7%). Finally, Asian countries increase their exports of electronics, metallic products, and vegetables. The literature on trade facilitation (OECD, 2002b and 2005) has already provided evidence that seasonal (garments) and perishable (vegetables) products as well as those with a short market lifetime (electronics) are more affected than others. Figure 4 displays the Herfindahl–Hirschman index that measures the change in exports concentration before and after the simulation. It is obvious that the rest of Africa, Middle East, North Africa, and Latin American countries expericence a significant diversification following trade facilitation. Dennis and Ben Shepherd (Reference Dennis and Shepherd2011) argued that lower fixed costs of exports (such as the barriers associated to trade facilitation) expand the range of products that developing countries can export. Fixed costs are perceived as the primary determinants of firm entry into particular overseas product markets. For this reason, they found that a 10% improvement in trade facilitation is associated with product diversity gains of the order of 3–4%. Moreover, there is evidence that differentiated goods (such as manufactures) have stronger diversification responses to trade facilitation (measured as a uniform proportionate cut in administration costs) than do homogeneous goods (such as agricultural products).

Figure 4. Change in exports diversification (%)
4.3 Effects on employment and factors compensation
It is worthwhile to mention that the model runs under neoclassical closure, so that resources are fully employed and the supply of the factors of production is exogenous. Trade facilitation affects sectoral employment and factors compensations in different ways.
As trade facilitation leads to an expansion in the manufacturing sector in developing countries, industrial (and services) employment also increases in Sub-Saharan Africa (by 2.7%), in the Middle East and North Africa (by 0.4%). In contrast, Australia and New-Zealand, Brazil, India, and South Africa experience an increase in the agricultural employment due to the expansion of primary goods that become more competitive once trade is facilitated.
As a result of trade facilitation, sectoral production and thus employment change, and so is factors compensation. Table 8 presents the changes in the returns to capital,Footnote 25 land, natural resources, and skilled and unskilled labor in different regions. Skilled labor's wages are positively affected by trade facilitation, showing that the increase in the skill premium is primarily driven by skilled-biased technological change after the period of trade liberalization or facilitation, especially in developing countries. The channel is as follows: the more an industry opens-up, the more firms are productive and are able to export and face foreign competition. Firms in this industry will therefore hire more skilled workers at higher wages. The increase in the demand for skilled labor is also attributed to the way it is modeled in MIRAGE. Since the latter is characterized by a CES bundle of capital and skilled labor, this structure takes into account the skill–capital relative complementarity. Therefore, the higher the capital accumulation, the higher the demand for skilled labor.This result is consistent with the literature (for instance, Feenstra and Hanson, Reference Feenstra and Hanson2001, Attanasio et al., Reference Attanasio, Goldberg and Pavcnik2004).Footnote 26 In addition, as many sectors that are intensive in unskilled labor expand (and where developing countries have a comparative advantage), the demand for this type of labor is boosted and therefore its wage rate. Developed countries experience a modest change in factors returns since the shock effect is rather weak. Land returns increase primarily in countries where agriculture expands especially in Australia and New-Zealand, Brazil, South Africa, and USA. Finally, the return to capital decreases almost everywhere except in Sub-Saharan African countries and the Rest of Asia where it increases moderately. While growth in the supply of labor remains unchanged, the relative abundance of capital increases and therefore its rental rate falls relatively to the wage rate. Here, it is important to mention that this model has savings-driven determination of investment. In other words, the investment volume adjusts to achieve the savings–investment equilibrium. Since installed capital is sector-specific and assumed to be immobile, this putty–clay hypothesis is important, because it implies that capital stock adjustment is gradual. In addition, it implies that the rate of return to capital may vary across sectors. This confers investment an important role, as the only adjustment device for capital stock. For this reason, capital over-expands in the long run relative to other factors of production.
Table 7. Long-run change in value of exports by region and by sector percentage change with respect to the BAU)

Note: The long run means the change implied in 2020.
Source: Author's calculations using MIRAGE.
Table 8. Long-run change in real returns to factors of production (percentage change with respect to the BAU)

Note: The long run means the change implied in 2020.
Source: Author's calculations using MIRAGE.
5. Conclusion
This paper attempts to model trade facilitation in a multi-regional and multi-sectoral computable general equilibrium (CGE) model, MIRAGE. It follows Decreux and Fontagné (Reference Decreux and Fontagné2009) in modeling trade facilitation and in assuming that administrative barriers are an iceberg cost. I extend their model using more comprehensive measures of ad-valorem equivalents (AVEs) of red tape costs, which are computed from a gravity model, and are introduced in the CGE model. The novelty in using those AVEs is that they take into account the effects of bureaucracy, internet coverage, corruption, and geographical barriers on the time to trade. Two simulations are carried-out, one captures the effects of a partial removal of the administrative barriers, which is proxied by reducing trade cost by 50% for all countries. Morevoer, in order to compare the effects of trade facilitation with those of trade liberalization, a second simulation introduces a shock of the same proportion for tariffs.
The paper has four major findings. Gains derived from trade facilitation are more significant for developing economies (especially for the Middle East and North Africa region and Sub-Saharan countries) than for developed ones, whether in terms of welfare gain (either in the short or long run) or increase in trade. Second, long-run welfare effects of trade facilitation are much higher than in the short run. Third, trade facilitation helps boost both intra-regional trade and inter-regional trade. Fourth, and most interestingly, it also helps improve export diversification, leading to an expansion in those sectors that are more sensitive to time such as food, textiles, and electronics. It is important to mention that the cost of trade facilitation has not been taken into account since there are no empirical estimates of these costs at the world level. Therefore, the paper provides estimates of gross gains that could feed into a cost–benefit assessment of individual countries.
Going forward, two potential areas can be identified to improve trade facilitation modeling. First, it will be more appropriate to take into account the different costs of implementing the trade facilitation measures. In addition, it would be more suitable to consider the corruption aspects, as I have done in Zaki (Reference Zaki2010), which can reduce the gains coming from trade facilitation since the latter is not a pure deadweight loss.
From a policymaking perspective, this paper points to some important implications for current WTO negotiations. First, agreement on trade facilitation could be easily reached and put some flesh onto the bones of the Doha Development negotiations. This is because the trade facilitation process is beneficial for all concerned parties and it also involves no concessions as in the case of agriculture or sensitive products. Second, trade facilitation will not only boost trade, but it will increase the economic efficiency of different countries because infrastructure, customs, and the business environment are enhanced. This is why trade facilitation reforms could be promoted as a tool that contributes to growth and development rather than as a concession paid to others. Third, trade facilitation is crucial for developing countries who would be amongst the primary losers if reforms should be undertaken only by developed ones. As was mentioned before, a country will benefit from its own trade facilitation before benefiting from the others. This is due to the fact that all the reform measures put in place to facilitate trade (i.e. improving transport infrastructure and communication) promote the efficiency and the productivity of the whole economy. Last but not least, a remaining challenge is that trade facilitation requires large financing, technical assistance, and capacity building to be implemented. The majority of studies, including this one, did not consider the cost of implementing trade facilitation measures. This may overestimate the gains emerging from eliminating administrative barriers. In addition, the disagreement between developed and developing countries on this cost is still raised on the Doha Development Agenda and complicates its conclusion. Thus, it is crucial to simultaneously assess both the gains and the costs induced by trade facilitation. From a policymaking point of view, this problem can be resolved via two mechanisms: first, aid for trade and an increase in the government revenues could fund new projects. The increase in government revenues may be explained by the fact that efficiency in the collection of revenues as well as customs effectiveness will improve once trade is facilitated.
Supplementary material
To view supplementary material for this article, please visit http://dx.doi.org/10.1017/S1474745613000256.


