


The Inland Northwest mountain region of the United States, including northeastern Oregon, consists of over 58 million hectares of which approximately 45% are forested (Graham et al. Reference Graham, Jain and Cannon2005; Hann et al. Reference Hann, Jones, Karl, Hessburg, Keane, Long, Menakis, McNicoll, Leonard, Gravenmier and Smith1997). Sites within the Interior Columbia Basin are dominated by a variety of conifer species, including pines, Douglas-fir [Pseudotsuga menziesii (Mirb.) Franco], true firs, western larch (Larix occidentalis Nutt.), and spruce, depending upon elevation, moisture conditions, and soils (Hann et al. Reference Hann, Jones, Karl, Hessburg, Keane, Long, Menakis, McNicoll, Leonard, Gravenmier and Smith1997). Pines, Douglas-fir, and western larch are the preferred commercial tree species (Graham et al. Reference Graham, Jain and Cannon2005) within the area, and these species are the most frequently planted in this area.
The region is characterized by a warm, dry summer climate (Emmingham et al. Reference Emmingham, Oester, Fitzgerald, Filip and Edge2005; Ferguson Reference Ferguson1999), which complicates forest plantation establishment. Limited and seasonally variable soil water holding capacity, combined with low atmospheric humidity during the growing season, lead to high probability of depleting soil water by transpiration, making vegetative competition on these dry sites potentially detrimental to seedling survival and growth (Emmingham et al. Reference Emmingham, Oester, Fitzgerald, Filip and Edge2005). Conservation of soil moisture is often critical for plantation success (Newton Reference Newton1973; Newton and Preest Reference Newton and Preest1988). Reducing overall transpiration from competing vegetative cover can extend the net growing season length as well as shift available site resources to establishing seedlings (Oliver Reference Oliver1990; Wagner et al. Reference Wagner, Little, Richardson and McNabb2006). This is especially important in the first few years of plantation establishment, when seedling roots share much of the same soil profile as competing vegetation (Newton Reference Newton1973). Effective vegetation management is one method to alleviate growth and mortality losses and increase wood fiber yield over a specific rotation period (Wagner et al. Reference Wagner, Little, Richardson and McNabb2006; Walstad and Kuch Reference Walstad and Kuch1987).
Weed control has therefore become a standard practice to reduce competition throughout commercial timber production regions (Thompson and Pitt Reference Thompson and Pitt2003; Wagner et al. Reference Wagner, Little, Richardson and McNabb2006). Although there are numerous methods available to forest managers, herbicides can be effective and economical tools to manage vegetation (Thompson and Pitt Reference Thompson and Pitt2003; Wagner et al. Reference Wagner, Little, Richardson and McNabb2006). The effects of competition control on Douglas-fir plantations have been well studied over most of the Pacific Northwest (Newton and Preest Reference Newton and Preest1988; Rose and Ketchum Reference Rose and Ketchum2002; Rose et al. Reference Rose, Rosner and Ketchum2006; Rosner and Rose Reference Rosner and Rose2006), and reduction of competition has been shown to increase the duration of the growing season for Douglas-fir (Dinger and Rose Reference Dinger and Rose2009; Harrington and Tappeiner Reference Harrington and Tappeiner1991) in western and southwestern Oregon. Information is limited for the northeastern region of Oregon and for western larch seedlings, another important commercial tree species in that region.
Suppression of transpiring vegetative cover without injuring conifer seedlings enhances their survival (Hobbs et al. Reference Hobbs, Tesch, Owston, Stewart, Tappeiner and Wells1992; Wagner et al. Reference Wagner, Little, Richardson and McNabb2006; Walstad and Kuch Reference Walstad and Kuch1987). Herbicide efficacy varies based on both conifer tolerance and susceptibility of the competing species present; it is therefore important to have region- and site-specific information based on a variety of herbicides, along with knowledge of conifer sensitivity. Forest sites can be highly variable in terms of species composition. Broad spectrum herbicides, such as imazapyr, triclopyr, and glyphosate, are frequently used for site preparation (treatments applied before planting) (Kelpsas and Landgren Reference Kelpsas and Landgren2016; Thompson and Pitt Reference Thompson and Pitt2003), especially as summer applications. Other herbicides, such as sulfometuron, are commonly applied for preemergent vegetation control, usually in spring, but sometimes in fall. Herbicide mixtures and different times of application are often used to increase treatment efficacy on sites with a high diversity of competing species. Our objectives were 1) to examine the selective efficacy of a variety of site preparation herbicide applications in reducing cover of grasses, forbs, and shrubs on sites in northeastern Oregon and 2) to determine if reductions in vegetative cover were correlated with greater late summer soil moisture.
Materials and Methods
Study Sites
We selected three recently cutover sites (Table 1) that were scheduled for operational reforestation near Elgin, Oregon for this study. Prior harvest and fire history was unknown, but stands had originated from natural regeneration. Average annual maximum and minimum temperatures from 1948 to 2005 for Elgin (elevation 810 m) were 16.7 C and 0.7 C, respectively. Average annual total snowfall was 113.5 cm, and average annual precipitation was 59.9 cm, with 25% of that falling between May and September in the form of thunderstorms of moderate intensity. Precipitation tends to be localized and increases with elevation. For the study years of 2007 to 2014, on-site estimates based on PRISM (PRISM Climate Group 2017) showed an average maximum temperature of 14.2 C, average minimum temperature of 1.6 C, and average annual precipitation of 65.3 cm.
Table 1 Site information for Northeast Oregon vegetation management study.

Three soil series occurred at these sites (Dyksterhuis and High Reference Dyksterhuis and High1985). Soils on most of the study area were of the Tolo silt loam series, a typic Vitrandept, deep, well drained, and formed from volcanic ash and loess deposited over loess and basalt. The Klicker-Anatone Complex and Kamela series only occurred in small areas at Upper Sam. The Klicker stony silt loam series is an Ultic Argixeroll, moderately deep and well drained; the Anatone series is a Lithic Haploxeroll, shallow and well-drained. The Kamela is a Dystric Xerochept, moderately deep and well drained. All Klicker, Anatone, and Kamela series were formed from colluvium and residuum derived dominantly from basalt with some loess and volcanic ash in the surface layer. Soil depth varied across all units, with some areas having less than 23 cm soil depth because of rocks. Surface rocks occurred on all sites. Plant associations found at the sites included Douglas-fir–snowberry (Pseudotsuga menziesii/Symphoricarpos albus (L.) Blake) and grand fir [Abies grandis (Douglas ex. D. Don) Lindl.]–white spirea (Spiraea betulifolia Pall.) (Johnson and Clausnitzer Reference Johnson and Clausnitzer1991).
All sites were harvested by clear-felling of merchantable timber when there was approximately 30 cm of snow on the ground (Table 1). This timber harvesting had little influence on plant cover. Residual trees that would impact the study were subsequently felled in spring 2007.
Study Design
The experimental design is a generalized randomized block design. There were three replications within each of the three sites. Sites were considered blocks, but the replication within each site allowed for the study to be analyzed as a completely randomized design for each site if the block by treatment interaction proved to be significant. Aside from the inherent differences in species composition from site to site, the Hooker site had been logged a year earlier than the other sites, and there was concern that this might impact treatment efficacy. Therefore, the study was designed to allow for sites to be analyzed separately.
Plot size was 7.3 m wide and 19.8 m long (144.5 m2), with a minimum buffer of 2 m between plots. Because of the limited information about herbicide efficacy in the area, a variety of treatments and two timings were selected to screen potential treatments. Treatment selection was based on known species sensitivity (Kelpsas and Landgren Reference Kelpsas and Landgren2016).
Twenty-two treatment combinations (one per plot) were randomly assigned to three plots (replicates) within each site, for a total of 66 plots per site. Nine treatments were applied in spring 2007, eight herbicide treatments and one set of nontreated plots. Eight herbicide treatments were applied in summer 2007; four herbicide treatments were applied in spring 2008, with a shared set of nontreated plots for the summer 2007 and spring 2008 plots. The four treatments in spring 2008 duplicated some of the spring 2007 treatments (Table 2).
Table 2 Herbicide treatment list, with treatment numbers for Northeast Oregon vegetation management study. Treatments 9 and 18 were nontreated controls.

Herbicide applications were made with the “waving wand” technique using a pressurized backpack sprayer with a single adjustable Chapin™ nozzle releasing a conical spray with roughly 300 μm median drop size (Newton et al. Reference Newton, Cole and Barry2009). Plots were sprayed in a single pass (on the long axis), 37 L ha−1 spray volume with water as the carrier. Prior to application, the pressurized sprayer was calibrated to determine the spray volume per second, and required spray time per plot was calculated. All herbicide treatments were applied by the same, experienced applicator, working with an observer who timed the application. If an obstacle occurred in a plot, spraying was temporarily stopped until the applicator could be repositioned and spraying continued. Total spray time for each plot was recorded to the nearest tenth of a second. Deposits were noted on plot boundaries to provide evidence of plot area covered. Any abnormalities observed in spray pattern were noted, and those areas were not included in future sampling. When vegetation was later evaluated, we confirmed whether spray patterns had left undersprayed patches within boundaries, and also whether spraying outside boundaries had left visible effects suggesting the potential for slightly reduced deposition within plots. Treatments were applied March 28 and 29, 2007; July 23 and 24, 2007; and May 13, 2008. The difference in timing for the spring applications was due to much earlier snowmelt in 2007 than in 2008.
Plots receiving the eight herbicide treatments applied in spring 2007 and one set of nontreated plots were planted April 13, 2007, with Douglas-fir 2+1 bareroot (grown in nursery beds for 2 years then 1 year in transplant beds) and larch plug 415D (Styro 10) and larch bareroot (plug +1) (container grown for 1 year then 1 year in transplant beds) seedlings after herbicide application. Plots treated in summer 2007 and spring 2008, as well as another set of nontreated plots, were planted with the same stock types May 22, 2008, after application. At each planting time, seedlings were planted in three rows of twelve seedlings, with one row per stock type. The stock type for each row was randomly assigned.
Measurements
Vegetation
In late June/early July 2007 and 2008, cover was visually estimated for each plot within six 1-m radius circles (subplots, 13% of plot area) systematically located with a random starting position within each 144.5 m2 plot. Live cover of grasses, Carex species, small forbs, tall forbs, natural conifers, and shrubs (by species) was visually estimated. Tall forbs included species that were at least 50 cm in height and tended to not desiccate by the end of the growing season. All species present within each subplot were recorded. Across the sites, there were at least 106 forb species, 13 grass species, 22 shrub species, and 3 hardwood species. Because hardwood tree sprouts remained less than 5 m tall throughout the study period, they were included as shrub cover. In summer 2009, cover on subplots was estimated again as before; species information was only collected for grasses, tall forbs, and shrubs. Plant cover was estimated in mid to late September 2014 (7 or 8 years after application) to evaluate whether residual competition had persisted, but cover was assessed at the plot level rather than the subplot level. For each plot, percent cover was estimated visually for grass, tall forbs, small forbs, tall shrubs, small shrubs, western brackenfern [Pteridium aquilinum (L.) Kuhn], Carex species, natural conifers, planted conifers, bare ground, and slash. Less species information was collected in 2009 and 2014 as a result of budget constraints. First-year tree seedling survival and growth and vegetative cover were reported in detail in Lindsay (Reference Lindsay2011).
The study was originally scheduled to be completed in 2009. In mid-August 2012, herbicide release treatments (release treatments are vegetation management treatments that happen after regeneration is present) were applied at Hooker and Upper Sam. At Hooker, application was a broadcast helicopter application of hexazinone at 2.3 kg ha−1. Application at Upper Sam was a broadcast ground application of atrazine (2.3 kg ha−1), glyphosate (1.65 kg ae ha−1), and imazapyr (0.22 kg ae ha−1), with care taken to avoid spraying seedlings. All plots were treated at both sites.
Soil Moisture
Throughout the growing seasons in 2007 and 2008, gravimetric soil moisture samples were collected on planted plots, with at least three samples collected from each plot, approximately every 3 weeks. Samples were collected using Kane tube samplers and augers and oven dried in the lab at 103 C for at least 24 h to determine net gravimetric soil moisture (Gardner Reference Gardner1986). Soil bulk density was determined by collecting and drying five representative samples to 46-cm depth at each site in June 2007. Bulk density samples were collected with a hammer-driven core sampler of 7.6-cm diam and 7.6-cm length, so that bulk density samples were calculated for each soil moisture sampling depth. In 2007, all planted plots were sampled at two depths: 0 to 23 cm and 23 to 46 cm. Throughout the 2008 field season, all plots were sampled for soil moisture to 23 cm. Samples in the 23- to 46-cm depth were collected from a stratified random sample of plots with low total cover and medium and high forb and shrub cover. Volumetric water content (θ) was calculated from the bulk density and gravimetric soil moisture measurements:
 $$\theta \,{\equals}\,m_{W} {\asterisk}\left( {\rho _{b} /\rho _{W} } \right),$$
where mW represents gravimetric soil moisture, ρb represents bulk density, and ρW represents the density of water (1.0 g cm−3).
Analyses
All analyses were performed using SAS® software versions 9.3 and 9.4 (SAS Institute, Inc. Cary, NC). Vegetation data were analyzed by life-form groups (percent grass, total forb, shrub, and total nonconifer cover) rather than by individual species. The large number of species coupled with sporadic distribution precluded analyses based on individual species. Vegetation data were analyzed in two ways, analysis of variance and analysis of covariance, using the GLIMMIX or MIXED procedure in SAS®.
For the full analysis, data were included from all 22 treatments. ANOVAs were run individually for years 1, 2, 3 (2007 planting only), and 7/8 postspraying. Contrasts were developed to determine if vegetative cover in the spring 2007 herbicide treatments differed from cover in the nontreated control, and if cover in the spring 2007 and spring 2008 treatments differed from each other. Comparisons among means using Tukey’s adjusted probabilities were also made.
Because we had year 0 (pretreatment) vegetation data for summer 2007 and spring 2008 treatments that preceded the 2008 planting, we also ran analyses for those treatments (2008 plantings) with year 0 data as a covariate. The inclusion of the covariate helps deal with the variability that occurs when vegetation differs from plot to plot at the time of treatment. For years 1, 2, and 7 of the 2008 planting analyses, contrasts were developed and comparisons among means were made to determine if vegetative cover in the herbicide treatments differed significantly from the nontreated controls.
Prior to the analyses, data were tested to see if block (site) by treatment interactions occurred, in other words, if vegetation responses to treatment varied from site to site. Responses to treatment were found to be present with total nonconifer cover years 1 and 2, forb cover years 1 and 2, and shrub cover years 1 and 7/8. Whenever these interactions were significant, the sites were analyzed separately as completely randomized designs, and treatment comparisons were made within rather than among sites. Least-squared treatment means by site are listed in tables whenever the interactions were significant. When the block by treatment interactions were not significant, data are presented as treatment least-squared means in figures.
Preliminary analyses included examination of results to determine if variability in spray time for each plot accounted for some of the variability in vegetation response. Vegetation response versus expected dosage based on spray times was graphed, and correlations were calculated for the imazapyr treatments which included the same two rates across all application times. No patterns were detected.
Plots of residuals and predicted values indicated heteroscedascity, and several methods were utilized to address the problems. When possible, PROC GLIMMIX and the Poisson distribution were used for data. For some years, difficulty with convergence occurred when using the GLIMMIX procedure, so the square root transformation and PROC MIXED were used. Means reported as least-squared means have been back transformed from the ANOVAs. Treatments were considered significantly different from each other at P<0.05.
For soil moisture, depletion curves were plotted for each treatment and trends examined. PROC MIXED was utilized to compare cover variables with soil moisture for each period and depth and for total depletion. Akaike’s information criteria, r2 values, and plots of residuals versus predicted values were used to determine fit.
Results and Discussion
Vegetation
Treatment efficacy varied by site and by season/year of application. At least 11 of the 20 tested herbicide applications on each site were associated with decreased total vegetative cover in the first summer after application (Table 3). Prior to treatment, the Hooker site had the most forb cover, Upper Sam had the most grass cover, and Lower Sam had the most shrub cover. Because multiple methods of comparing means were used, there were some differences in significance of vegetative cover in herbicide treatments and nontreated plots. In a few instances, there were treatments that differed in significance between the full analysis and the 2008 planting analysis with initial cover covariates. Results will therefore be reported with consideration for both analyses and all comparisons. Sustained differences in vegetative cover among treatments 7 or 8 years after application would be indicative of lack of reinvasion of certain competing species or life-form groups after application rather than continued direct effects of the herbicides.
Table 3 Percent total nonconifer cover for the first two summers after herbicide application. Year 1 evaluations (late June/early July) were approximately 3, 11, and 1.5 months after application for spring 2007, summer 2007, and spring 2008 applications, respectively.

a An asterisk (*) indicates a significant difference from the respective nontreated control at α=0.05.
b Nontreated controls planted in spring 2007 for comparison to spring 2007 treatments.
c Nontreated controls planted in spring 2008 for comparison to summer 2007 and spring 2008 treatments.
Site differences in treatment efficacy for total nonconifer cover were found for the first 2 years after application, with all sites having some treatments with vegetative cover that was significantly different from that of the nontreated plots in both years (Table 3). For the 2007 plantings, total cover in year 3 did not vary among the treatments (Figure 1). By years 7/8 (Figures 1 and 2), total cover was significantly less (48%) in treated than it was in the nontreated plots (63%) only following the hexazinone spring 2007 treatment. The lower nonconifer cover in this treatment was likely due to the expansion of the planted seedling crowns shading out cover rather than a maintained direct effect of the treatment, especially on sites with lower shrub cover.
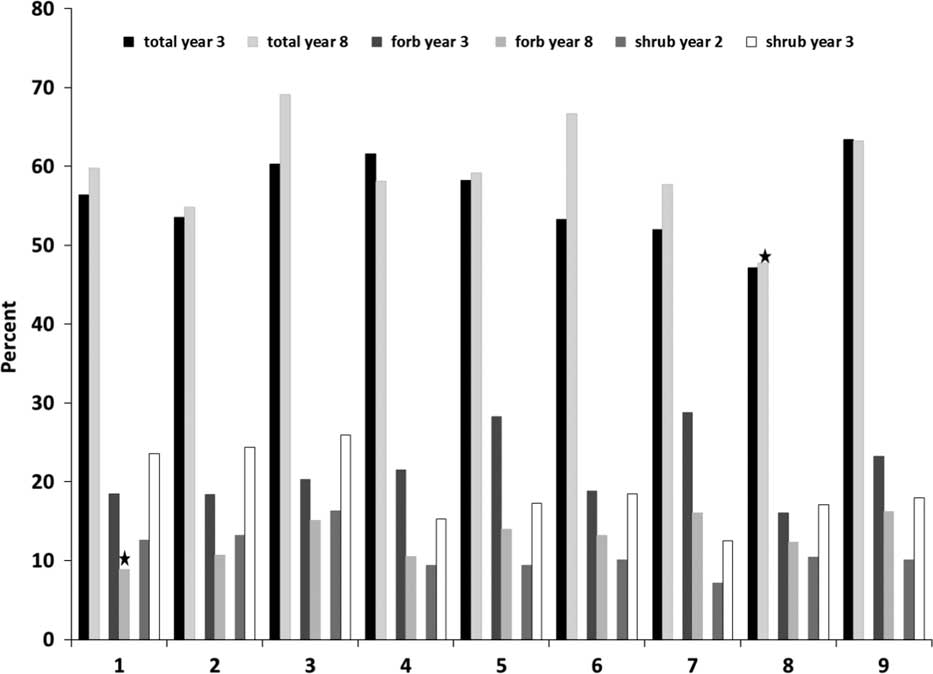
Figure 1 Least-squared means (all sites combined) total nonconifer (total) year 3, total nonconifer year 8, forb year 3, forb year 8, shrub year 2, and shrub year 3 cover. Stars denote difference from nontreated plots (9) at α=0.05. Spring 2007 treatments were applied March 28 and 29. Cover estimates were made in late June/early July for years 2 and 3 and in September for year 8. Refer to Table 2 for treatment numbers.
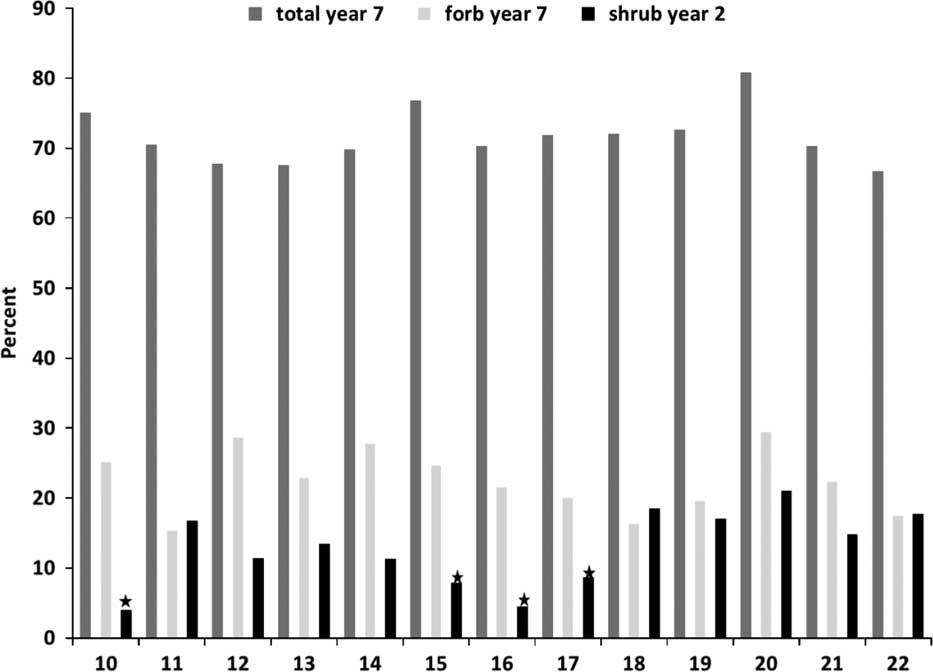
Figure 2 Least-squared means (all sites combined) for total nonconifer (total) and forb cover year 7 and shrub cover year 2 for summer 2007 (herbicides applied July 23–24) and spring 2008 (herbicides applied May 13) treatments. Cover estimates made in late June/early July for year 2 and in September for year 7. Stars denote difference from nontreated plot (18) covers at α=0.05. Refer to Table 2 for treatment numbers.
Selectivity of the herbicide treatments on the different categories of vegetation—grasses, shrubs, and forbs—resulted in some differences in treatment efficacy. With grass, vegetative cover responded similarly across the sites for all years (Figure 3). All of the spring 2007 and three out of four spring 2008 herbicide treatments resulted in significantly lower grass cover than that of the nontreated control in the first year. For the summer treatments, the most effective at reducing grass cover differed among the sites, with the glyphosate plus sulfometuron, glyphosate plus imazapyr, and glyphosate plus atrazine or glyphosate plus imazapyr treatments being the most effective at Hooker, Lower Sam, and Upper Sam, respectively, but the differences were slight enough that the block (site) by treatment interaction was not significant when comparing all treatments.
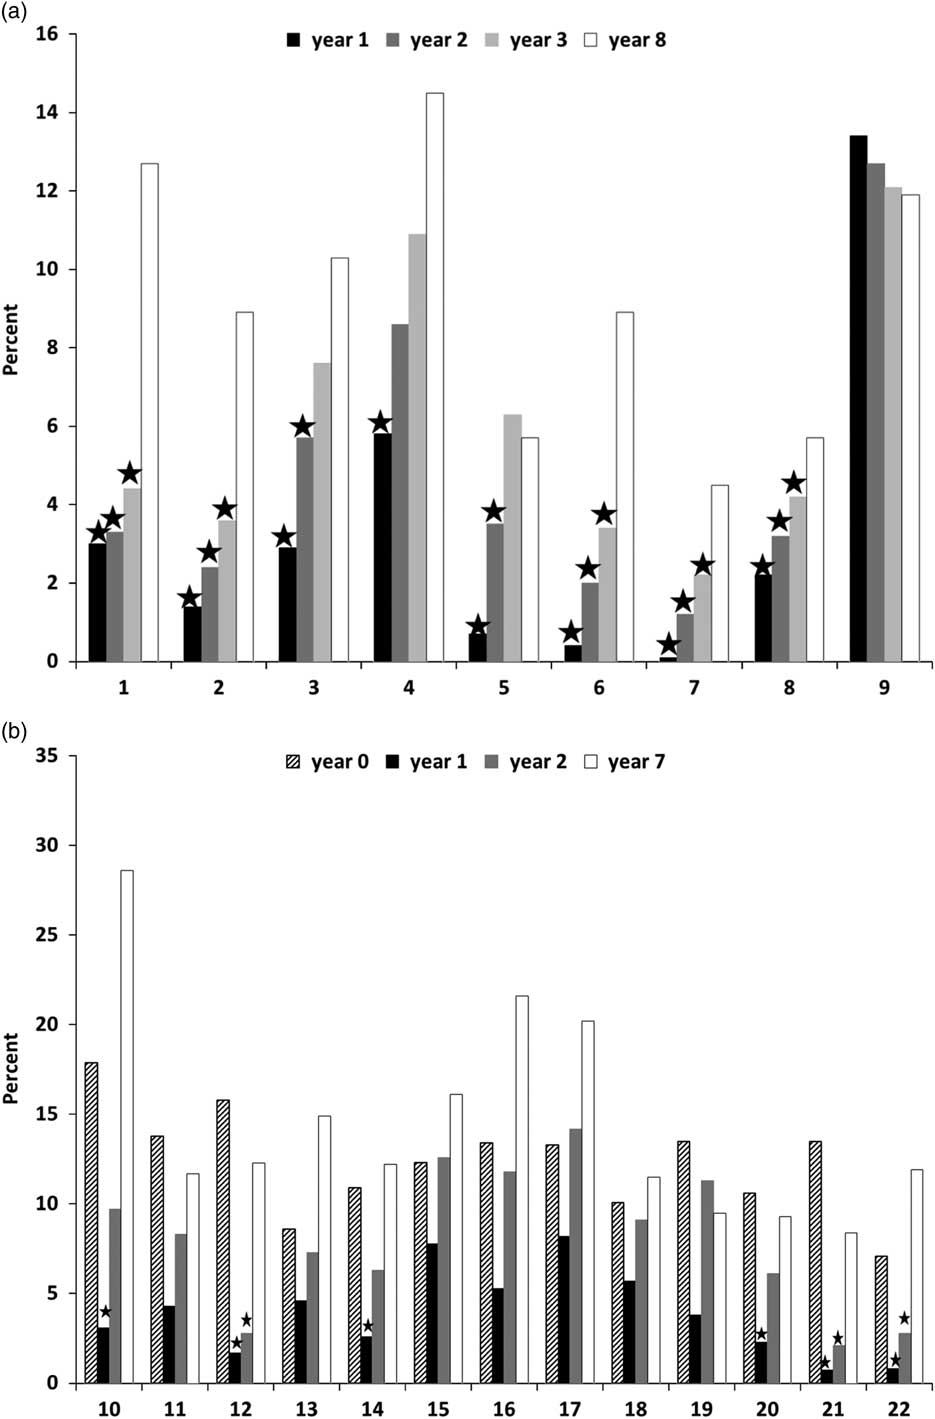
Figure 3 Least-squared means (all sites combined) for grass cover for all years for (a) spring 2007 (herbicides applied March 28–29) treatments and (b) summer 2007 (herbicides applied July 23–24) and spring 2008 (herbicides applied May 13) treatments. Cover estimates made in late June/early July for years 1, 2, and 3 and in September for years 7/8. Stars denote significance (α=0.05) from respective nontreated plots, 9 for spring 2007 and 18 for summer 2007 and spring 2008. Refer to Table 2 for treatment numbers.
The Hooker site had the greatest number of treatments with significant decreases in forb cover for year 1 (Table 4). By year 3, however, vegetative cover in herbicide treatments was not significantly different from cover in nontreated plots (Figure 1). Although statistics indicated that spring sulfometuron (treatment 1) retained significantly less forb cover than did the nontreated control for year 8, the difference was minor: 9% for treatment 1 vs. 16% for the nontreated control (Figure 1). Sulfometuron, imazapyr at the higher rate (0.42 kg ha−1), and hexazinone resulted in 3% to 12% cover of forbs in the first year when applied in spring. Although there were several summer treatments at Hooker and Lower Sam that significantly reduced forb cover for the first year, only the aminopyralid plus sulfometuron treatment reduced forb cover significantly at Upper Sam. This may be related to the species present or the relative abundance of forbs across the different sites. By the second year, differences among vegetative cover in most treatments were small even when significant. Such short-term forb responses have been shown by others (Blake et al. Reference Blake, Hurst and Terry1987; Freedman et al. Reference Freedman, Morash and MacKinnon1993; Sullivan et al. Reference Sullivan, Wagner, Pitt, Lautenschlager and Chen1998); in most studies, grasses and forbs return to pretreatment levels in less than 5 years. In regions with warmer and moister climates, revegetation by herbaceous species can occur within 1 to 2 years after spraying (Zutter et al. Reference Zutter, Glover and Gjerstad1986).
Table 4 Percent cover of all forbs for the first two summers after herbicide application. Year 1 evaluations (late June/early July) were approximately 3, 11, and 1.5 months after application for spring 2007, summer 2007, and spring 2008 applications, respectively.

a An asterisk (*) indicates a significant difference from the respective nontreated control at α=0.05.
b Nontreated controls planted in spring 2007 for comparison to spring 2007 treatments.
c Nontreated controls planted in spring 2008 for comparison to summer 2007 and spring 2008 treatments.
At Lower Sam, there were several treatments that had greater forb cover in year 2 than did the nontreated plots (Table 4), demonstrating that selectivity within the weed community may result in a change in composition rather than decreased cover. This was in part the result of an increase in tall forbs. Across all sites, tall forbs were sparse (<3%) the first year after treatment and 3% in nontreated plots. By the second or third year, some treatments with good control initially led to the most abundant tall forbs 2 or more years later (>10%), resulting in greater tall forb cover than that in nontreated plots (3% to 4%). About half of the tall forb species were exotic, so the increase of tall forbs may be of concern in some plantations if not treated effectively.
As with forb cover, effective treatments varied by site for year 1 shrub cover (Table 5). Following spring 2007 treatments, there were no differences from the nontreated (Figure 1) in years 2 and 3, but several summer 2007 treatments (glyphosate plus imazapyr, imazapyr at both rates, and glyphosate) continued to show differences in shrub cover in year 2 (Figure 2). Shrub cover in years 7 or 8 was significantly higher (7% to 21%) in some herbicide treatments (glyphosate and imazapyr at 0.42 kg ha−1, spring 2008) at Upper Sam than it was in nontreated plots (0.6%) (Table 5). Initial shrub cover was 2% in the nontreated plots, while it was 12% to 14% in those herbicide treatments. Upper Sam received a release spray in 2012, 2 years before the last evaluation. Some of the species on the nontreated plots were different from those on treated plots and may have responded differently to the release treatment, and this may have compromised the results. Imazapyr at either rate, spring or summer 2007, or at a lower rate with glyphosate in summer, provided the best control of shrubs, of which snowberry was the dominant species. The low imazapyr treatment was not effective spring 2008, perhaps because of the influence of later snow melt and colder soils resulting in less root growth and uptake of herbicide following treatment.
Table 5 Percent shrub cover for the first and seventh or eighth summers after herbicide application. Year 1 evaluations (late June/early July) were approximately 3, 11, and 1.5 months after application for spring 2007, summer 2007, and spring 2008 applications, respectively. Year 7/8 evaluations were made in September 2014.

a An asterisk (*) indicates a significant difference from the respective nontreated control at α=0.05.
b Nontreated controls planted in spring 2007 for comparison to spring 2007 treatments.
c Nontreated controls planted in spring 2008 for comparison to summer 2007 and spring 2008 treatments.
Analogous spring 2007 and 2008 treatments did not differ at Lower Sam at any time for any of the cover variables. At Hooker and Upper Sam, differences occurred, but the trends were not consistent. At Hooker, the spring 2008 treatments resulted in less total (nonconifer) and forb cover in year 1 than spring 2007 treatments, but greater cover in year 2, while at Upper Sam, the spring 2007 treatments had less total and forb cover than the spring 2008 treatments in both years 1 and 2 as well as less shrub cover in year 1. Treatments applied in March 2007 were more effective in reducing vegetative cover than were the same treatments applied in May 2008 when comparing second-year cover. This may be related to differences in developmental stage of target plants at the time of spraying; plants were less emerged in March 2007 than they were in May 2008, despite the later snow melt in 2008.
Vegetation within clearcuts can be highly diverse (Aavik et al Reference Aavik, Pussa, Roosaluste and Moora2009; Duguid and Ashton Reference Duguid and Ashton2013), which makes it difficult to get consistent results within and across sites. Differences in initial species composition across sites and the above variability in responses suggest that some care is essential in identifying species within a site that need control in order to obtain optimal results. Variability from plot to plot made analyses difficult to interpret even when using initial frequency or cover for each species as a covariate. Not all sites offered populations of some species large enough to statistically evaluate before/after changes simply because a high relative change in abundance of one or more species may be a small absolute change that may not be detectable statistically. Species of low initial abundance do not necessarily reflect sensitivity to control, but they may be present in numbers of potential concern after release, such as tall forbs in general and grasses, which were sparse at Lower Sam.
Community composition was typically not affected by herbicides in the long term, although abundance and relative dominance can be modified (Biring et al. Reference Biring, Hays-Byl and Hoyles1999, Reference Biring, Comeau and Fielder2003; Ristau et al. Reference Ristau, Stoleson, Horsley and deCalesta2011). In our study, dominant vegetation 7 to 8 years after treatment varied predominantly by site, rather than by herbicide treatment. This was expected, as vegetation developed after the herbicide treatments (Biring et al. Reference Biring, Yearsley and Hays-Byl2000; Harper et al. Reference Harper, Herring and Hays-Byl1997; Sullivan et al. Reference Sullivan, Wagner, Pitt, Lautenschlager and Chen1998). Both Hooker and Upper Sam received release sprays in the summer of 2012, two years before the last vegetation evaluation. Herbicides were applied uniformly across both sites, so all plots were treated, but it is not known how much the herbicides affected vegetation development. Lower Sam did not receive a release spray, and 7 years after application shrub cover was 23% to 24% for glyphosate plus imazapyr and summer imazapyr at 0.42 kg ha−1 (treatments 10 and 16, respectively), while it was 54% in the nontreated plots. The dominant shrub in the plots was snowberry, and although shrubs were present on these two treatments, regrowth was slower than it was in other treatments or the nontreated plots.
Seasonal differences in susceptibility to herbicide treatment are important (Kelpsas and Landgren Reference Kelpsas and Landgren2016). Spring herbicide treatments had less second-year grass cover than did summer treatments, but certain summer treatments had better second-year cover reduction of shrubs. Summer site preparation treatments also allow the use of chemicals at higher rates or the use of chemicals that are not safe over conifers, such as aminopyralid plus sulfometuron.
Unintended damage to crop trees is a serious consideration with herbicides. The general efficacy of imazapyr at 0.42 kg ha−1 on all vegetation is not surprising (Kelpsas and Landgren Reference Kelpsas and Landgren2016). There was some injury to conifer seedlings, as well, but the injury was lower than the results of previous studies suggest (Cole et al. Reference Cole, Newton and White1986; Reference Cole, Newton and White1988). Still, this product needs considerable further testing to examine its safety for site preparation immediately before planting. There were circumstances where the aminopyralid plus sulfometuron summer application was effective. Aminopyralid is toxic to conifers through uptake from soil (Kelpsas and Landgren Reference Kelpsas and Landgren2016), and care is needed when considering use of aminopyralid for forestry applications, most particularly in evaluating the gap between time of application and time of planting. Similar consideration is due for observations of stunted seedling growth by residues of sulfometuron products (Robertson and Davis Reference Robertson and Davis2012). Although applications of hexazinone prior to planting decreased total cover for 2 and 3 years, greater mortality of larch plugs (but not bareroots) occurred (Lindsay Reference Lindsay2011). Averaged over both planting years, survival was 32% for larch bareroots in nontreated plots and 54% for larch bareroots in hexazinone plots. For larch plugs, survival was 40% in nontreated and 33% in hexazinone plots (Cole et al. unpublished). Douglas-fir is generally considered not susceptible to injury from hexazinone, especially at lower rates (Kelpsas and Landgren Reference Kelpsas and Landgren2016). More research on herbicides of interest is needed for each stock type to determine the minimum time needed between an herbicide application and planting.
Chemical control of vegetation is a dynamic and transient process, with most herbicides only reducing first-year total cover. The high rate of imazapyr, hexazinone, and treatments with sulfometuron were the most likely to have continued cover reduction into year 2. Despite being short-lived, the initial 1 to 2 years can be critical for establishment of artificial and natural tree regeneration (Dinger and Rose Reference Dinger and Rose2010; Hytönen and Jylhä Reference Hytönen and Jylhä2011; Rosner and Rose Reference Rosner and Rose2006; Wagner and Robinson Reference Wagner and Robinson2006). Early dominance of tree seedlings can promote subsequent survival and growth as they progressively overtop and shade other vegetation.
Soil Moisture
Soil moisture was assumed to be fully recharged each spring by melting snow across all treatments and sites. Plots with greater vegetative cover, such as nontreated plots, demonstrated more rapid depletion of soil water later in the growing season (Figure 4). In 2007, depletion of soil water at Hooker began in the surface 23 cm of soil depth after mid-April, and was still declining at mid-August (Figure 4). By mid-August, the difference between the nontreated plots and most other treatments had increased by about 5%, and the water depletion rate was leveling off. At the 46-cm depth (data not shown), depletion did not begin before mid-June; then all cover levels depleted water at the same rate, indicating that the abundance of water at that depth was sufficient to provide for transpiration throughout the summer wherever there was green leaf area. While rates of depletion at both depths were similar, differences favoring treatments that led to lower cover vs. fully vegetated nontreated plots persisted longer, such that by late August there was substantially more soil moisture in plots with sparse plant cover than there was in fully vegetated plots (Figure 5). The rate of depletion in Upper Sam, the site with the shallowest soils, was similar to that in Hooker. Throughout the growing season, the most heavily vegetated cover maintained 10% to 15% difference in moisture content between plots with nontreated cover and plots with substantially decreased cover.

Figure 4 Volumetric soil moisture during the 2007 growing season for the 0- to 23-cm depth for the 2007 plantings.
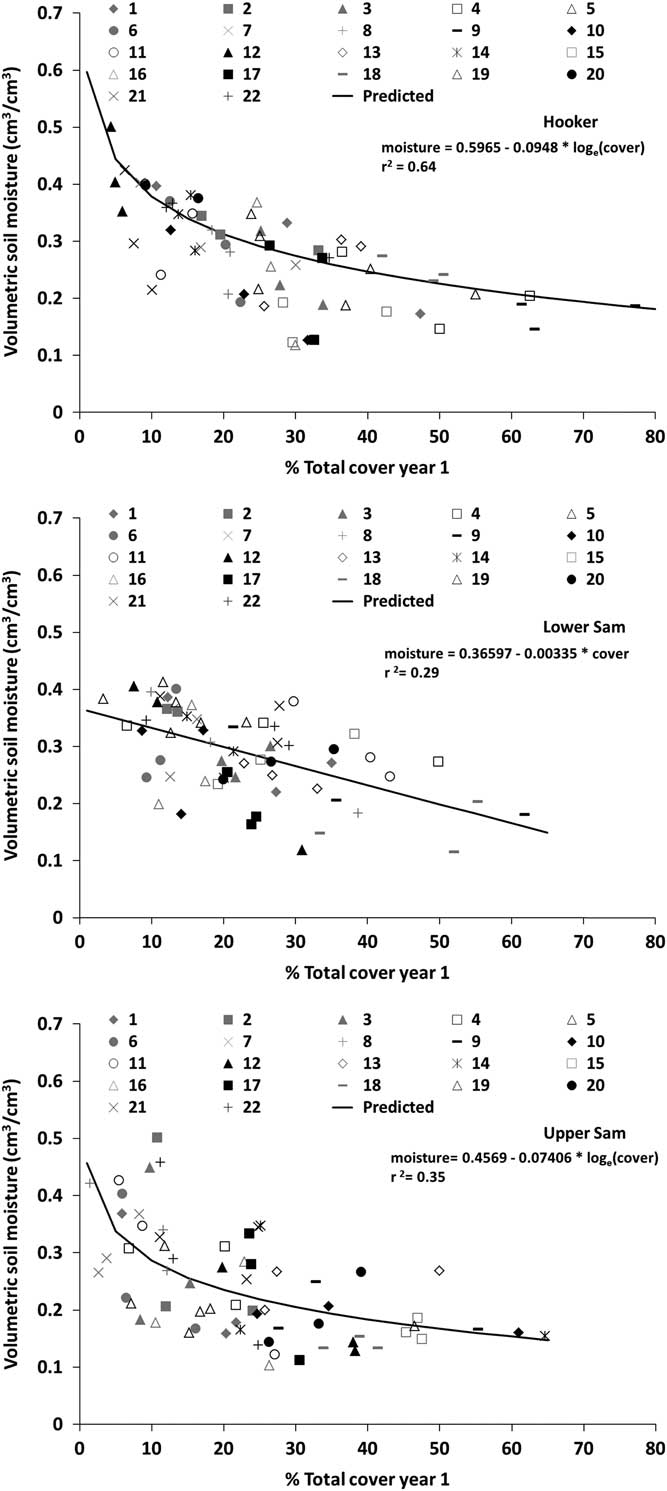
Figure 5 Volumetric soil moisture related to total cover in the first year after planting. Treatments 1 through 9 are from calendar year 2007, while treatments 10 through 22 are from calendar year 2008. Refer to Table 2 for treatment numbers.
In 2008, the rate of decrease in soil water was much more rapid after the late-May onset of depletion and reached a minimum in early August (Figures 6 and 7). The more rapid decline is likely related to lower precipitation in June 2008 than in June 2007 (Figure 8, interval 4). At Hooker in the plots planted in 2007, the depletion rate in the surface 23 cm of soil was nearly identical for all levels of cover after May. By August 4, 2008, the surface water depletion had reached minima similar to that in 2007 before a precipitation event stopped depletion. The depletion rate at Upper Sam was almost identical, and in nontreated plots the depletion period ended at nearly the same time as the average of plots with lower levels of vegetative cover. At all sites, at least one herbicide treatment had greater soil moisture depletion than that of nontreated plots at the 23-cm depth; this observation attests to the probability of generally high variability in soil water retention as well as the lack of efficacy for some of the treatments.
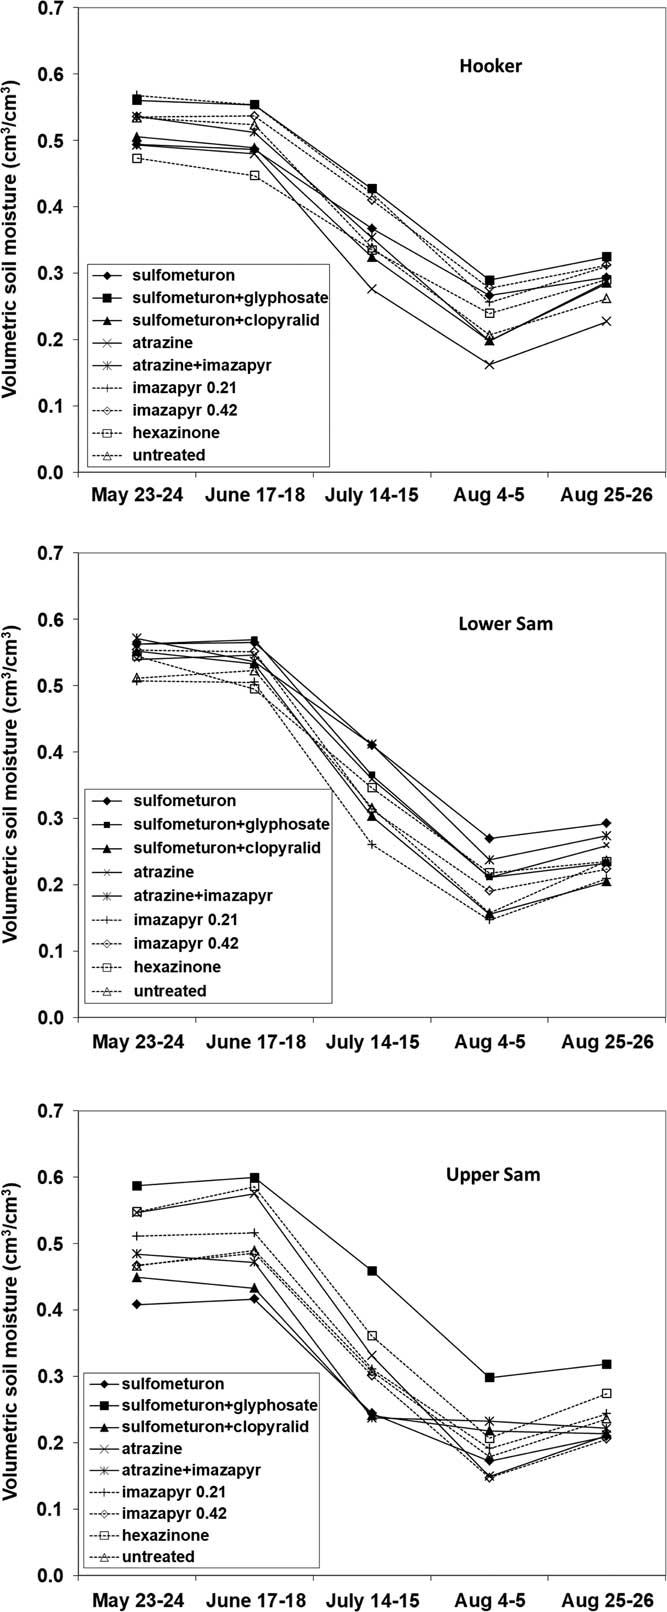
Figure 6 Volumetric soil moisture in the 0- to 23-cm depth during the 2008 growing season for the 2007 plantings.
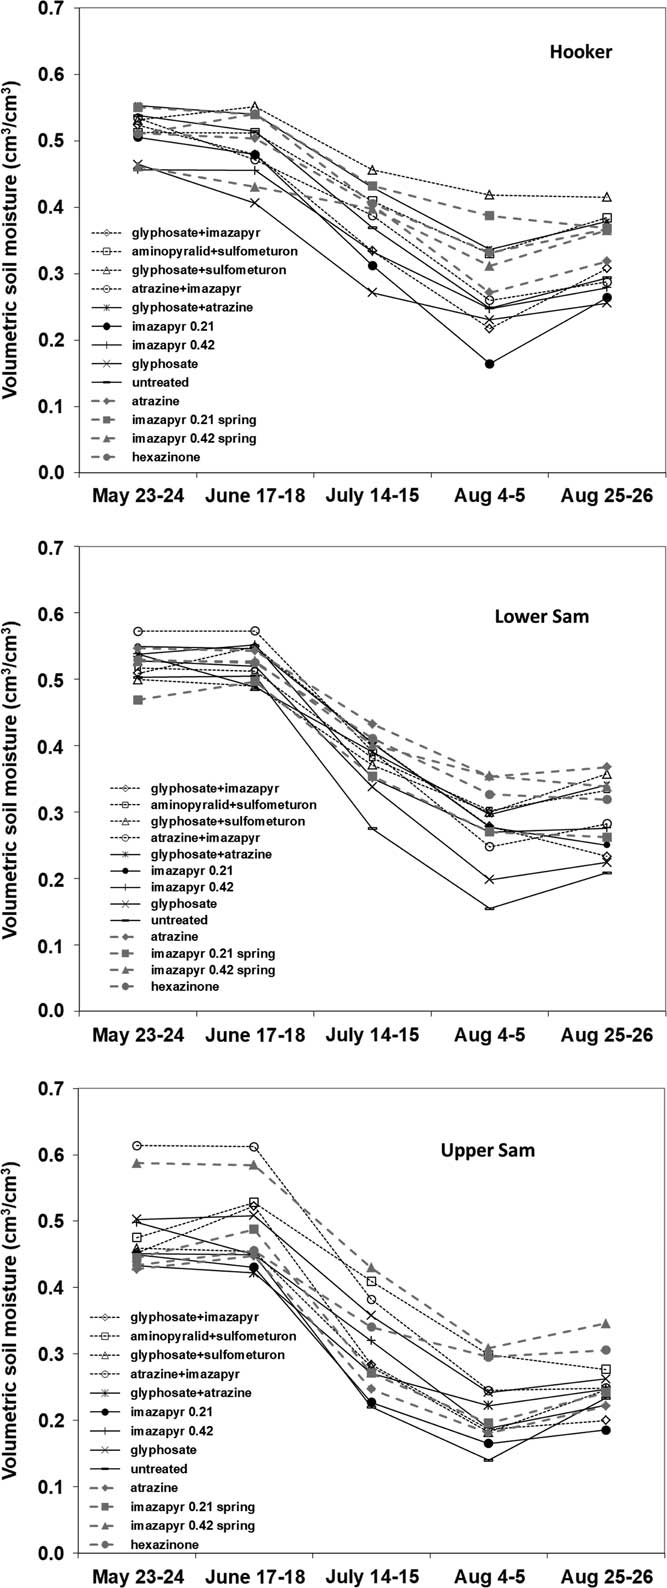
Figure 7 Volumetric soil moisture for the 0- to 23-cm depth during the 2008 growing season for the 2008 plantings.
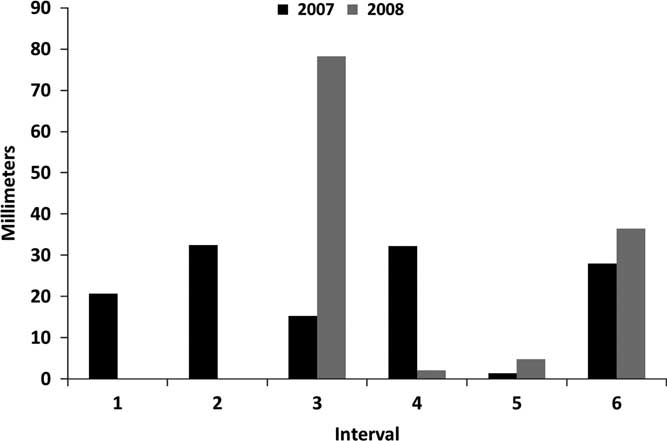
Figure 8 Precipitation patterns during periods of soil moisture measurements for 2007 and 2008. For 2007, interval 1 was March 28 to April 14, interval 2 was April 15 to May 11, interval 3 was May 12 to June 13, interval 4 was June 14 to June 28, interval 5 was June 29 to July 17, and interval 6 was July 18 to August 21. No soil moisture measurements were made for intervals 1 and 2 in 2008. For 2008, interval 3 was May 23 to June 17, interval 4 was June 18 to July 14, interval 5 was July 15 to August 4, and interval 6 was August 5 to August 25. Data were generated from the PRISM model (PRISM Climate Group 2017).
Although significant trends relating soil moisture in August to first-year cover were found at all sites (Figure 5), variability among the plots reduced correlations (r2 values of 0.29 to 0.64). Examination of soil moisture to cover relationships by vegetation groups indicated that forbs and grasses at Hooker (r2=0.50) and Upper Sam (r2=0.30) and shrubs at Lower Sam (r2=0.25) were the primary drivers of summer soil moisture depletion, but total cover was the best overall predictor (Figure 5). Herbicides were effective at reducing cover leading to increases in soil moisture late in the growing season that could potentially be utilized by planted or natural seedlings. However, variability among the plots in treatment efficacy, coupled with microsite variability, made correlations weak at Upper and Lower Sam. With periods of summer drought that occur throughout the region, Douglas-fir has shown increased survival and growth when vegetation management has increased soil moisture availability (Dinger Reference Dinger2012; Dinger and Rose Reference Dinger and Rose2009, Reference Dinger and Rose2010; Harrington et al. Reference Harrington, Slesak and Schoenholtz2013). Site and soil conditions in northeastern Oregon can be intrinsically highly variable (Emmingham et al. Reference Emmingham, Oester, Fitzgerald, Filip and Edge2005). Soils on these sites are colluvium and residuum overlain with loess and ash deposits. This, combined with rugged terrain, make for highly variable soil depth and drainage patterns, as well as the possibility of frost pockets.
Variability of species distribution within sites precluded our ability to examine individual species effects on soil moisture, but it is likely that 20% cover of one species would not equate to the same level of moisture depletion as 20% cover of a different species or species group. Although we did have some cover information for individual species, distribution was sporadic enough to complicate discernment of patterns among the over 145 species present. This high variability of microsite conditions coupled with species composition may make it difficult to obtain more consistent results with vegetation management treatments.
In summary, herbicides on the three study sites significantly reduced first-year vegetative cover. The most effective treatment varied among the sites and was likely related to differences in species composition among those sites; variability within and among sites was high, making it difficult to determine consistent trends. In general, sulfometuron (0.14 kg ha−1 alone and in various mixtures), imazapyr (0.42 kg ha−1), and hexazinone (1.68 kg ha−1) resulted in less than 20% first-year cover of forbs and grasses when applied in spring. Sulfometuron plus glyphosate (2.2 kg ha−1) consistently reduced grasses and forbs and aminopyralid (0.12 kg ha−1) plus sulfometuron reduced forb cover for the first year when applied in summer. Forb cover in treated plots was similar to levels in nontreated plots in the second year, and some species of forbs had increased relative to nontreated plots. Imazapyr at 0.21 and 0.42 kg ha−1 in spring or summer 2007, or at lower rate (0.14 kg ha−1) with glyphosate in summer, resulted in the best control of shrubs, of which snowberry was the dominant species. Soil moisture depletion varied by treatment and year, with greater depletion rates in early summer in 2008 than in 2007, likely related to lower precipitation in June 2008 than in June 2007. Decreases in cover were correlated with increases in soil moisture content, especially late in the growing season in the absence of precipitation. This indicated that vegetation management treatments could help in establishing planted seedlings on sites where summer soil moisture was limiting.
Disclaimer
This document contains information about herbicides, which are regulated by federal and state laws in the United States. Oregon State University is not responsible for misuse and does not endorse any of the products mentioned. WARNING: This publication reports research involving pesticides. It does not contain recommendations for their use, nor does it imply that the uses discussed here have been registered. All uses of pesticides must be registered by appropriate state and federal agencies in the United States before they can be recommended. International users should check with local authorities before application.
Acknowledgements
We gratefully acknowledge and appreciate the contributions of employees of Forest Capital Corporation (now Hancock Forest Management) who assisted in the planning, layout, and maintenance of the plots, the planters, and several others who assisted in establishing the plots. Funding was provided by Forest Capital (first years and planting) and Hancock (2014 measurements) and the Oregon State University Foundation Endowment for Long-Term Silviculture. We also thank the anonymous reviewers for their insightful comments that have helped improve this manuscript.


