


Introduction
Rice growth and development stages are described as vegetative, reproductive, grain filling, and ripening (Buehring Reference Buehring2008; Dunand and Saichuk Reference Dunand and Saichuk2014; Moldenhauer and Gibbons Reference Moldenhauer and Gibbons2003; Moldenhauer et al. Reference Moldenhauer, Wilson, Counce and Hardke2013). Rice seedling germination occurs when the seed has absorbed moisture and becomes malleable before emerging from the soil (Buehring Reference Buehring2008; Dunand and Saichuk Reference Dunand and Saichuk2014; Moldenhauer et al. Reference Moldenhauer, Wilson, Counce and Hardke2013). Rice emergence is identified as coleoptile emergence above the soil line (Buehring Reference Buehring2008; Dunand and Saichuk Reference Dunand and Saichuk2014; Moldenhauer et al. Reference Moldenhauer, Wilson, Counce and Hardke2013). Growth stages from rice seedling emergence to panicle initiation (PI) are considered vegetative, whereas subsequent growth stages from PI to grain filling are regarded as reproductive (Buehring Reference Buehring2008; Dunanad and Saichuk Reference Dunand and Saichuk2014; Moldenhauer et al. Reference Moldenhauer, Wilson, Counce and Hardke2013). Grain ripening begins following rice flower pollination (Moldenhauer and Gibbons Reference Moldenhauer and Gibbons2003). Rice yield is primarily determined by panicle density (number of panicles per unit of area), grains per panicle, and individual grain weight (Buehring Reference Buehring2008; Moldenhauer et al. Reference Moldenhauer, Wilson, Counce and Hardke2013). However, numerous environmental and nonenvironmental factors can affect grain development, including insects, cold water stress, diseases, nutrient deficiencies, temperature, and off-target herbicide injury (Buehring Reference Buehring2008; Hensley et al. Reference Hensley, Webster, Blouin, Harrell and Bond2012).
Herbicide drift is defined as the movement of herbicide particles in the air soon after application to any off-target location. Drift is influenced by environmental conditions, nozzle and droplet size, spray pressure, nozzle angle, herbicide formulation, applicator speed, and boom height (Dexter Reference Dexter1995; Henry et al. Reference Henry, Shaw, Reddy, Bruce and Tamhankar2004; USEPA 2015). Types of drift events include droplet, particle, and vapor (Fishel and Ferrell Reference Fishel and Ferrell2016). Droplet is the most common type of drift and occurs when herbicides move off target during application (Fishel and Ferrell Reference Fishel and Ferrell2016). Particle drift occurs when solid particles such as soil or dust formulations move off target (Fishel and Ferrell Reference Fishel and Ferrell2016; Jordan et al. Reference Jordan, Nice, Johnson and Bauman2009). Vapor drift events are functions of environmental conditions and herbicide formulation (Jordan et al. Reference Jordan, Nice, Johnson and Bauman2009).
Research suggests off-target herbicide concentrations can be as great as 1% to 10% of the suggested use rate for particle drift (Al-Khatib and Peterson Reference Al-Khatib and Peterson1999). Other research suggests that herbicide concentrations of vapor drift can be 0.1% of the recommended use rate (Egan et al. Reference Egan, Barlow and Mortensen2014). For example, cotton (Gossypium hirsutum L.) injury was 76% 48 h after exposure to ester formulations of 2,4-D compared with 5% injury from the choline formulation (Sosnoskie et al. Reference Sosnoskie, Culpepper, Braxton and Richburg2015). Herbicide concentration 2 m from application ranged from 0.1% to 9% of the original use rate; however, herbicide concentrations decreased exponentially as the distance from application increased (Carlsen et al. Reference Carlsen, Spliid and Svensmark2006). Wind speeds ≥16 km h−1 and temperature inversions can enhance the severity and distance of off-target herbicide movement (Henry et al. Reference Henry, Shaw, Reddy, Bruce and Tamhankar2004; Jordan et al. Reference Jordan, Nice, Johnson and Bauman2009).
Spray droplet sizes with a volume median diameter ≤105 µm are considered extremely fine and have the greatest tendency to move off target compared with larger droplet sizes (Dexter Reference Dexter1995; Hanks Reference Hanks1995; McCloskey et al. Reference McCloskey, Sanchez and Brown2012). Extremely fine droplets can remain in the air for 10 min and travel distances of ≥13 m in wind speeds of 5 km h−1 (Dexter Reference Dexter1995). Proper nozzle selection, pressure adjustment, and boom height for herbicide application will reduce off-target herbicide movement (Hanna et al. Reference Hanna and Schaefer2008; Jordan et al. Reference Jordan, Nice, Johnson and Bauman2009; McCloskey et al. Reference McCloskey, Sanchez and Brown2012). A reduction in pressure results in a greater spray droplet size, making droplets heavier and less likely to move off target (Dexter Reference Dexter1995; Jordan et al. Reference Jordan, Nice, Johnson and Bauman2009).
Paraquat is labeled for use at preplant, PRE, or post-directed in corn (Zea mays L.), cotton, grain sorghum [Sorghum bicolor (L.) Moench], peanut (Arachis hypogaea L.), soybean [Glycine max (L.) Merr], and numerous vegetable and fruit crops for nonselective weed control (Anonymous 2019; Shaner Reference Shaner2014). However, paraquat is only labeled for preplant or PRE use with rice (Anonymous 2019; Bond Reference Bond2020). Row crop producers in Mississippi have widely adopted the use of paraquat in mixture with herbicides representing multiple herbicide modes of action (MOAs) prior to planting to minimize glyphosate-resistant (GR) weed interference with crops (Anonymous 2018).
The use of herbicides for weed control has increased production efficiency across all crops in the midsouthern United States; however, off-target herbicide movement has been documented to negatively affect numerous crops including corn, cotton, grain sorghum, peanut, soybean, and wheat (Triticum aestivum L.; Al-Katib et al. Reference Al-Khatib, Claassen, Stahlman, Geier, Regehr, Duncan and Heer2003; Anderson et al. Reference Anderson, Clay, Wrage and Matthees2004; Hensley et al. Reference Hensley, Webster, Blouin, Harrell and Bond2012; Johnson et al. Reference Johnson, Fisher, Jordan, Edmisten, Stewart and York2012). Glyphosate applied at 112 g ae ha−1 injured up to 78% of grain sorghum 2 wk after treatment (WAT; Al-Khatib et al. Reference Al-Khatib, Claassen, Stahlman, Geier, Regehr, Duncan and Heer2003). Wheat yield was reduced 54% following glyphosate application at 140 g ha−1 during early flowering (Roider et al. Reference Roider, Griffin, Harrison and Jones2007). Anderson et al. (Reference Anderson, Clay, Wrage and Matthees2004) reported dicamba applied to soybean at 5.6 g ae ha−1 during the V3 growth stage reduced yield by 34%. When applied to V3 soybean, 2,4-dichlorophenoxacetic acid (2,4-D) at 11.2, 56, and 112 g ae ha−1 resulted in 5%, 23%, and 33% injury, respectively (Anderson et al. Reference Anderson, Clay, Wrage and Matthees2004). Marple et al. (Reference Marple, Al-Khatib and Peterson2008) reported 88% injury 28 d following 2,4-D at 2.8 g ha−1 applied to three- to four-leaf cotton. McCoy et al. (Reference McCoy, Bond, Golden and Lawrence2017) reported 18% to 28% rice grain yield reductions for inbred rice cultivars following late-season exposure to paraquat applied at 0.028 kg ha−1. Additionally, extensive research has documented the effects of glyphosate, glufosinate, and acetolactate synthase (ALS)-inhibiting herbicides to rice; however, limited data have been published on how rice responds to paraquat (Bond et al. Reference Bond, Griffin, Ellis, Linscombe and Williams2006; Davis et al. Reference Davis, Scott, Norsworthy and Gbur2011; Webster et al. Reference Webster, Hensley, Blouin, Harrell and Bond2015).
In recent years, cases of off-target movement of paraquat to rice have increased. Problematically, additional herbicide MOAs are often mixed with paraquat in preplant applications. Photosystem II, protoporphyrinogen oxidase, and ALS-inhibiting herbicides represent common MOAs present in paraquat mixtures applied preplant and/or PRE. Diagnosing the severity of rice injury following off-target paraquat drift is challenging due to the potential complexity of symptoms associated with the MOAs mixed with paraquat. Therefore, four concurrent studies were conducted to evaluate rice response to sublethal concentration of paraquat, metribuzin, fomesafen, and cloransulam-methyl applied at five rice growth stages.
Materials and Methods
Four concurrent studies were conducted from 2015 to 2018 at the Mississippi State University Delta Research and Extension Center in Stoneville, MS, to determine the effects of paraquat (Paraquat Timing Study), metribuzin (Metribuzin Timing Study), fomesafen (Fomesafen Timing Study), and cloransulam-methyl (Cloransulam-methyl Timing Study) applied at different rice growth stages. Global positioning system coordinates, soil series, soil description, previous crop, soil pH, and soil organic matter for each study are described in Table 1.
Table 1. soil series, soil description, previous crop, soil pH, and soil organic matter in four concurrent studies evaluating rice performance following exposure to sublethal rates of paraquat, metribuzin, fomesafen, and cloransulam-methyl at five growth stages.

a Abbreviation: OM, organic matter.
Glyphosate (Roundup PowerMax 4.5 L, 1,120 g ha−1; Bayer Cropscience, 800 N. Lindburgh Blvd., St. Louis, MO 63167), paraquat (Gramoxone 2.0 SL, 560 g ai ha−1; Syngenta Crop Protection, P.O. Box 18300 Greensboro, NC 27409), and/or 2,4-D (2,4-D Amine 3.8 SL, 560 g ha−1; Agri Star, 1525 NE 36th St., Ankeny, IA 50021) were applied in late March to early April at each site-year to control emerged vegetation. Clomazone (Command 3 ME, 498 g ai ha−1; FMC Corporation, 1735 Market St., Philadelphia, PA 19103) plus saflufenacil (Sharpen 2.85 SC, 4.5 g ai ha−1; BASF Crop Protection, 26 Davis Dr., Research Triangle Park, NC 27709) were applied PRE each site-year for residual weed control. Fenoxaprop-p-ethyl (Ricestar HT 0.58 EC, 1,949 g ai ha−1; Bayer CropScience, 2 T.W. Alexander Dr., Research Triangle Park, NC 27709) and quinclorac (Facet 1.50 SL, 375 g ai ha−1; BASF Crop Protection) plus halosulfuron (Permit 75 DF, 12 g ai ha−1; Gowan Company, P.O. Box 5569, Yuma, AZ 85364) plus petroleum oil surfactant (Herbimax, 83% petroleum oil; Loveland Products, P.O. Box 1286, Greeley, CO 80632) at 1% (vol/vol) were applied at three- to four-leaf (MPOST) rice to maintain experimental sites weed free.
Rice was drill-seeded on June 9, 2015; May 11 and 17, 2016; May 9 and 18, 2017; and May 7, 2018, to a depth of 2 cm using a small-plot grain drill (Great Plains 1520; Great Plains Mfg, Inc., 1525 East North St., Salina, KS 67401). Rice cultivar, ‘CL151’ (HorizonAg, 8275 Tournament Dr. Suite 255, Memphis, TN 38125) was seeded at 83 kg ha−1 (356 seed m−2) all site-years. Treated plots contained eight rows of rice spaced 20 cm apart and were 4.6 m in length. Treated plots were bordered on either end by a 1.5-m fallow alley that contained no rice and on each side by identically sized plots as a buffer were included to minimize treatment contamination. Plots were flooded to an approximate depth of 6 to 10 cm when rice reached the one- to two-tiller stage. Herbicide treatments were applied using a CO2-pressurized backpack sprayer equipped with flat-fan nozzles (AIRMIX11002 nozzle; Greenleaf Technologies, 230 E Gibson St., Covington, LA 70433) set to deliver 140 L ha−1 at 206 kPa using water as a carrier. All herbicide treatments included a nonionic surfactant (Activator 90, 90% nonionic surfactant; Loveland Products) at 0.5% (vol/vol) and ammonium sulfate as a water-conditioning agent (Class Act NG, 50% nitrogen fertilizer; WinField Solutions, P.O. Box 64589, St. Paul, MN 55164) at 2.5% (vol/vol). Rice in all studies was managed throughout the growing season to optimize yield (Buehring Reference Buehring2008).
The experimental design for all studies was a randomized complete block with four replications. Paraquat treatments were applied at a sublethal rate of 10% of their suggested use rate in Mississippi (Al-Khatib and Peterson Reference Al-Khatib and Peterson1999; Anonymous 2019). Paraquat at 84 g ha−1, metribuzin (Tricor 75 DF, herbicide; United Phosphorus, Inc., 630 Freedom Business Center, Suite 402, King of Prussia, PA 19406) at 42 g ai ha−1, fomesafen (Flexstar 1.88 SL, herbicide; Syngenta Crop Protection) at 39 g ai ha−1, or cloransulam-methyl (FirstRate 0.84 DF, herbicide Dow AgroSciences, LLC, 9330 Zionsville Rd., Indianapolis, IN 46268) at 3.5 g ai ha−1 were applied to rice in the spiking to one-leaf (VEPOST), two- to three-leaf (EPOST), MPOST, 7 d postflood (PFLD), and panicle differentiation (PD) growth stages. These growth stages were used to best represent rice in varying ranges of vegetative and early reproductive growth stages.
In all four studies, visible estimates of aboveground rice injury were recorded 3, 7, 14, 21, and 28 d after treatment (DAT) on a scale of 0% to 100% where 0% indicated no visible effect of herbicides and 100% indicated complete plant death. Rice root injury was recorded 21 DAT on the previously described scale by comparing roots of five randomly selected plants in each plot with those of plants from nontreated plots in the same replication. Plant height was determined 14 DAT by measuring from the soil surface to the upper most extended leaf and calculating the mean height of five randomly selected plants in each plot. Plant height was converted to a percentage of the nontreated control in each replication to account for differences in rice growth stage at time of treatment application and data collection. Percentage of nontreated control data were calculated by dividing the data from the treated plot by that in the nontreated control plot in the same replication and multiplying by 100. The number of days to 50% heading was recorded as an indication of rice maturity by calculating the time from seedling emergence until 50% of rice plants in an individual plot had visible panicles. Number of days to 50% heading data were converted to delay in maturity calculated by subtracting days to 50% heading in an individual plot from that in the nontreated. At maturity, a randomly selected area measuring 1 m was hand-harvested from rows 2 or 7 in each plot to determine rice dry weight, yield components (panicle density, filled grains per panicle, and 1,000-grain weight), and seed germination percentage.
All study plants were harvested with a small-plot combine (Wintersteiger Delta; Wintersteiger, Inc., 4705 W. Amelia Earhart Dr., Salt Lake City, UT 84116) at a moisture content of approximately 20%. Grain weight and moisture contents were recorded, and rough rice grain yield was adjusted to a uniform moisture content of 12% for statistical analysis. Whole and total milled rice yield was determined from cleaned 120-g subsamples of rough rice using the procedure outlined by Adair et al. (Reference Adair, Bollich, Bowman, Jordon, Johnson, Webb and Atkins1972). Rice was mechanically hulled and milled in a Grainman (Grain Machinery Manufacturing Corp., 1130 NW 163 Dr., Miami, FL 33169) No. 2 miller for 30 s and size-separated with a No. 12 (4.76-mm) screen. Whole and total milled rice yields were expressed as a mass fraction of the original 120-g sample of rough rice.
Hand-harvested samples were dried in a greenhouse at 32 to 49 (±5) C for 2 wk, and weighed to determine rice dry weight. Individual weights were converted to grams per square meter. The total number of seed-bearing panicles in each hand-harvested sample was counted to determine panicle density (panicle number per square meter). Panicles from each hand-harvested sample were processed with a plot thresher, and the number of filled grains was counted to determine the average number of filled grains per panicle for each treatment. Grain was dried to approximately 12% moisture content, and weight was recorded. Five 1,000-grain subsamples were then weighed to determine 1,000-grain weight. Seed germination percentage was determined based on the number of germinated seeds out of 100 after 48 h of exposure to a 14-h photoperiod at 35 C.
Injury data in all studies were regressed against DAT allowing for both linear and quadratic terms with coefficients depending on DAT and nonsignificant model terms were removed sequentially until a satisfactory model was obtained (Golden et al. Reference Golden, Slaton, Norman, Gbur, Brye and Delong2006). All other data were regressed against days after emergence (DAE) allowing for both linear and quadratic terms with coefficients depending on DAE, and nonsignificant model terms were removed sequentially until a satisfactory model was obtained. Data that did not exhibit a significant trend were subjected to ANOVA using the MIXED procedure in SAS version 9.3 (SAS Institute Inc., 100 SAS Campus Drive, Cary, NC 27513-2414) with site-year and replication (nested within experimental run) as random effects parameters (Blouin et al. Reference Blouin, Webster and Bond2011). Least square means were calculated and mean separation (P ≤ 0.05) was produced using the PDMIX800 procedure in SAS, which is a macro for converting mean separation output to letter groupings (Saxton Reference Saxton1998).
Results and Discussion
Paraquat Timing Study
Quadratic trends were detected for rice injury, delay in maturity, and seeds per panicle following rice exposure to paraquat (Tables 2 and 3). However, nonlinear portions of the fitted line were no different from zero for MPOST and PFLD timings (Table 2). Linear trends were detected for rough rice yield, dry weight, panicle density, and seed germination (Table 3).
Table 2. Regression coefficients in four concurrent studies for rice injury across evaluation intervals following exposure to paraquat at 84 g ai ha−1 (Paraquat Timing Study), metribuzin at 42 g ha−1 (Metribuzin Timing Study), fomesafen at 39 g ha−1 (Fomesafen Timing Study), and cloransulam-methyl at 3.5 g ha−1 (Cloransulam-methyl Timing Study). a

a Data for the paraquat, metribuzin, and fomesafen timing studies are pooled across six site-years and three site-years for the cloransulam-methyl timing study.
b Application timings included spiking to one-leaf (VEPOST), two- to three-leaf (EPOST), three- to four-leaf (MPOST), 7 d postflood (PFLD), and panicle differentiation (PD).
c Coefficient is not significantly different than zero.
Table 3. Regression coefficients for delay in maturity, rough rice yield, mature dry weight, seed panicle−1, panicle density, and seed germination following exposure to paraquat at 84 g ai ha−1 in the Paraquat Timing Study.

a Data for delay in maturity are pooled across six site-years, and data for all other parameters are pooled across five site-years.
b Application timings included spiking to one-leaf (VEPOST), two- to three-leaf (EPOST), three- to four-leaf (MPOST), 7 d postflood (PFLD), and panicle differentiation (PD).
c Coefficient is not significantly different than zero, identifying there is no relationship in that portion of the line or curve.
Regardless of application timing, rice injury following paraquat exposure ranged from 37% to 47% 3 DAT (Figure 1). Rice exposed to paraquat VEPOST and EPOST exhibited similar trends in rice injury. Rice injury was maximized at 50% 14 DAT for rice exposed VEPOST; however, maximum injury with paraquat (54%) EPOST did not occur until 21 DAT (Figure 1). For both VEPOST and EPOST timings, rice appeared to exhibit some recovery; however, injury at 28 DAT was still 45% and 52% with VEPOST and EPOST timings, respectively (Figure 1). Rice exposed to paraquat MPOST and PFLD showed a similar trend in which injury progressively increased from 3 DAT to 28 DAT (Figure 1). Similar to other timings, injury 3 DAT for rice exposed to paraquat MPOST and PFLD was 40% and 39%, respectively (Figure 1). Rice injury 28 DAT for both MPOST and PFLD was ≥53% (Figure 1). Rice injury from paraquat exposure at PD was 47% 3 DAT, decreased to 41% by 14 DAT, but increased again to 51% by 28 DAT (Figure 1). Lawrence et al. (Reference Lawrence, Bond, Golden, Edwards, Peeples and McCoy2018) reported similar rice injury following paraquat at 84 g ha−1 applied to rice at an EPOST timing in a study evaluating rice response to a sublethal rate of paraquat alone or in mixtures with metribuzin or fomesafen. Although application timing was not a component of that research, rice injury ranged from 54% to 58% 14 and 28 DAT, respectively (Lawrence et al. Reference Lawrence, Bond, Golden, Edwards, Peeples and McCoy2018).

Figure 1. Rice injury following exposure to paraquat at 84 g ai ha−1 in the Paraquat Timing Study.
Delay in maturity increased linearly as paraquat exposure timing was delayed to later in the growing season (Figure 2). On average, delays in rice maturity increased 0.26 d d−1 following paraquat exposure from VEPOST through PD (Figure 2). Inversely, dry weight, rough rice yield, panicle density, and seed germination were reduced by 18.7 g, 131.5 kg ha−1, 5.6 m−2, and 0.3%, respectively, per day from paraquat exposure at VEPOST through PD timings (Table 3; Figure 2). Lawrence et al. (Reference Lawrence, Bond, Golden, Edwards, Peeples and McCoy2018) reported a 28% reduction in rough rice yield and a 9-d delay in maturity following exposure to paraquat EPOST. A quadratic trend was detected for seed per panicle; however, the linear term of the fitted line was no different than zero (Table 3; Figure 2). Seeds per panicle were reduced exponentially following rice exposure to paraquat approximately 10 DAE. Rice exposed to paraquat at 50 DAE produced 28 seeds per panicle compared with 97 seeds per panicle from the nontreated plants (Figure 2).
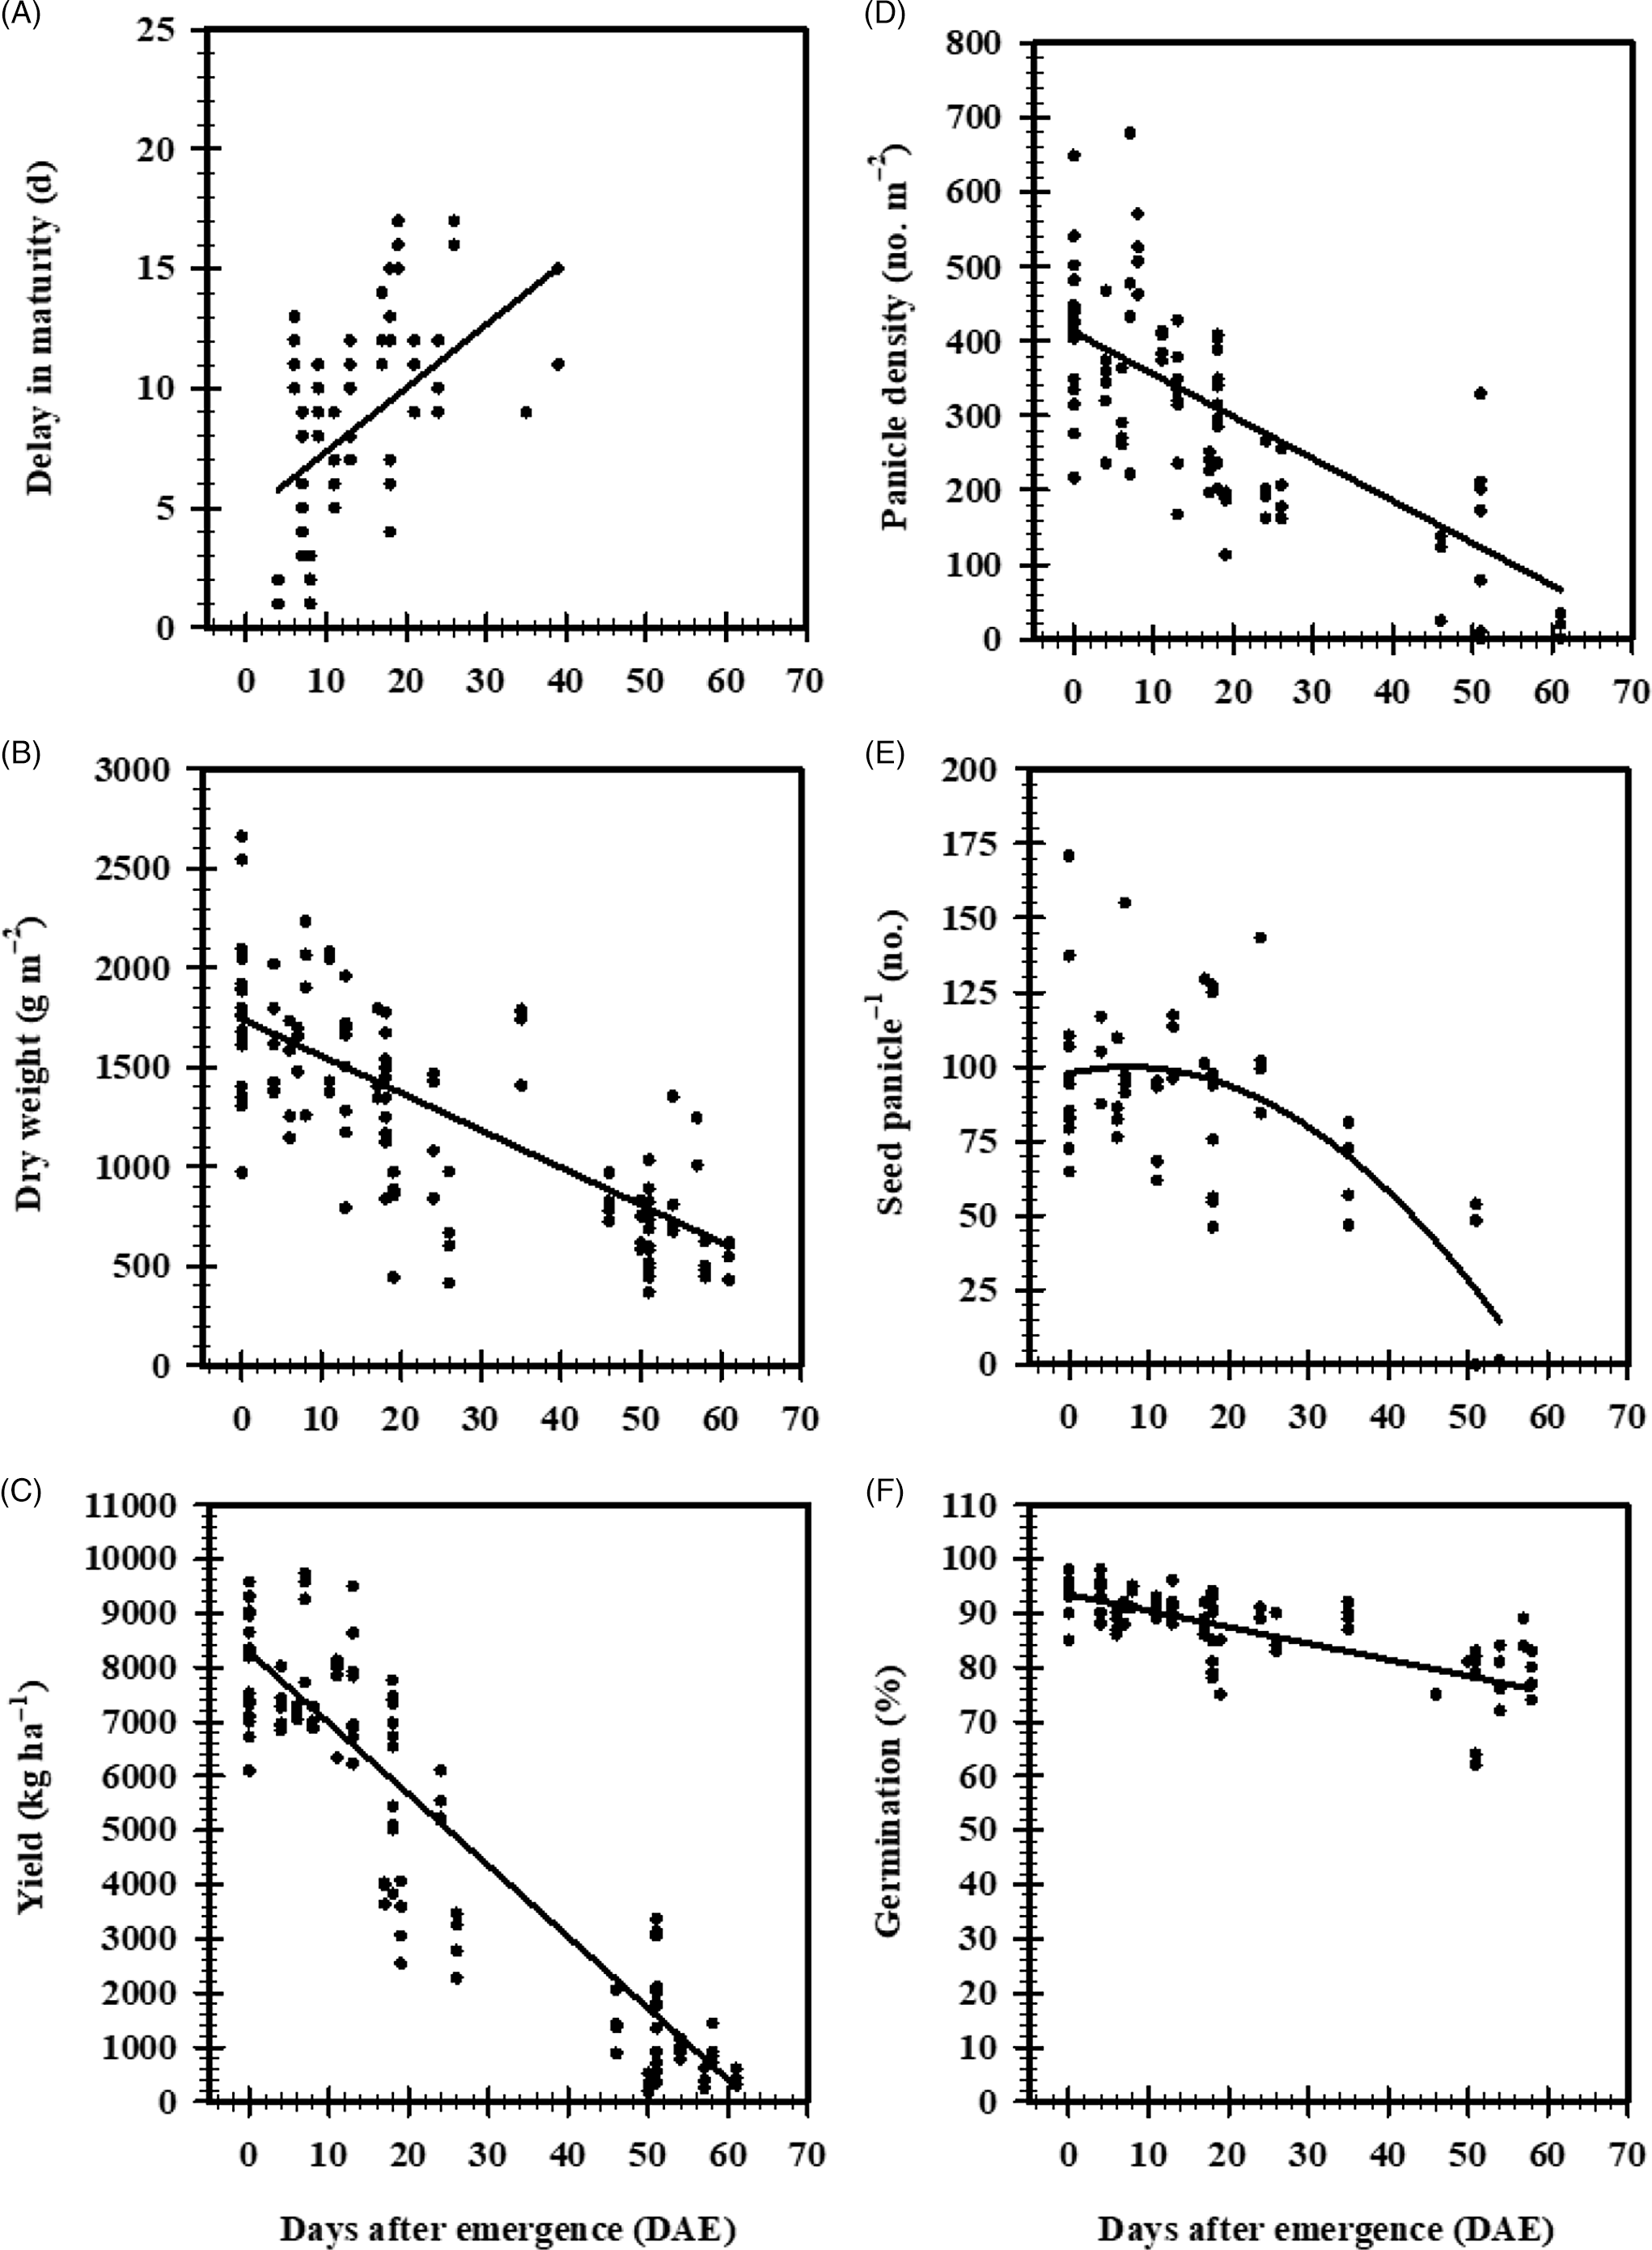
Figure 2. Rice delay in maturity (A), dry weight (B), rough rice yield (C), panicle density (D), seeds per panicle (E), and seed germination (F) following exposure to paraquat at 84 g ai ha−1 in the Paraquat Timing Study.
Rice height, 1,000-grain weight, total, and whole milled rice yield were affected by paraquat timing (Table 4). Rice height 14 DAT was more negatively impacted when rice was exposed to paraquat before flooding compared with postflood timings (Table 4). However, rice height 14 DAT following paraquat at PD was reduced by 15% compared with nontreated rice (Table 4). Conversely, 1,000-grain weight was more negatively impacted following exposure to paraquat postflood (Table 4). Averaged over five site-years, 1,000-grain weight was reduced to 17 g and 12 g following rice exposure to paraquat at PFLD and PD timings, respectively (Table 4).
Table 4. Rice height 14 d after treatment, 1,000-grain seed weight, total, and whole milled rice yield following exposure to paraquat at 84 g ai ha−1 in the Paraquat Timing Study. a

a Data for height are pooled over six site-years, and data for total and whole milled rice, 1,000-grain seed weight, and dry weight are pooled over five site-years. Means followed by the same letter for each parameter are not different at P ≤ 0.05.
b Application timings included spiking to one-leaf (VEPOST), two- to three-leaf (EPOST), three- to four-leaf (MPOST), 7 d postflood (PFLD), and panicle differentiation (PD).
Total and whole milled rice yield were affected by paraquat at different timings. Plots not treated with paraquat produced 70% and 58% total and whole milled rice, respectively (Table 4). However, milling yield was similar to that of the nontreated plants following paraquat exposure VEPOST, EPOST, and PD. Rice exposed to paraquat PFLD exhibited the most reduction in milling yield at 51% and 64% whole and total milled rice, respectively. However, these milling yield were comparable to milling yield following paraquat applied EPOST, MPOST, and PD (Table 4).
Metribuzin Timing Study
In the study evaluating rice response to a sublethal rate of metribuzin at different growth stages, only rice injury exhibited a quadratic trend (Table 2). Although significant trends were detected, rice injury was 5% to 12% regardless of application timing 3 DAT, and by 28 DAT, injury was 3% to 6% (Figure 3). Lawrence et al. (Reference Lawrence, Bond, Golden, Edwards, Peeples and McCoy2018) reported similar injury for rice exposed to metribuzin at 42 g ha−1 EPOST. Rice injury was ≤10% 14 and 28 DAT following exposure to metribuzin (Lawrence et al. Reference Lawrence, Bond, Golden, Edwards, Peeples and McCoy2018). No trends detected for rice injury translated into delays in maturity or reductions in dry weight, yield parameters, yield, or seed germination.

Figure 3. Rice injury following exposure to metribuzin at 42 g ai ha−1 in the Metribuzin Timing Study.
Fomesafen Timing Study
Quadratic trends were detected for rice injury following exposure to fomesafen; however, linear and quadratic terms were not different from zero for VEPOST timing (Table 2). Additionally, quadratic terms were not different from zero for EPOST and PFLD timings (Table 2). The linear term was not different from zero for the MPOST application timing (Table 2).
Although trends in rice injury were detected following all application timings, injury exceeded 11% only with the PFLD timing (Figure 4). Injury 3 DAT following fomesafen applied at the PFLD timing was 18%; however, by 28 DAT, that injury had decreased to 5% (Figure 4). Regardless of fomesafen application timing, rice injury ranged from 2% to 5% at 28 DAT (Figure 4). Sperry et al. (Reference Sperry, Lawrence, Bond and Reynolds2019) reported greater injury following corn exposure to fomesafen at 35 g ha−1 at different vegetative growth stages. Regardless of application timing, injury to corn following exposure to a sublethal rate of fomesafen was 5% to 16% 28 DAT (Sperry et al. Reference Sperry, Lawrence, Bond and Reynolds2019).

Figure 4. Rice injury following exposure to fomesafen at 39 g ai ha−1 in the Fomesafen Timing Study.
No trends were detected for all other parameters evaluated. However, differences in rice height 14 DAT and rough rice yield were detected using ANOVA (Table 5). Rice height 14 DAT was 95% of that of nontreated control following fomesafen exposure VEPOST; however, height ranged from 98% to 103% of the nontreated control following other timings (Table 5). Rough rice yield was reduced to 7,950 kg ha−1 following fomesafen applied at the PD stage compared to 8,550 kg ha−1 with no exposure to fomesafen (Table 5). However, rough rice yield following application at the PD stage was comparable to that following EPOST, MPOST, and PFLD timings (Table 5). Rice in plots exposed to fomesafen VEPOST produced comparable yields to those treated EPOST or with no exposure to fomesafen (Table 5). Similarly, Sperry et al. (Reference Sperry, Lawrence, Bond and Reynolds2019) reported a 10% decrease in corn yield from fomesafen applied at 35 g ha−1 to corn at the V7 and V9 growth stages compared with fomesafen applied PRE.
Table 5. Rice height 14 d after treatment and rough rice yield following exposure to fomesafen at 39 g ai ha−1 in the Fomesafen Timing Study. a

a. Data for height are pooled over six site-years, and data for rough rice yield are pooled over five site-years. Means followed by the same letter for each parameter are not different at P ≤ 0.05.
b Application timings include spiking to one-leaf (VEPOST), two- to three- leaf (EPOST), three- to four-leaf (MPOST), 7 d postflood (7DPFLD), and panicle differentiation (PD).
Cloransulam-Methyl Timing Study
For all cloransulam-methyl applications, a quadratic trend was detected for rice foliar injury across all evaluation intervals and for panicle density (Tables 2 and 6). Additionally, a linear trend was detected in root injury at 21 DAT (Table 6). Greater rice foliar injury occurred with VEPOST and EPOST timings compared with injury at MPOST and postflood timings. At 3 DAT, foliar injury for both VEPOST and EPOST timings was 8% and 9%, respectively (Figure 5). By 28 DAT, foliar injury for VEPOST and EPOST timings was ≥41%. Rice foliar injury was lower following exposure to cloransulam-methyl from MPOST through PD compared with that following VEPOST and EPOST timings (Figure 5). Foliar injury from cloransulam-methyl MPOST timings was maximized at 25% 21 DAT and decreased to 22% by 28 DAT. A similar trend in foliar injury was observed when cloransulam-methyl was applied at PFLD and PD timings. Webster et al. (Reference Webster, Hensley, Blouin, Harrell and Bond2016) observed 25% to 36% rice injury following exposure to a sublethal rate of imazamox, which is also an ALS-inhibiting herbicide. Applications of cloransulam-methyl had the least impact on rice foliar injury when applied at PD (Figure 5). Additionally, rice foliar injury at 21 DAT was 5% to 14% when imazamox was applied at a reduced rate to rice at PD and before panicle exertion (boot) growth stages (Webster et al. Reference Webster, Hensley, Blouin, Harrell and Bond2016). Rice height was 93% of the nontreated control following cloransulam-methyl use at PD, and dry weight, rough rice yield, and seeds per panicle were comparable to those of the nontreated (Table 7).
Table 6. Regression coefficients for rice root injury 21 d after treatment and panicle density at maturity following exposure to cloransulam-methyl at 3.5 g ai ha−1 in the Cloransulam-methyl Timing Study. a

a Data are pooled across three site-years.
b Application timings include spiking to one-leaf (VEPOST), two- to three- leaf (EPOST), three- to four-leaf (MPOST), 7 d postflood (PFLD), and panicle differentiation (PD).

Figure 5. Rice foliar injury following exposure to cloransulam-methyl at 3.5 g ai ha−1 in the Cloransulam-methyl Timing Study.
Table 7. Rice height 14 d after treatment, dry weight at maturity, rough rice yield, and seeds per panicle following exposure to cloransulam-methyl at 3.5 g ai ha−1 in the Cloransulam-methyl Timing Study. a

a Data are pooled over three site-years for height, and data are pooled over two site-years for dry weight, rough rice yield, and seeds per panicle. Means followed by the same letter for each parameter are not different at P ≤ 0.05.
b Application timings include spiking to one-leaf (VEPOST), two- to three- leaf (EPOST), three- to four-leaf (MPOST), 7 d postflood (7DPFLD), and panicle differentiation (PD).
Rice exposed to cloransulam-methyl EPOST exhibited the greatest root injury at 21 DAT, and height was reduced to 64% of the nontreated (Table 7; Figure 6). Additionally, cloransulam-methyl applied EPOST reduced dry weight to 1,530 g m−2 compared with 1,770 g m−2 by the nontreated, and rough rice yield was reduced to 6,540 kg ha−1 compared with 7,850 kg ha−1 by the nontreated (Table 7). Webster et al. (Reference Webster, Hensley, Blouin, Harrell and Bond2016) suggested that rice is more sensitive to a sublethal dose of an ALS-inhibiting herbicide during early vegetative growth stages. Data from the current research indicate a similar finding. Greater rice root and foliar injury, and greatest reduction in rough rice yield occurred with cloransulam-methyl applied VEPOST and EPOST compared with later timings. Although seeds per panicle were reduced to 55 seeds per panicle with PFLD timing compared with 77 seeds per panicle for the nontreated, no reductions were detected in yield (rough, whole, and total milled) or dry weight (Table 7). However, based on the quadratic trend for panicle density, applications in the PFLD range of DAE indicated an increased number of panicles compared with that from the nontreated control plants (Figure 6).

Figure 6. Rice root injury (A) 21 d after treatment and panicle density per square meter (B) following exposure to cloransulam-methyl at 3.5 g ai ha−1 in the Cloransulam-methyl Timing Study.
The current research demonstrates that rice is sensitive to a sublethal concentration of paraquat. Early-season injury to rice following exposure to paraquat had less effect on rough rice yield compared with injury occurring at later developmental stages. However, harvest efficiency could be affected regardless of growth stage at which exposure occurred due to delays in maturity. Additionally, fields devoted to seed rice production are at risk for reduced seed germination if they are exposed to paraquat during early reproductive growth stages.
Although injury occurred following rice exposure to metribuzin, no impact on yield was detected. Rice injury 28 DAT following exposure to fomesafen ranged from 2% to 5%, but fomesafen applied at PFLD and PD timings reduced yields compared to the nontreated VEPOST and EPOST timings. Cloransulam-methyl caused greater rice injury when it was used at exposure before flooding compared with postflood timings. Additionally, rough rice yield was reduced more following exposure to cloransulam-methyl at VEPOST than all other application timings. The current research complements findings by Webster et al. (Reference Webster, Hensley, Blouin, Harrell and Bond2016) who reported early-season exposure to an ALS-inhibiting herbicide at a reduced rate impacted rice yield more than any other timing.
These data indicate that application timing can have an impact on rice growth and development following exposure to a sublethal concentration of nontarget herbicides. In Mississippi, application of herbicides for preplant weed control in corn, cotton, and soybean can occur across a broad range of dates when rice can be in different developmental growth stages. Additionally, rice in Mississippi is often grown in proximity to corn, cotton, and soybean. In the current research, three of the four herbicide MOAs negatively impacted rough rice yield depending on application timing. Therefore, it is crucial that if environmental conditions are conducive for off-target herbicide movement, extreme caution should be exercised when applying herbicides in close proximity to rice.
Acknowledgments
This publication is a contribution of the Mississippi Agricultural and Forestry Experiment Station. Material is based on work supported by the U.S. Department of Agriculture–National Institute of Food and Agriculture through the Hatch project, accession number 199080. We thank the Mississippi Rice Promotion Board for partially funding this research. We also thank personnel at the Mississippi State University Delta Research and Extension Center for their assistance. No conflicts of interest have been declared.


