


Introduction
Rice production in Mississippi occurs in the northwestern portion of Mississippi within the floodplain of the Mississippi and Yazoo rivers because of the region’s clay-textured soils, environment, and water availability (Buehring Reference Buehring2008; Miller and Street Reference Miller and Street2008). In 2018, rice producers harvested 56,275 ha, with production in Bolivar, Sunflower, Tunica, Quitman, and Washington counties accounting for approximately 73% of Mississippi rice hectares (USDA-NASS 2018). In these primary rice-producing counties, land area devoted to rice production makes up only 6.25% of row crop hectarage (USDA-NASS 2018).
Glyphosate-resistant (GR) corn (Zea mays L.), cotton (Gossypium hirsutum L.), and soybean [Glycine max (L.) Merr.] cropping systems revolutionized weed control after their introduction two decades ago (Edwards Reference Edwards2013; Owen Reference Owen2000). However, since the introduction of GR cropping technologies, GR weed biotypes have evolved rapidly (Heap Reference Heap2019). In GR cropping systems, paraquat applied in mixtures with residual herbicides prior to crop emergence offers an alternative herbicide mode of action (MOA) to aid in GR weed management (Bond et al. Reference Bond, Lawrence, Bararpour, Dodds, Golden, Irby, Larson and Reynolds2018). Palmer amaranth [Amaranthus palmeri (S.) Watts] is the most troublesome weed in corn, cotton, and soybean because of its evolution of resistance to multiple herbicide MOAs, prolific seed production, and genetic diversity (Ward et al. Reference Ward, Webster and Steckel2013; Webster Reference Webster2012, Reference Webster2013). Research has demonstrated that the most effective control methods for GR Palmer amaranth utilize preventative strategies (Culpepper et al. Reference Culpepper, Webster, Sosnoskie and York2010). Residual herbicides are commonly recommended PRE for Palmer amaranth suppression prior to crop emergence (Bond et al. Reference Bond, Lawrence, Bararpour, Dodds, Golden, Irby, Larson and Reynolds2018).
Paraquat is a nonselective, broad-spectrum, POST herbicide that inhibits the flow of electrons in photosystem I (PSI) in susceptible plants (Shaner Reference Shaner2014). Paraquat is labeled preplant, PRE, or POST-directed for nonselective weed control in corn, cotton, grain sorghum [Sorghum bicolor (L.) Moench], peanut (Arachis hypogaea L.), soybean, and numerous vegetable and fruit crops (Anonymous 2019; Shaner Reference Shaner2014). However, paraquat is only labeled preplant or PRE in rice (Anonymous 2019; Bond et al. Reference Bond, Lawrence, Bararpour, Dodds, Golden, Irby, Larson and Reynolds2018).
Early-season rice stressors can consist of factors such as pests feeding, suboptimal temperatures, and herbicide drift (Walker et al. Reference Walker, Bond, Ottis and Harrell2008). In Mississippi, rice is ideally seeded between April 1 and May 20, with emergence soon thereafter, and these dates often coincide with preplant and/or PRE herbicide applications to corn, cotton, and soybean (Buehring Reference Buehring2008). Visible injury symptoms from off-target herbicide movement may vary based on herbicide MOA and may not always be indicative of total damage to rice (Davis et al. Reference Davis, Scott, Norsworthy and Gbur2011; Ellis et al. Reference Ellis, Griffin, Linscombe and Webster2003; Kurtz and Street Reference Kurtz and Street2003). Severe negative implications on rice growth and development following off-target movement of imazethapyr, imazethapyr plus imazapyr, imazamox, glufosinate, or glyphosate have been reported (Bond et al. Reference Bond, Griffin, Ellis, Linscombe and Williams2006; Davis et al. Reference Davis, Scott, Norsworthy and Gbur2011; Ellis et al. Reference Ellis, Griffin, Linscombe and Webster2003; Hensley et al. Reference Hensley, Webster, Blouin, Harrell and Bond2012; Kurtz and Street Reference Kurtz and Street2003; Webster et al. Reference Webster, Hensley, Blouin, Harrell and Bond2015, Reference Webster, Hensley, Blouin, Harrell and Bond2016). However, severity of injury can vary with herbicide rate, formulation, and carrier volume (Bond et al. Reference Bond, Griffin, Ellis, Linscombe and Williams2006; Davis et al. Reference Davis, Scott, Norsworthy and Gbur2011; Hensley et al. Reference Hensley, Webster, Blouin, Harrell and Bond2012; Webster et al. Reference Webster, Hensley, Blouin, Harrell and Bond2015). Webster et al. (Reference Webster, Hensley, Blouin, Harrell and Bond2015) reported the greatest rice injury from a sublethal rate of glufosinate applied during late reproductive development was 24% 7 DAT. Glufosinate applied to rice at 31 and 62 g ha–1 during late reproductive development reduced yield more than with any other application timing (Webster et al. Reference Webster, Hensley, Blouin, Harrell and Bond2015). Kurtz and Street (Reference Kurtz and Street2003) reported that glyphosate applied at 140 g ae ha–1 during late reproductive development injured rice ≤5%; however, yield was reduced ≥63% in 3 of 4 yr.
Two techniques for evaluating the effects of off-target herbicide movement are use of various or constant carrier volume (Banks and Schroeder Reference Banks and Schroeder2002; Davis et al. Reference Davis, Scott, Norsworthy and Gbur2011; Ellis et al Reference Ellis, Griffin and Jones2002; Roider et al. Reference Roider, Griffin, Harrison and Jones2008; Webster et al. Reference Webster, Hensley, Blouin, Harrell and Bond2015). When off-target movement is tested utilizing various carrier volumes, the herbicide rate is reduced in proportion to a specified spray volume; alternately, when testing with a constant carrier volume, a series of reduced herbicide rates are applied in a single carrier volume (Davis et al. Reference Davis, Scott, Norsworthy and Gbur2011; Hensley et al. Reference Hensley, Webster, Blouin, Harrell and Bond2012). Both techniques are accepted to test the effects off-target herbicide movement to sensitive plant species, but inconsistent results are possible (Ellis et al. Reference Ellis, Griffin and Jones2002; Roider et al. Reference Roider, Griffin, Harrison and Jones2008). Injury to wheat (Triticum aestivum L.) was 23% less when a systemic herbicide was applied in constant carrier volume compared with proportional carrier volume (Roider et al. Reference Roider, Griffin, Harrison and Jones2008). Other research suggests no difference between techniques regardless of herbicide type when applied to soybean (Ellis et al. Reference Ellis, Griffin and Jones2002).
Extensive university research has documented the effects on rice growth and development from glyphosate, glufosinate, and acetolactate synthase–inhibiting herbicides applied at sublethal rates (Bond et al. Reference Bond, Griffin, Ellis, Linscombe and Williams2006; Davis et al. Reference Davis, Scott, Norsworthy and Gbur2011; Ellis et al. Reference Ellis, Griffin, Linscombe and Webster2003; Hensley et al. Reference Hensley, Webster, Blouin, Harrell and Bond2012; Webster et al. Reference Webster, Hensley, Blouin, Harrell and Bond2015, Reference Webster, Hensley, Blouin, Harrell and Bond2016). However, no data have been published on rice response following exposure to a sublethal concentration of paraquat alone or in combination with residual herbicides representing different MOAs. Therefore, research was conducted to characterize rice response to a sublethal concentration of paraquat in combination with common residual herbicides.
Materials and Methods
Two separate herbicide mixture studies (paraquat, fomesafen, and metribuzin mixture study and residual herbicide mixture study) to characterize rice response to a sublethal concentration of paraquat applied alone or in combination with common residual herbicides were conducted from 2015 to 2017 at the Mississippi State University Delta Research and Extension Center in Stoneville, MS. Global positioning system coordinates, soil series, soil description, previous crop history, soil pH, and soil organic matter (OM) for both studies are provided in Table 1.
Table 1. Coordinates, soil series, soil description, previous crops, soil pH, and soil organic matter (OM) for the paraquat, metribuzin, and fomesafen mixture study and the residual herbicide study in Stoneville, MS, from 2015 to 2017.

Glyphosate (Roundup PowerMax 4.5 L, 1,120 g ha–1; Monsanto Co., St. Louis, MO), paraquat (Gramoxone 2.0 SL, 560 g ha–1; Syngenta Crop Protection, Greensboro, NC), and/or 2,4-D (2,4-D Amine 3.8 SL, 560 g ae ha–1; Agri Star, Ankeny, IA) were applied in late March to early April each site-year to control emerged vegetation. Clomazone (Command 3 ME, 498 g ai ha–1; FMC Corp., Philadelphia, PA) plus saflufenacil (Sharpen 2.85 SC, 4.5 g ai ha–1; BASF Crop Protection, Research Triangle Park, NC) was applied PRE each site-year for residual weed control. Fenoxaprop-p-ethyl (Ricestar HT 0.58 EC, 1,949 g ai ha–1; Bayer CropScience, Research Triangle Park, NC) plus quinclorac (Facet 1.50 SL, 375 g ai ha–1; BASF Crop Protection, Research Triangle Park, NC) plus halosulfuron (Permit 75 DF, 12 g ai ha–1; Gowan Company, Yuma, AZ) plus petroleum oil surfactant (Herbimax, 83% petroleum oil; Loveland Products, Greeley, CO) at 1% (v/v) was applied at two- to three-leaf rice early POST (EPOST) to maintain experimental sites weed free.
Rice was drill-seeded on June 9, 2015, on May 11 and 17, 2016, and on May 9 and 18, 2017 to a depth of 2 cm using a small-plot grain drill (Great Plains 1520; Great Plains Mfg., Inc., Salina, KS). Rice cultivar, ‘CL151’ (HorizonAg, Memphis, TN) was seeded at 83 kg ha–1 (356 seed m–2) all site-years. Treated plots contained eight rows of rice spaced 20 cm apart and were 4.6 m in length. Treated plots were bordered on either end by a 1.5-m fallow alley that contained no rice and on each side by identically sized buffer plots included to minimize treatment contamination. In all studies, nitrogen (N) fertilizer was applied at 168 kg ha–1 as urea (Urea 46-00-00, SouthernGRO Fertilizer, 46-0-0; J&J Bagging, Yazoo City, MS) immediately prior to flood establishment (Norman et al. Reference Norman, Slaton, Roberts and Hardke2013). Plots were flooded to an approximate depth of 6 to 10 cm when rice reached the one- to two-tiller stage. Rice in all studies was managed throughout the growing season to optimize yield (Buehring Reference Buehring2008).
All herbicide treatments in the paraquat, fomesafen, and metribuzin mixture study, and in the residual herbicide mixture study were applied at a sublethal concentration of 10% of their suggested use rate in Mississippi (Al-Khatib and Peterson Reference Al-Khatib and Peterson1999; Bond et al. Reference Bond, Lawrence, Bararpour, Dodds, Golden, Irby, Larson and Reynolds2018) using a CO2-pressurized backpack sprayer equipped with flat-fan nozzles (AIRMIX 11002; Greenleaf Technologies, Covington, LA) set to deliver 140 L ha–1 at 206 kPa using water as a carrier. All herbicide treatments included NIS (Activator 90, 90% non-ionic surfactant; Loveland Products, Greeley, CO) at 0.5% (v/v) and ammonium sulfate water-conditioning agent (Class Act NG, 50% nitrogen fertilizer; WinField Solutions, St. Paul, MN) at 2.5% (v/v).
Paraquat, Fomesafen, and Metribuzin Mixture Study
A study conducted from 2015 to 2017 in Stoneville, MS, evaluated rice performance following exposure to a sublethal concentration of paraquat applied alone or in mixture with a sublethal concentration of metribuzin or fomesafen. Treatments were arranged as a two-factor factorial within a randomized complete block design with four replications. Factor A was paraquat rate and consisted of paraquat at 0 and 84 g ha–1. Factor B was companion herbicide and consisted of no companion herbicide, metribuzin (Tricor 75DF, herbicide; United Phosphorus Inc., King of Prussia, PA) at 42 g ai ha–1, and fomesafen (Reflex 2L, herbicide; Syngenta Crop Protection, Greensboro, NC) at 39 g ai ha–1. Herbicide treatments were applied to rice in the two- to three-leaf stage (EPOST). Visible estimates of aboveground rice injury were recorded 3, 21, and 28 DAT on a scale of 0 to 100% where 0 indicated no visible effect of herbicides and 100 indicated complete plant death. Plant heights were determined 14 DAT by measuring from the soil surface to the uppermost extended leaf and calculating the mean height of five randomly selected plants in each plot. Rice density 14 DAT was determined by counting all emerged plants in two 1-m2 quadrats in each plot. The number of days to 50% heading was recorded as an indication of rice maturity by calculating the time from seedling emergence until 50% of rice plants in an individual plot had visible panicles. Rice dry weight at maturity was determined by hand-harvesting a randomly selected area measuring 1 m from rows 2 or 7 in each plot to determine rice dry weight. Hand-harvested samples were greenhouse-dried at 32 to 49 (± 5) C for 2 wk. Samples were then weighed to determine rice dry weight, and weights were converted to g m–2.
The remaining area in each plot was harvested with a small-plot combine (Wintersteiger Delta; Wintersteiger, Inc., Salt Lake City, UT) at a moisture content of approximately 20% to determine rough rice yield after all subsamples had been collected. Grain weights and moisture contents were recorded, and rough rice yield was adjusted to a uniform moisture content of 12% for statistical analysis. Whole and total milled rice yield were determined from cleaned 120-g subsamples of rough rice using the procedure outlined by Adair et al. (Reference Adair, Bollich, Bowman, Jordon, Johnson, Webb and Atkins1972). Rice was mechanically hulled and milled in a Grainman No. 2 miller (Grain Machinery Manufacturing Corp., Miami, FL) for 30 s and size-separated with a No. 12 4.76-mm screen.
All data were subjected to ANOVA using the PROC MIXED procedure in SAS (Statistical software release 9.3; SAS Institute Inc., Cary, NC) with site-year and replication (nested within site-year) as random-effect parameters (Blouin et al. Reference Blouin, Webster and Bond2011). Type III Statistics were used to test the fixed effects of paraquat rate and companion herbicide treatment for rice injury, density, height, number of days to 50% heading, dry weight, and rice yield (rough, whole, and total milled rice). Least square means were calculated, and mean separation (P ≤ 0.05) was produced using PDMIX800 in SAS, which is a macro for converting mean separation output letter groupings (Saxton Reference Saxton1998).
Residual Herbicide Mixture Study
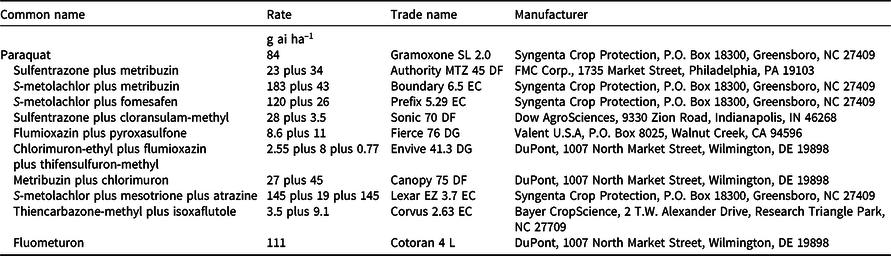
A study was conducted from 2015 to 2017 in Stoneville, MS, to evaluate rice performance following exposure to a sublethal concentration of paraquat applied alone or in combination with 10 residual herbicides commonly utilized in Mississippi (Bond et al. Reference Bond, Lawrence, Bararpour, Dodds, Golden, Irby, Larson and Reynolds2018). The experimental design was a randomized block with four replications. Treatments included paraquat at 84 g ha–1 applied alone or in mixtures with residual herbicides listed in Table 2. A nontreated control was included for comparison. Herbicide treatments were applied at the EPOST rice growth stage. Visual estimates of rice injury, rice density and height 14 DAT, and rice yield (rough, whole, and total milled rice) were collected and analyzed as previously described.
Table 2. Herbicide common and trade names, application concentration, and herbicide manufacturer information for treatments in the residual herbicide study conducted at Stoneville, MS, from 2015 to 2017.
Results and Discussion
Paraquat, Fomesafen, and Metribuzin Mixture Study
An interaction between paraquat rate and companion herbicide was detected for rice injury 3, 14, and 28 DAT, density 14 DAT, and rough rice yield (Table 3). Except for the 3-DAT evaluation, rice injury was greater with paraquat plus metribuzin than all other treatments imposed in the study (Table 3). Metribuzin and fomesafen applied alone injured rice 11% to 13% 3 DAT (Table 3). Rice injury from paraquat alone was 42%; however, this level of injury was less than that observed with paraquat plus fomesafen or metribuzin, which injured rice 46% and 50%, respectively. Rice injury following metribuzin or fomesafen alone was ≤10% 14 and 28 DAT, and the greatest rice injury 14 and 28 DAT occurred with paraquat plus metribuzin (Table 3). Bond et al. (Reference Bond, Golden, Allen and Gore2015) reported that rice injury from fomesafen applied at 25% of the recommended rate was ≤15% regardless of evaluation interval. Paraquat plus metribuzin injured rice 68% and 69% 14 and 28 DAT, respectively, which was at least 10% greater than injury following paraquat alone or in mixture with fomesafen (Table 3).
Table 3. Rice injury 3, 14, and 28 d after treatment (DAT), density 14 DAT, and rough rice yield in the paraquat, metribuzin, and fomesafen mixture study at Stoneville, MS, from 2015 to 2017.a

a Data were pooled over 5 site-years. Means followed by the same letter for each parameter are not different at P ≤ 0.05.
b Herbicide treatments were applied to rice in the two- to three-leaf (EPOST) growth stage.
c Metribuzin was applied at 42 g ai ha–1, and fomesafen was applied at 39 g ai ha–1.
Related research suggests the level of injury observed with paraquat alone at 84 g ha–1 during the EPOST rice growth stage in this study is not uncommon (Lawrence et al. Reference Lawrence, Bond, Golden, Hydrick and Edwards2017). Previously, increases in plant injury and weed control were reported following applications of paraquat plus a photosystem II (PSII)–inhibiting herbicide (Eubank et al. Reference Eubank, Poston, Nandula, Koger, Shaw and Reynolds2008; Norsworthy et al. Reference Norsworthy, Smith and Griffith2011). Eubank et al. (Reference Eubank, Poston, Nandula, Koger, Shaw and Reynolds2008) reported control of GR horseweed [Conyza canadensis (L.) Cronq.] improved to 94% with the addition of metribuzin to paraquat compared to 55% control with paraquat alone. Additionally, Norsworthy et al. (Reference Norsworthy, Smith and Griffith2011) reported failed corn stand control was 97% when paraquat was applied in mixture with a PSII-inhibiting herbicide compared to 79% control with paraquat alone.
Rice density ranged from 276 to 282 m–2 for all treatments with no paraquat (Table 3). Paraquat alone reduced density to 233 plants m–2 compared with 276 plants m–2 where no paraquat or companion herbicide was applied. The greatest reduction in rice density 14 DAT was observed following applications of paraquat plus metribuzin (Table 3). Similarly, in weed control studies paraquat alone reduced GR horseweed densities to 15 plants m–2 compared to 24 plants m–2; however, paraquat plus metribuzin reduced GR horseweed to 1 plant m–2 (Eubank et al. Reference Eubank, Poston, Nandula, Koger, Shaw and Reynolds2008). Rice density following paraquat plus metribuzin was reduced 30% and 31% compared with that following metribuzin or paraquat alone, respectively (Table 3).
A main effect of paraquat rate was detected for rice height 14 DAT, days to 50% heading, dry weight at maturity, and total and whole milled rice yield (Table 4). Averaged across three companion herbicide treatments, rice height 14 DAT was reduced 45%, maturity was delayed 9 d, and dry weight was reduced 17% following paraquat at 84 g ha–1 (Table 4). Similar reductions in rice height and increased days to 50% heading following rice exposure to a sublethal concentration of paraquat EPOST were reported by Lawrence et al. (Reference Lawrence, Bond, Golden, Hydrick and Edwards2017). Total and whole milled rice yield was 70% and 60%, respectively, where no paraquat was applied (Table 4). However, following exposure to paraquat at 84 g ha–1, total and whole milled rice yield was reduced to 67% and 56%, respectively (Table 4).
Table 4. Influence of paraquat rate on rice plant height 14 d after treatment (DAT), days to 50% heading expressed as days after emergence (DAE), dry weight at maturity, and total and whole milled rice yield in the paraquat, metribuzin, and fomesafen mixture study at Stoneville, MS, from 2015 to 2017.a

a Data were pooled over three companion herbicide treatments (no companion herbicide, metribuzin at 42 g ai ha–1, and fomesafen at 39 g ai ha–1), and 5 site-years for rice plant height and days to 50% heading, and 6 site-years for dry weight at maturity, total and whole milled rice yield. Means followed by the same letter for each parameter are not different at P ≤ 0.05.
Rough rice yield was similar following treatments that did not include paraquat (Table 3). However, rough rice yield was reduced 23% following paraquat at 84 g ha–1 compared with yield of rice not exposed to paraquat or the companion herbicide treatments. Sperry et al. (Reference Sperry, Lawrence, Bond and Reynolds2019) concluded that, although visual injury was observed following corn exposure to a sublethal rate of fomesafen, corn yield was unaffected. Complementing research reporting improved control of corn and GR horseweed with paraquat plus a PSII-inhibiting herbicide (Eubank et al. Reference Eubank, Poston, Nandula, Koger, Shaw and Reynolds2008; Norsworthy et al. Reference Norsworthy, Smith and Griffith2011), the greatest reduction in rough rice yield was observed following paraquat plus metribuzin. Rough rice yield was comparable following paraquat alone and paraquat plus fomesafen (Table 3). However, paraquat plus metribuzin reduced rough rice yield to 5,140 kg ha–1 from 7,800 kg ha–1 where no herbicide was applied, and from 5,990 kg ha–1 following paraquat applied alone (Table 3). Previous research evaluating whether altering N fertilizer aids rice recovery from exposure to a sublethal rate of paraquat found rough rice yield losses of 56% to 58% with paraquat alone (Lawrence et al. Reference Lawrence, Bond, Golden, Hydrick and Edwards2017).
Residual Herbicide Mixture Study
Rice injury was maximized at 64% 14 DAT with a mixture of paraquat with S-metolachlor plus mesotrione plus atrazine, and this level of injury was comparable with that following paraquat in mixtures with fluometuron (59%), sulfentrazone plus metribuzin (61%), or S-metolachlor plus metribuzin (62%) (Table 5). Woodyard et al. (Reference Woodyard, Bollero and Riechers2009) reported a synergistic effect on weed control when mesotrione and atrazine were applied in mixture. Common lambsquarters (Chenopodium album L.) control 30 DAT ranged from 52% to 60% following mesotrione alone at 105 g ha–1, and control increased to ≥98% for mesotrione plus atrazine at 280 g ha –1. Chlorimuron-ethyl plus flumioxazin plus thifensulfuron-methyl injured rice 53% 14 DAT, and that injury level was similar to that following fluometuron (59%), metribuzin plus chlorimuron (55%), thiencarbazone-methyl plus isoxaflutole (52%), and sulfentrazone plus cloransulam-methyl (51%). S-metolachlor plus fomesafen injured rice 47% 14 DAT, which was similar to flumioxazin plus pyroxasulfone (48%) and paraquat alone (no mixture; 49%). Rice injury with paraquat alone (no mixture) was comparable to that from flumioxazin plus pyroxasulfone, sulfentrazone plus cloransulam-methyl, and thiencarbazone-methyl plus isoxaflutole (Table 5).
Table 5. Rice injury 3, 14, and 28 d after treatment (DAT), plant height and density 14 DAT, and rough rice yield in the residual herbicide study at Stoneville, MS, from 2015 to 2017. a

a Data were pooled over 5 site-years. Means followed by the same letter for each parameter are not different at P ≤ 0.05.
b All treatments except the nontreated contained paraquat at 84 g ai ha–1.
c All herbicides were applied at 10% of the recommended use rate in Mississippi.
Rice injury 28 DAT was 73% following exposure to a mixture of paraquat with S-metolachlor plus mesotrione plus atrazine (Table 5). S-metolachlor plus metribuzin (65%), sulfentrazone plus metribuzin (65%), metribuzin plus chlorimuron (64%), fluometuron (63%), thiencarbazone-methyl plus isoxaflutole (63%), and chlorimuron-ethyl plus flumioxazin plus thifensulfuron-methyl (60%) produced similar levels of rice injury 28 DAT. Palhano et al. (Reference Palhano, Norsworthy and Barber2018) reported an increase in wheat control with paraquat plus metribuzin compared with paraquat alone. Flumioxazin plus pyroxasulfone and S-metolachlor plus fomesafen injured rice 51% 28 DAT, which was less than all other treatments. However, this treatment caused injury comparable to that following sulfentrazone plus cloransulam-methyl (58%), paraquat alone (no mixture; 56%), and S-metolachlor plus fomesafen (56%). Rice injury with paraquat alone (no mixture), thiencarbazone-methyl plus isoxaflutole, chlorimuron-ethyl plus flumioxazin plus thifensulfuron-methyl, sulfentrazone plus cloransulam-methyl, S-metolachlor plus fomesafen were similar 28 DAT (Table 5). Armel et al. (Reference Armel, Richardson, Wilson and Hines2009) reported that annual bluegrass (Poa annua L.) control 3 wk after treatment (WAT) was 57% to 84% following applications of mesotrione at 0.16 kg ha–1; however, control was increased to 99% when mesotrione was applied in mixture with paraquat plus acetochlor. A similar response was detected in the current work, in which greater rice injury was observed with the addition of a 4-hydroxyphenylpyruvate dioxygenase (HPPD)–inhibiting herbicide to paraquat mixtures at the 10% recommended use rate (Table 5).
Rice height and density 14 DAT and rough rice yield were reduced with all treatments compared to the nontreated control (Table 5). Rice density 14 DAT following S-metolachlor plus fomesafen was 334 plants m–2, which was comparable to densities in the nontreated and following paraquat alone (no mixture), flumioxazin plus pyroxasulfone, metribuzin plus chlorimuron, thiencarbazone-methyl plus isoxaflutole, and chlorimuron-ethyl plus flumioxazin plus thifensulfuron-methyl. S-metolachlor plus mesotrione plus atrazine reduced rice density to 262 plants m–2, and this was similar to all herbicide treatments except S-metolachlor plus fomesafen, flumioxazin plus pyroxasulfone, metribuzin plus chlorimuron, and paraquat alone (no mixture; Table 5).
Rough rice yield was 5,000 to 6,290 kg ha–1 in all treated plots, and this was 38% and 22% lower than in the nontreated, respectively (Table 5). Sperry et al. (Reference Sperry, Lawrence, Bond and Reynolds2019) reported that paraquat at 105 g ha–1 reduced corn yield 25 kg d–1 if exposure occurred during vegetative growth. Based on these data, it is plausible to expect greater reductions in rice yield as multiple MOAs are added to herbicide mixtures containing paraquat. Previous research confirmed increased levels of weed control when a PSII-inhibiting herbicides are applied together or in mixture with paraquat (Norsworthy et al. Reference Norsworthy, Smith and Griffith2011; Palhano et al. Reference Palhano, Norsworthy and Barber2018). The greatest rough rice yield reductions in the current research were following metribuzin plus chlorimuron (5,150 kg ha–1), S-metolachlor plus metribuzin (5,100 kg ha–1), S-metolachlor plus mesotrione plus atrazine (5,000 kg ha–1), and fluometuron (5,050 kg ha–1). However, rough rice yields following these treatments were comparable to those following sulfentrazone plus metribuzin (5,220 kg ha–1) and thiencarbazone-methyl plus isoxaflutole (5,550 kg ha–1). Rough rice yield reductions following sulfentrazone plus cloransulam-methyl were similar to that from chlorimuron-ethyl plus flumioxazin plus thifensulfuron-methyl (6,290 kg ha–1), paraquat alone (no mixture; 6,080 kg ha–1), flumioxazin plus pyroxasulfone (6,190 kg ha–1), S-metolachlor plus fomesafen (6,090 kg ha–1), and thiencarbazone-methyl plus isoxaflutole (5,550 kg ha–1).
Based on these data, negative effects on rice growth and development can occur following exposure to a sublethal concentration of paraquat applied alone or in mixture with residual herbicides. The current research indicates that, although degrees of severity in rice injury vary across herbicide mixtures, paraquat alone or in combination with nontarget herbicides can have a detrimental effect on rough rice yield. The greatest levels of injury occurred with paraquat plus a PSII-inhibiting herbicide, and rough rice yield was reduced the greatest following applications of paraquat plus a PSII- plus HPPD-inhibiting herbicide. In the current research, rice never recovered from paraquat exposure at EPOST at 10% of the recommended use rate. Additionally, previous research by Lawrence et al. (Reference Lawrence, Bond, Golden, Hydrick and Edwards2017) indicated that adding starter N or altering N fertilizer strategies did not aid rice recovery from injury from exposure to a sublethal concentration of paraquat. These data indicate that additional herbicide MOAs can affect rice injury and induce rough rice yield losses. Because of the extent of rice injury from paraquat alone, diagnosing symptoms of an individual herbicide MOA that may have been in mixture with paraquat would be challenging. In cases of off-target herbicide movement, herbicide concentrations and MOAs are rarely known. Therefore, in conditions conducive for off-target herbicide movement, caution should be exercised when making applications adjacent to fields devoted to rice production.
Acknowledgments
This publication is a contribution of the Mississippi Agricultural and Forestry Experiment Station. Material is based on work supported by the National Institute of Food and Agriculture, U.S. Department of Agriculture, Hatch project under accession number 199080. The authors would like to thank the Mississippi Rice Promotion Board for partially funding this research. We thank personnel at the Mississippi State University Delta Research and Extension Center for their assistance. No conflicts of interest have been declared.


