


Palmer amaranth is the most troublesome weed species of crop production in the southern United States (Norsworthy et al. Reference Norsworthy, Smith, Scott and Gbur2007, Reference Norsworthy, Bond and Scott2013; Riar et al. Reference Riar, Norsworthy, Steckel, Stephenson, Eubanks and Scott2013a,Reference Riar, Norsworthy, Steckel, Stephenson and Bondb). Its weediness in crops is partly a result of (i) rapid growth, (ii) extensive genetic diversity, (iii) rapid herbicide resistance evolution given the potential for multiple cohorts in a growing season, and (iv) adaptation to poor growing environments (Ward et al. Reference Ward, Webster and Steckel2013). Palmer amaranth exhibits widespread resistance to glyphosate, acetolactate synthase (ALS)- and protoporphyrinogen oxidase (PPO)-inhibiting herbicides, and triazines (Ward et al. Reference Ward, Webster and Steckel2013; Salas et al. Reference Salas, Burgos, Tranel, Singh, Glasgow, Scoot and Nichols2016), earning it a reputation of one of the most challenging herbicide-resistant weeds. As a result, Palmer amaranth is responsible for large losses to cotton (Gossypium hirsutum, corn (Zea mays L.), and soybean (Glycine max L. Merr.) production in the southern and midwestern United States (Webster and Nichols Reference Webster and Nichols2012; Jhala et al. Reference Jhala, Sandell, Rana, Kruger and Knezevic2014). Even a few uncontrolled escapes will lead to long-term management concerns, as one female Palmer amaranth plant may produce nearly 600,000 seeds (Keeley et al. Reference Keeley, Carter and Thullen1987), which can lead to a severe infestation of Palmar amaranth within 3 years of a single plant escaping control (Norsworthy et al. Reference Norsworthy, Griffith, Griffin, Bagavathiannan and Gbur2014). Palmer amaranth may lower yield by up to 68% in soybean at weed density of 10 plants m–1 of row (Klingaman and Oliver Reference Klingaman and Oliver1994), more than 50% in cotton at weed density of 1.1 plants m–1 of row (Morgan et al. Reference Morgan, Bauman and Chandler2001), and up to 91% in corn at weed density of 8 plants m–1 of row (Massinga et al. Reference Massinga, Currie, Horak and Boyer2001). As such, not only chemical weed management costs but also tillage and hand weeding have added an extra $12 to $371 ha–1 to the cost of production (Riar et al. Reference Riar, Norsworthy, Steckel, Stephenson and Bond2013b, Sosnoskie and Culpepper Reference Sosnoskie and Culpepper2014), posing a threat to conservation tillage systems (Price et al. Reference Price, Balkcom, Culpepper, Kelton, Nichols and Schomberg2011) despite their economic viability (Popp et al. Reference Popp, Keisling, Dillon and Manning2001; DeVore et al. Reference DeVore, Norsworthy and Brye2013).
The first documented incidence of glyphosate-resistant Palmer amaranth in the United States occurred in Georgia in 2005 (Culpepper et al. Reference Culpepper, Grey, Vencill, Kichler, Webster, Brown, York, Davis and Hanna2006), and 2006 marked the first Palmer amaranth population with resistance to both glyphosate and the ALS inhibitor, pyrithiobac sodium (Sosnoskie et al. Reference Sosnoskie, Kichler, Wallace and Culpepper2011). A 2012 survey of roadside weed populations in the Mississippi Delta region of Arkansas confirmed approximately 89% and 73% of those Palmer amaranth populations to demonstrate resistance rates of more than 90% to the herbicides pyrithiobac and glyphosate, respectively (Bagavathiannan and Norsworthy Reference Bagavathiannan and Norsworthy2016). Palmer amaranth resistance to other important herbicide groups, such as triazines and 4-hydroxyphenylpyruvate dioxygenase (HPPD) inhibitors, has also been documented in midwestern states (Ward et al. Reference Ward, Webster and Steckel2013; Jhala et al. Reference Jhala, Sandell, Rana, Kruger and Knezevic2014). Therefore, appropriate measures are needed to prevent further loss of herbicide options for controlling Palmer amaranth.
Growers often seek to reduce Palmer amaranth resistance using “reactive” weed control methods to combat herbicide resistance only after occurrence (Mueller et al. Reference Mueller, Mitchell, Young and Culpepper2005; Owen Reference Owen2016). Conversely, a “proactive” approach focuses on prevention of herbicide resistance before onset (Mueller et al. Reference Mueller, Mitchell, Young and Culpepper2005) and promotes diversified management options. “Proactive,” integrated weed management (IWM) strategies might seem in the short run more expensive than a weed management strategy based on a single herbicide; however, such integrated practices are more economical and sustainable in the long run (Mueller et al. Reference Mueller, Mitchell, Young and Culpepper2005). Therefore, IWM techniques that integrate chemical and nonchemical approaches are vital for successful and sustainable Palmer amaranth management that abates the selection pressure imposed by any single management technology (Owen Reference Owen2016). Effectively managing the Palmer amaranth soil seedbank, defined as the number of “reserves of viable seeds” in the soil (Dekker Reference Dekker1999), promises to lower risk of herbicide resistance in simulation models (Neve et al. Reference Neve, Norsworthy, Smith and Zelaya2011; Bagavathiannan and Norsworthy Reference Bagavathiannan and Norsworthy2013). A focus on soil seedbank is a “proactive” method with a long-term focus in comparison to a more common annual economic threshold approach in which the cost of added weed control is compared to its marginal benefit of prevented yield loss in a particular production season (Norris Reference Norris1999; Bagavathiannan and Norsworthy Reference Bagavathiannan and Norsworthy2012). Using an annual economic threshold approach, economically justifiable escapes can lead to increases in the seedbank with attendant elevated risk of resistance evolution (Klingaman and Oliver Reference Klingaman and Oliver1994; Norris Reference Norris1999; Bagavathiannan and Norsworthy Reference Bagavathiannan and Norsworthy2012). A critical requirement is minimizing soil seedbank densities by reducing seed addition from Palmer amaranth escapes through IWM techniques (Bagavathiannan and Norsworthy Reference Bagavathiannan and Norsworthy2012, Norsworthy et al. Reference Norsworthy, Griffith, Griffin, Bagavathiannan and Gbur2014).
Best management practices (BMPs) and innovative management methods that promote the IWM approach to herbicide resistance have been developed as a collective effort between the USDA-APHIS and the Weed Science Society of America (Norsworthy et al. Reference Norsworthy, Ward, Shaw, Llewellyn, Nichols, Webster, Bradley, Frisvold, Powles, Burgos, Witt and Barrett2012). These BMPs often focus on herbicide rotation and timeliness of herbicide use at the recommended label rates in addition to nonchemical approaches such as shallow tillage in the spring, crop rotation, windrow burning of crop residue after soybean harvests, and planting of fall cover crops with or without moldboard plowing (Norsworthy et al. Reference Norsworthy, Ward, Shaw, Llewellyn, Nichols, Webster, Bradley, Frisvold, Powles, Burgos, Witt and Barrett2012; DeVore et al. Reference DeVore, Norsworthy and Brye2013). A survey of crop consultants in Arkansas identified Palmer amaranth resistance management as the top research and education need (Norsworthy et al. Reference Norsworthy, Smith, Scott and Gbur2007). Additionally, two regional surveys conducted in 2011 stressed the need for research and extension efforts to address the problem of herbicide-resistant Palmer amaranth in cotton and soybean in southern states (Riar et al. Reference Riar, Norsworthy, Steckel, Stephenson, Eubanks and Scott2013a,Reference Riar, Norsworthy, Steckel, Stephenson and Bondb). One such survey identified a lack of education on the long-term benefits of BMP adoption as a major constraint (Riar et al. Reference Riar, Norsworthy, Steckel, Stephenson, Eubanks and Scott2013a).
Seedbank modeling that estimates appropriate timing of weed management options based on a weed’s life cycle, combined with information on the economic implications of those options, can provide a solution by equipping producers with the knowledge necessary to make better management decisions (Dekker Reference Dekker1999). Several BMPs for Palmer amaranth management have been researched using simulation modeling (Neve et al. Reference Neve, Norsworthy, Smith and Zelaya2011). However, these efforts were not designed to be used as a decision support software (DSS) tool for practitioners. The need persists for an effective, user-friendly, DSS tool to help extension personnel and educators demonstrate the long-term biological and economic viability of IWM strategies of Palmer amaranth. User options for such a DSS that promotes IWM approaches to Palmer amaranth management (PAM) are demonstrated below. Comparisons of different weed control strategies show long-term effects on soil seedbank, risk of herbicide resistance, and economics as output for user-specified crop production and weed management options.
Model Description
Introduction to PAM
The PAM software was developed to assist cotton, corn, and/or soybean producers and consultants, educators, and extension agents with making IWM choices for effective Palmer amaranth control and thereby promoting long-term economic sustainability (Bagavathiannan et al. Reference Bagavathiannan, Lindsay, Popp and Norsworthy2017, Lindsay et al. Reference Lindsay, Popp, Bagavathiannan and Norsworthy2017). The software and manual are available as a free download from http://agribusiness.uark.edu/decision-support-software.php as of January 11, 2017.
The basic framework for PAM is based on the Ryegrass Integrated Management (RIM) software, developed at the University of Western Australia (AHRI 2013) to assist producers and researchers with management of annual rigid ryegrass (Lolium rigidum Gaudin) in the Western Australian wheat belt (Lacoste and Powles Reference Lacoste and Powles2014, Reference Lacoste and Powles2015, Reference Lacoste and Powles2016). Like the RIM software, PAM utilizes the Microsoft Excel® platform, because most users will be familiar with the software, making PAM a more powerful educational tool, while being user-friendly, and capable of reaching a greater audience (Lacoste and Powles Reference Lacoste and Powles2016). Although Excel® is powerful enough to perform necessary calculations, its toolbars and menu options may distract the end user; therefore, the typical menu bar–driven Excel® options were removed and Visual Basic for Applications (VBA) programming language was used to create a full-screen appearance with more software-like features and visuals within the software platform. To protect the integrity of PAM’s calculations, the software is locked in the execution mode and only input cells and user forms are activated to allow for the selection of user-specific parameter values that correspond to their operations.
PAM consists of three fundamental components: (1) Palmer amaranth population dynamics, (2) weed control management options, and (3) economics. A 10-year planning horizon allows the user to cycle repeatedly through a 3-year crop rotation and allow for long-term modeling of moldboard plowing in the fall.
The population dynamics component of PAM was designed to simulate the life cycle of Palmer amaranth starting with the first cohort of plants emerging in the spring and ending with late-season addition of seed from escapes at the end of the growing season. Estimated are the size of the soil seedbank and aboveground Palmer amaranth plant density at varying stages in a growing season (Bagavathiannan et al. Reference Bagavathiannan, Lindsay, Popp and Norsworthy2017). The software measures expected seed production as a factor of seedling emergence, crop competition, and density dependence. Palmer amaranth typically emerges for an extended period (Jha Reference Jha2008), and the aboveground seedbank population was, consequently, organized into cohorts (Neve et al. Reference Neve, Norsworthy, Smith and Zelaya2011) to characterize crop competitiveness, fecundity levels, and the effects of density dependence on survival, growth, and fecundity of Palmer amaranth (Neve et al. Reference Neve, Norsworthy, Smith and Zelaya2011).
The weed control management options section was designed to allow users to select production practices that directly or indirectly affect weed population dynamics and their potential outcomes on seedbank dispersal and successive seedling emergence. These options include chemical and nonchemical approaches such as timing of herbicide applications, planting date, row spacing, tillage, and cover crops. To estimate these direct and/or indirect effects on weed populations, efficacies were allocated for each production practice based on their effects on overall Palmer amaranth control.
The economic component of PAM was designed to replicate southern US crop production practices, and uses crop budgeting and discounting techniques to determine the overall profitability of Palmer amaranth management strategies (Kay et al. Reference Kay, Edwards and Duffy2015). One key feature of the PAM model is its ability to demonstrate the magnitude of long-term benefits (net present value, NPV) vs. potential short-term losses (ACNR i ). The NPV (Equation 1) represents the sum total of annual net returns over a 10-year planning horizon and is defined as follows:
 $${\rm NPV\,{\equals}\,}\mathop{\sum}\limits_{ {\rm i\,{\equals}\,1}}^{ {\rm 10}} {{{ACNR_{i} } \over {{\rm (1{\plus}}k)^{{\rm i}} }}} $$
where NPV is the sum total of economic returns to crop production over a 10-year period expressed in today’s dollars (Robison and Barry Reference Robison and Barry1996), ACNR i are economic returns to crop production for cotton, corn, or soybean that depend on yield, crop price, and production costs as specified by the user and substantiated by default values using the University of Arkansas Cooperative Extension cost of production estimates (Flanders et al. Reference Flanders, Baker, Barber, Faske, Ginn, Grimes, Hardke, Lawson, Lorenz, Mazzanti, Norton, Robertson and Studebaker2015; Scott et al. Reference Scott, Barber, Boyd, Selden, Norsworthy and Burgos2016), and k is the annual risk-adjusted, real discount (amortization) rate to convert future costs and revenue flows to today’s dollars.
Model Design
The PAM user interface operates several drop-down lists that limit user specifications to a pre-selected group of options to safeguard the integrity of the software. Further, error checking (using conditional formatting) highlights user modifications that may lead to errors. Finally, command buttons guide user input for parameter specifications suited to their current operation or automate reversion to default values. Default parameters pertaining to certain economic calculations, such as expected prices received and yields as well as weed control and other input costs, are based on recommendations provided by University of Arkansas Cooperative Extension Service publications and expert opinion (Flanders et al. Reference Flanders, Baker, Barber, Faske, Ginn, Grimes, Hardke, Lawson, Lorenz, Mazzanti, Norton, Robertson and Studebaker2015; Scott et al. Reference Scott, Barber, Boyd, Selden, Norsworthy and Burgos2016). Other parameter values, related to the ecology and biology of Palmer amaranth, were sourced from literature (Neve et al. Reference Neve, Norsworthy, Smith and Zelaya2011; Ward et al. Reference Ward, Webster and Steckel2013) and/or based on expert opinion and cannot be modified by the user. The model does, however, allow for user modification of input values that vary considerably across locations and by farm.
The software was designed to provide helpful information for the user to make appropriate management decisions. Weed control costs (in US$ ha–1) are the sum of estimated costs for selected crop trait–dependent seed cost as well as herbicide prices and their application charges. Weed control costs also include estimated costs associated with shallow tillage vs. no-till, equipment cost differences for narrow- vs. wide-row planting of soybean, and fall weed management options, including moldboard plowing, windrow burning, and cover cropping. The spring seedbank was estimated as the number of seeds in the soil in the spring. It is presented as thousands of seed per 23 m2 and was calculated by tracking seed production from Palmer amaranth escapes during the previous production year along with possible overwintering seed losses. Seedling emergence does not equal the spring seedbank density for a given year; rather, it is only a portion of the expected total seed in the soil. Yield (ha–1) was calculated as the user-specified expected yield multiplied by the percent reduction in yield as affected by weed density and management practices (Klingaman and Oliver Reference Klingaman and Oliver1994; Morgan et al. Reference Morgan, Bauman and Chandler2001; Massinga et al. Reference Massinga, Currie, Horak and Boyer2001; Ward et al. Reference Ward, Webster and Steckel2013). Net returns (US$ ha-1) were calculated as the product of yield and the expected price received, less the sum of total specified expenses as modified from default values in the ‘Systems’ page and weed control costs for the options selected in the ‘Strategy’ page.
In addition to the measures discussed above, the user can monitor the degree of diversity of weed control options employed within the 10-year rotation as an indirect assessment of risk of resistance evolution as well as the timing of escapes. The resistance risk assessment was evaluated as a percentage using a weighted, 23-parameter model with higher percentage scores indicating a lack of diversity in weed control tactics. Risk assessment parameters are based on expert opinion and include, but are not limited to, seedbank size as well as user-specified parameters, such as crop rotations, crop traits in rotation, diversity of herbicide selections, and fall management options. Certain parameters were assigned a higher weighted value for the first four production years than the remaining years of production because of their impact on soil seedbank size and subsequent increase in the overall risk of resistance within the 10-year period. Further, Palmer amaranth escapes are tracked by cohort and reveal the number of uncontrolled plants at the indicated time during the production season (Bagavathiannan and Norsworthy Reference Bagavathiannan and Norsworthy2012). The number and timing of Palmer amaranth escapes provide additional information to help the user determine appropriate management timing and practices to reduce weed escapes. For example, should escapes be high early in a given year, early-spring herbicide options or fall options employed in the prior year may be most helpful in minimizing escapes.
Discussion
Model Implementation
PAM follows three steps to modify operation parameters and develop multiple IWM strategies for comparison: (1) “define” the system to specify the user’s current operation parameters or use default values; (2) “build” management strategies through the modification of crop production and weed management options; and (3) “compare” side-by-side output results of any two of as many as seven different strategies. The model flow chart provided in Figure 1 was designed to help with understanding the flow of information between the PAM user-interface worksheets, ‘Systems,’ ‘Strategy,’ and ‘Output.’ The worksheets are linked and navigable using VBA programming that allow the user to accept auto-generated default options or make modifications that can be saved for later recall and comparisons.
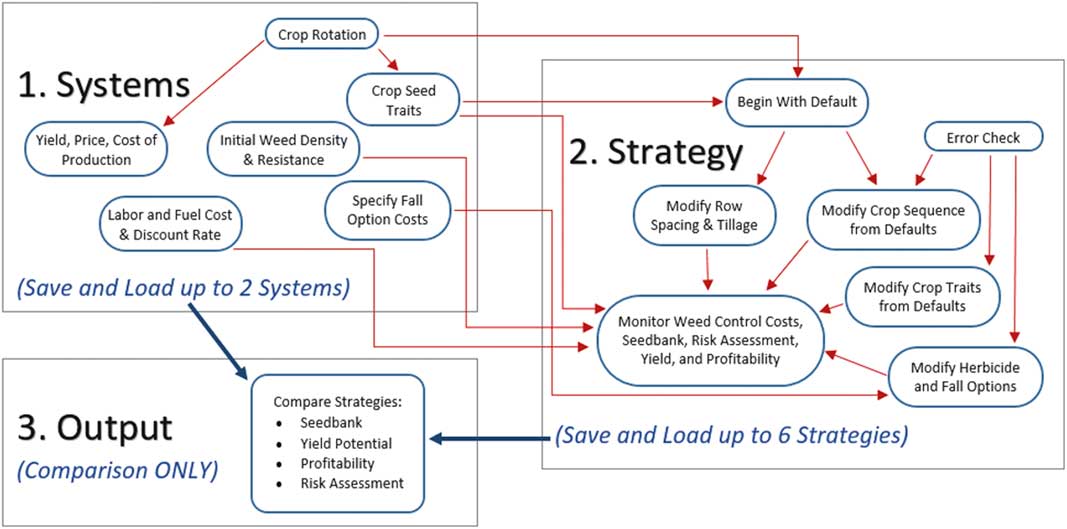
Figure 1 Model flow chart. Source: PAM (Bagavathiannan et al. Reference Bagavathiannan, Lindsay, Popp and Norsworthy2017).
Step 1: Define Production System. When clicking on the ‘START’ command button on the ‘Title’ worksheet, users will be taken to the ‘Define Systems’ worksheet (Figure 2), where they can define and save up to two systems by customizing a set of production variables. Several VBA subroutines auto-generate a default ‘Strategy’ (Figure 3) based on the selections made in the ‘Define Systems’ worksheet.
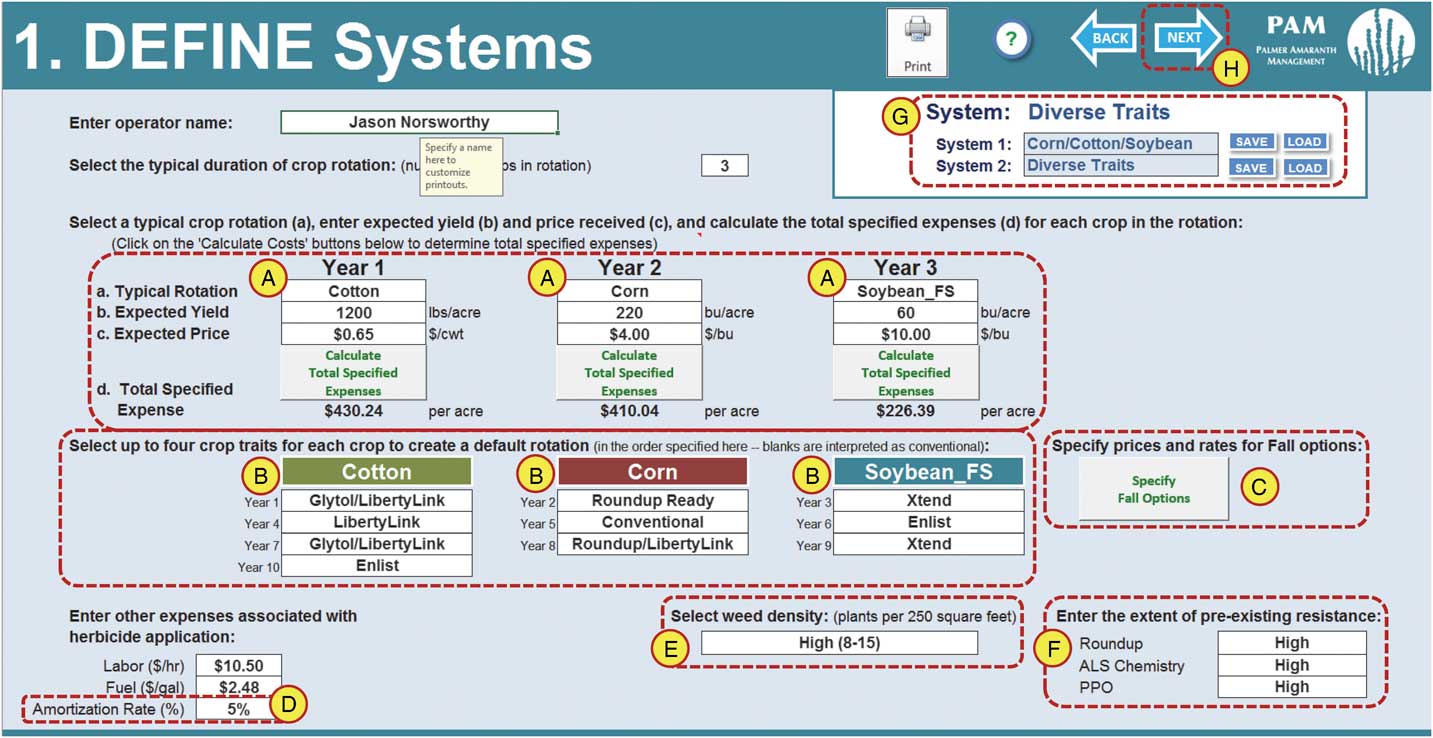
Figure 2 The ‘Diverse traits’ system. (A) The user may enter appropriate expenses for crop rotation using the ‘Calculate Total Specified Expenses’ command buttons. (B) The user may define a typical production rotation to generate default settings for the ‘Strategy’ worksheet. (C) The user can enter appropriate expenses for fall management options using the ‘Specify Fall Options’ command button. (D) The user can enter amortization rate based on anticipated level of risk associated with the operation. The amortization rate is set at 5% to represent a mid-range estimate of discount rates to convert future costs and revenue flows to today’s dollars. (E) The user may enter initial weed density in plants per ha–1. The weed density was set at ‘High’ (8 to 15 plants 23 m–2). (1 m2=10.76 ft2. (F) The user can enter preexisting resistance to glyphosate, or ALS-, and PPO-inhibiting herbicides. The preexisting resistance was set at ‘High’ for all herbicides. (G) The user may save up to two systems for comparison. (H) The user can select the ‘NEXT’ arrow (command button) to navigate to the ‘Strategy’ worksheet. Source: PAM (Bagavathiannan et al. Reference Bagavathiannan, Lindsay, Popp and Norsworthy2017).

Figure 3 Default strategy. (A) The user can save and assign names for up to six strategies for later comparison. (B) The user can recall default strategy by selecting the ‘RESET STRATEGY’ command button. (C) The user can use the conditional formatting (error checking) provided to identify potential errors or inefficiencies within the current strategy. (D) The user can use the net present value (NPV) as a guide to evaluate the long-run economic implication of strategic decisions. Convert $ ac–1 shown to $ ha–1 by multiplying with 2.4711 acre ha–1. (E) The user can use biological and economic values in the blue output cells above the strategy selection cells as a guide to making appropriate modifications to the current strategy. (F) The user can assess the diversity of weed management practices by clicking on the ‘Risk Assessment’ button as well as monitor the timing of escapes by clicking on the ‘Palmer Amaranth Escapes’ button. Source: PAM (Bagavathiannan et al. Reference Bagavathiannan, Lindsay, Popp and Norsworthy2017)
For the purpose of demonstration, the ‘Diverse Traits’ system (Figure 2) was defined to demonstrate parameter settings that represent a starting point for future production cycles. Note that monocrop or two-crop rotations are possible but not demonstrated here. The expected yield, price, total specified expenses for each year in rotation (Figure 2a–b), labor and fuel rates, and fall option specifications (Figure 2c) were set at default for this system and held constant for the 10-year analysis framework. The model does not account for changes in yield and prices over time except by way of modifying k as defined in Equation 1 (Figure 2d) and as discussed above. The initial weed density (Figure 2e) was set at 8 to 15 plants per 23 m2 (‘High’) and the expected (preexisting) resistance levels for glyphosate and for ALS-, and PPO-inhibiting herbicides were set at ‘High’ (Figure 2f) to represent a worst-case scenario for Palmer amaranth management.
Step 2: Build Appropriate Strategies Using Observable Measures of Efficacy. Upon selecting the ‘NEXT’ arrow on the top right panel of the ‘Systems’ worksheet (Figure 2g), the user proceeds to the ‘Strategy’ worksheet using VBA subroutines that prepare the above-mentioned ‘Default’ strategy (Figure 3) based on the user specifications provided in the ‘Diverse Traits’ system. This approach removes the need for the user to enter crop, crop trait, herbicide, and nonchemical weed management options for each of the 10 years of the analysis. Hence, the user only changes a few options to customize and save up to six different 10-year strategies (Figure 3a) for later comparison in the ‘Output’ worksheet. The user may also return to the default strategy at any time by selecting the ‘RESET STRATEGY’ button in the top left corner of the worksheet (Figure 3b). The default strategy provides a starting point based on user specifications in the ‘Systems’ page but does not necessarily generate a good strategy recommendation that requires no attention from the user. Additionally, error checking was added to the bottom panel of the worksheet, using the conditional formatting feature of Microsoft Excel, to guide the user to make appropriate management selections (Figure 3c).
As users make strategy modifications, they may monitor changes in overall profitability or NPV as defined in Equation 1 (Figure 3d). Additionally, modifying input cost and output price trend expectations allows for sensitivity analyses using different systems that are linked to strategies. Therefore, each saved strategy is linked to its associated saved system to ensure that strategy changes always reflect the user-defined parameters in the associated saved system (Figure 1).
For the purpose of demonstration, two different strategies have been defined to show how modifications may be made to the strategy options that affect the observable measures discussed above (Table 1). Both strategies were built beginning with the default strategy associated with the ‘Diverse Traits’ system, to simulate how users may use the software to monitor observable measures as modifications occur. Clicking on the ‘Risk Assessment’ and ‘Palmer Amaranth Escapes’ buttons (Figures 3f, 4f, and 5g), the user obtains information portrayed in Figure 6 to assist with minimizing the risk of resistance evolution and the in-season timing of Palmer amaranth plants that have escaped control (Figure 7). The ‘Non-Diverse Options’ strategy (Figure 4) is based on no tillage and heavily relies on herbicides and planting of only a few crop traits. Conversely, the ‘Diverse Options’ strategy (Figure 5) was built to reflect a diversified strategy that uses both chemical and nonchemical management options that were selected on the basis of the timing of Palmer amaranth escapes (Figure 7) and uses fall cultural practices to drive the weed seedbank to near zero. These two strategies thus differ in the level of diversity and BMP selection as summarized in Table 1. Further user modifications that target a goal of lesser risk of resistance and/or higher NPV are encouraged but not shown.
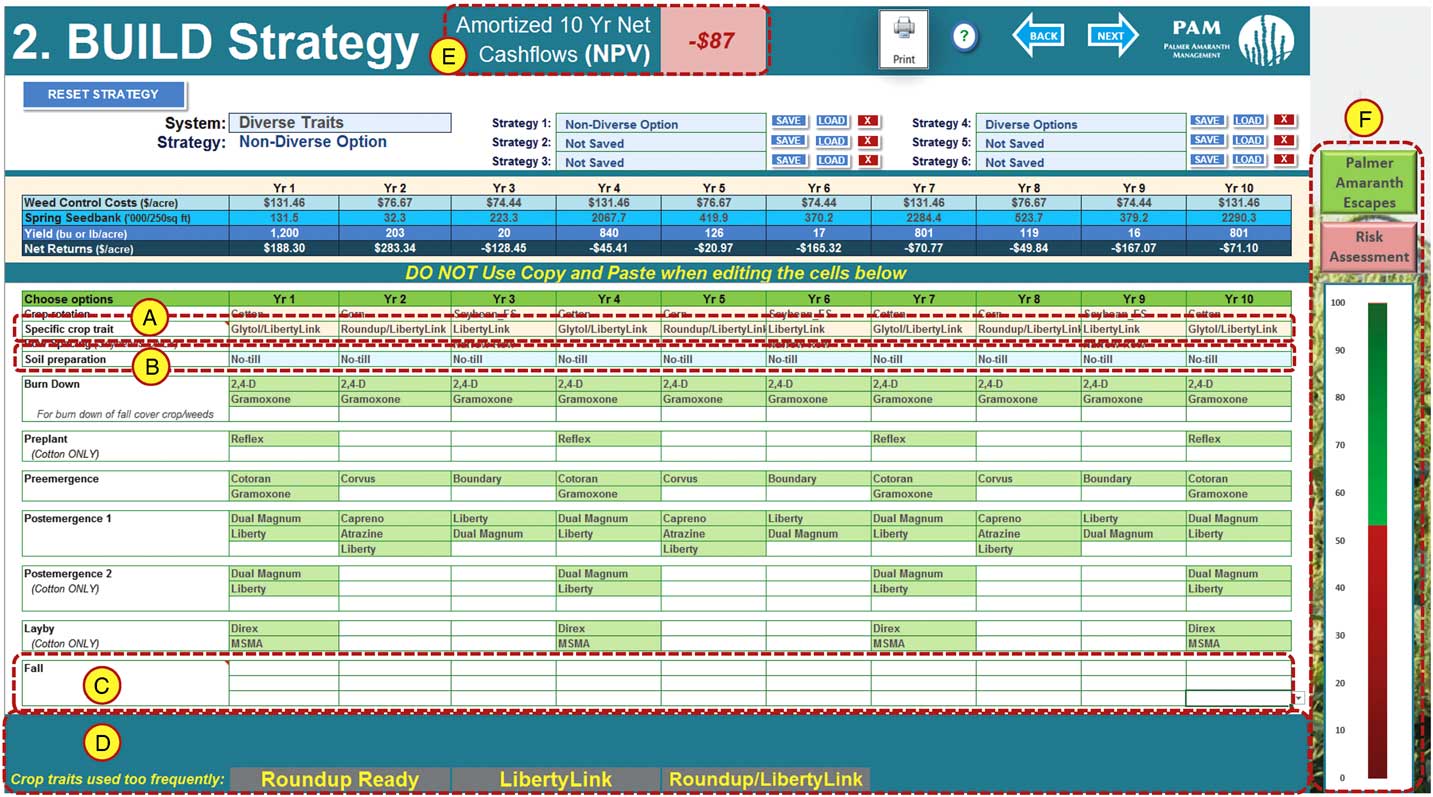
Figure 4 The ‘Non-diverse options’ strategy. (A) The ‘Specific crop traits’ have been changed to reflect a strategy that relies heavily on herbicide technologies. (B) The ‘Soil preparation’ was changed from ‘Shallow Till’ to ‘No-till’ to reflect a strategy using tillage conservation. (C) All ‘Fall’ options have been removed from the strategy to reflect a strategy that relies heavily on herbicide technologies. (D) Inappropriate tank mixes have been adjusted to ensure the operation is using legal mixes. (E) Net present value (NPV) decreased from $3,915 ha1 with the default strategy to –$215 ha–1. Convert $ ac–1 shown to $ ha–1 by multiplying with 2.4711 acre ha–1. (f) The risk of resistance evolution increased from 24% with the default strategy to 53%. Source: PAM (Bagavathiannan et al. Reference Bagavathiannan, Lindsay, Popp and Norsworthy2017).
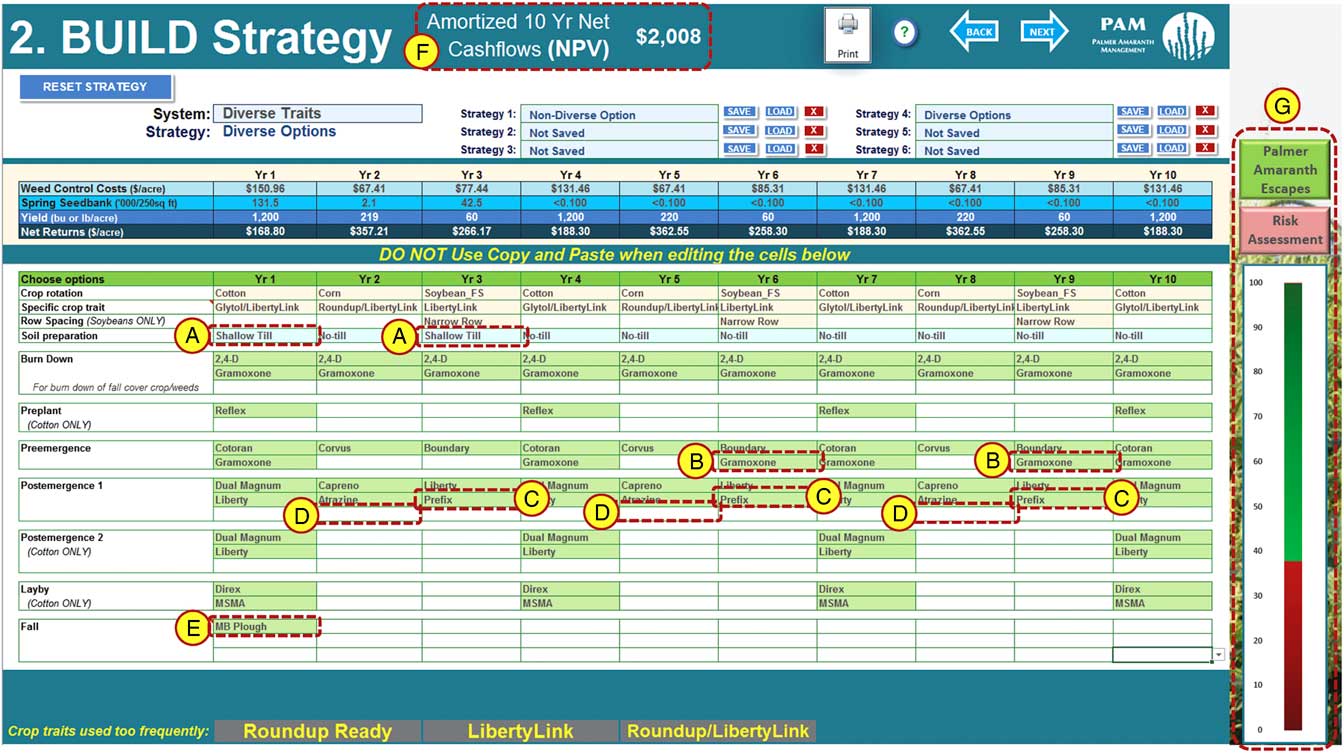
Figure 5 The ‘Diverse options’ strategy. (A) ‘Soil preparation’ was changed from ‘No-till’ to ‘Shallow Till’ in years 1 and 3. (B) Moldboard plow was added as a ‘Fall’ options in year 1. (C) ‘Gramoxone’ was added to PRE periods for full-season soybean crops in years 6 and 9. (D) ‘Prefix’ was added to POST periods for full-season soybean crops in yrs 3, 6 and 9. (E) ‘Liberty’ was removed from the POST periods when corn was planted in years 2, 5, and 8. (F) Net present value (NPV) has increased from –$215 ha–1 with the ‘Non-Diverse Options’ strategy to $4,960 ha–1. Convert $ ac–1 shown to $ ha–1 by multiplying with 2.4711 acre ha–1. (G) The risk of resistance evolution decreased from 52% with the ‘Non-Diverse Options’ strategy to 38%. Source: PAM (Bagavathiannan et al. Reference Bagavathiannan, Lindsay, Popp and Norsworthy2017).
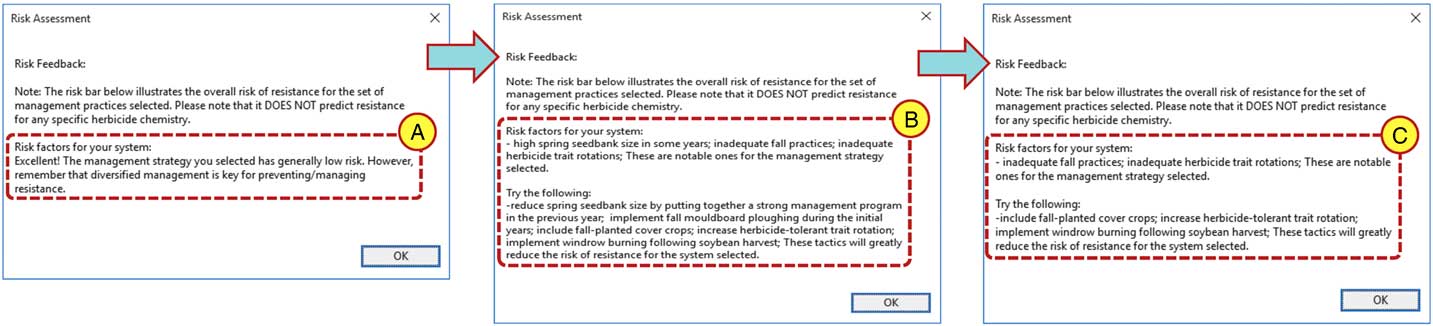
Figure 6 Risk assessment for ‘Default,’ ‘Non-diverse options,’ and ‘Diverse options’ strategies. (A) The default strategy has a generally low risk of evolution resistance, however, diversified management is encouraged. (B) The risk feedback provided highlights high spring seedbank size in some years and inadequate herbicide trait rotations as risk factors associated with the strategy and suggests reducing seedbank size by developing a strong management program in the previous year, implementing fall moldboard ploughing in the first years of production, including fall cover crops, increasing herbicide-tolerant trait rotation, and implementing windrow burning following soybean harvest to reduce the risk of evolution resistance. (C) The risk feedback provided highlights inadequate fall practices and inadequate herbicide trait rotations as risk factors associated with the strategy and suggests including fall cover crops, increasing herbicide-tolerant trait rotation, and implementing windrow burning following soybean harvest to reduce the risk of evolution resistance. Source: PAM (Bagavathiannan et al. Reference Bagavathiannan, Lindsay, Popp and Norsworthy2017).
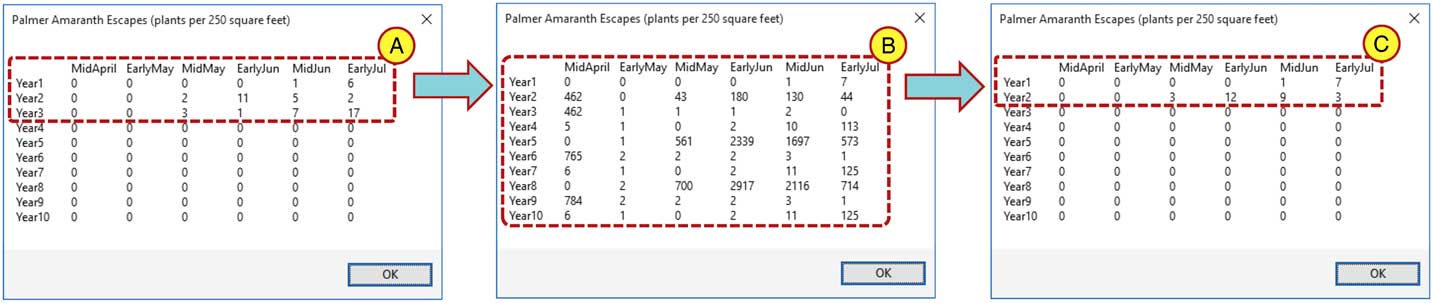
Figure 7 Palmer amaranth escapes by year for ‘Default,’ ‘Non-diverse options,’ and ‘Diverse options’ strategies. (A) Initial Palmer amaranth escapes (plants 23 m–2) occur during year 1 from mid-June to early-July. Escapes reoccur during year 2 from early June to early July and again in year 3 from mid-May through early July. (1 m2 = 10.76 ft2). (B) Palmer amaranth escapes (plants 23 m–2) occur within this strategy from mid-June in year 1 and continue to occur very frequently throughout the remaining periods of all remaining years of production. (C) Palmer amaranth escapes (plants 23 m–2) occur within this strategy from mid-June to early-July in year 1 and again from mid-May to early-June in year 2.
Table 1 Tabular weed control strategy comparison of ‘Diverse options’ and ‘Non-diverse options’.Footnote a

Step 3: Compare Output Results. Upon selecting the ‘NEXT’ arrow on the top right corner of the ‘Strategy’ worksheet, the user advances to the ‘Output’ worksheet (Figure 8). This worksheet provides a graphical representation for easy comparison among strategies saved in the ‘Strategy’ worksheet. These visual comparisons allow for a 10-year comparison of spring ‘Seedbank’ (1,000’s of seeds 23 m–2), annual yield (percent of total yield potential), annual ‘Net Returns’ (US$ ha–1), NPV (US$ ha–1), and weed management diversity assessment for each of the two strategies selected for comparison.
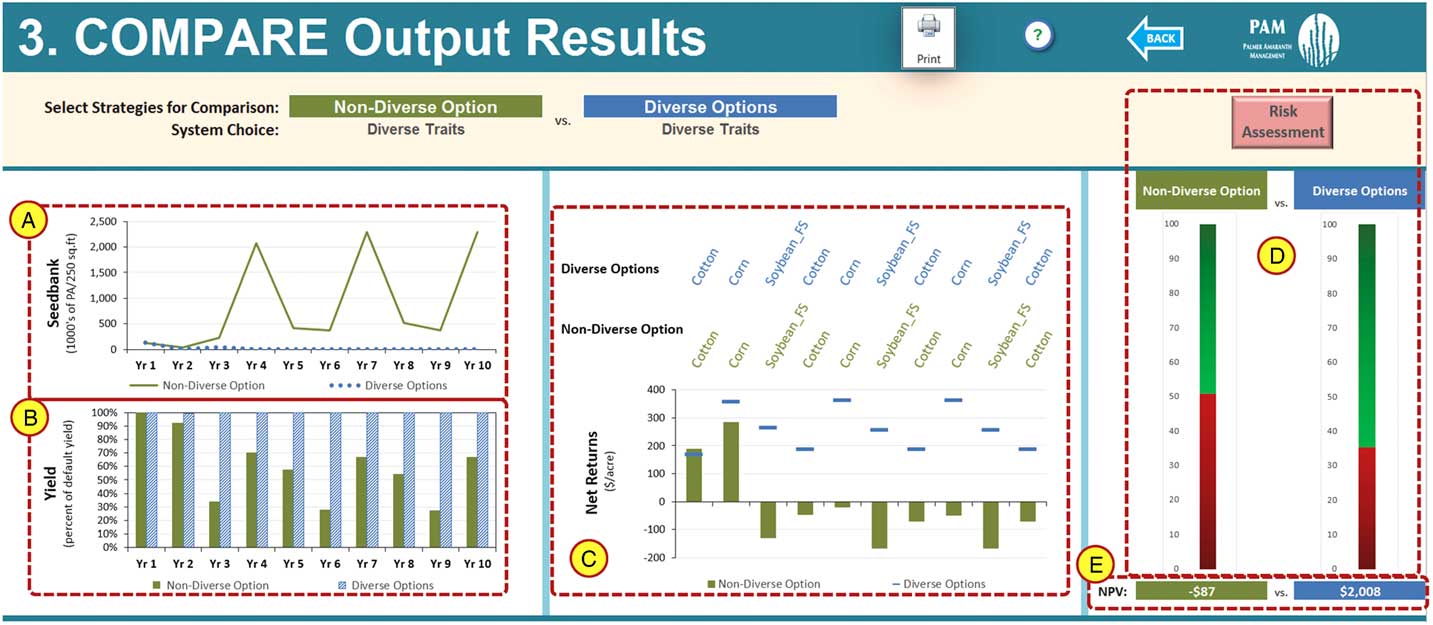
Figure 8 Output comparison of ‘Non-diverse options’ and ‘Diverse options’ strategies. (A) Spring ‘Seedbank’ is volatile for the ‘Non-Diverse Options’ strategy. The ‘Diverse Options’ strategy has low seedbank levels in the first few years of production with seedbank levels at zero in the remaining years, 4 through 10. (1 m2 = 10.76 ft2). (B)‘Yield’, as a percentage of total yield potential, for the ‘Non-Diverse Options’ strategy shows some volatility. The ‘Diverse Options’ strategy yield levels are at 100% for most years with only a slight drop in year 2. (C) ‘Net Returns’ (US$ ha–1) show some fluctuation but remain in the positive range of $415 to $880 ha–1 with the ‘Diverse Options’ strategy. The ‘Non-Diverse Options’ strategy achieves net returns of at least $415 ha–1 for the first 2 years of production, with the remaining years of production experiencing very low net returns or negative net returns as low as –$413 ha–1. Convert $ ac–1 shown to $ ha–1 by multiplying with 2.4711 acre ha–1. (D) The risk of evolution of resistance with the ‘Non-Diverse Options’ strategy scored 51% compared to the ‘Diverse Options’ strategy at 35%. (E) The NPV for the ‘Non-Diverse Options’ strategy is experiencing a loss at –$215 ha–1 compared to $4,960 ha–1 for the ‘Diverse Options’ strategy. Source: PAM (Bagavathiannan et al. Reference Bagavathiannan, Lindsay, Popp and Norsworthy2017).
Figure 8 provides a side-by-side comparison of the ‘Non-Diverse Options’ and ‘Diverse Options’ strategies to show how modifications to the strategy options may affect seedbank size, crop yields, net returns, and weed management diversity (risk assessment). Notice that the spring seedbank is high and fluctuating for the ‘Non-Diverse Options’ strategy (Figure 8a), whereas the ‘Diverse Options’ strategy has low seedbank levels in the first few years of production with seedbank levels near zero in the remaining years. Moreover, yield values for the ‘Non-Diverse Options’ strategy shows some volatility compared with the ‘Diverse Options’ strategy, which maintains relatively constant yield potential near 100% of the expected yield for most years (Figure 8b). The ‘Non-Diverse Options’ strategy achieves net returns of approximately $415 ha–1 for only the first 2 years of production, with the remaining years experiencing very low or negative net returns, compared with the ‘Diverse Options’ strategy that shows some fluctuation but remains in the positive range of approximately $415 to $880 ha–1 (Figure 8c). The NPV for the ‘Non-Diverse Options’ strategy is very low at –$215 ha–1 compared to nearly $4,960 ha–1 for the ‘Diverse Options’ strategy (Figure 8e). Furthermore, the ‘Non-Diverse Options’ show 53% risk of resistance, whereas the ‘Diverse Options’ strategy shows only 38% risk for the specific management options selected (Figure 8d). This value remains somewhat high, because the ‘Diverse Options’ strategy still utilizes repeated reliance on chemical practices using the same herbicide mode of action, encouraging the user to include nonchemical tactics and further reduce resistance risk.
Model Expectations
By providing crop producers, crop consultants, and weed management educators the means to evaluate the long-term biological and economic implications of different Palmer amaranth management practices, PAM is expected to promote a “proactive” IWM-based strategy to weed management. Thus, the PAM software encourages the use of IWM techniques that reduce long-term soil seedbank levels and improve economic benefits through an adoption of diverse chemical and nonchemical Palmer amaranth management options that can be tailored to the needs of a specific a situation using a user-friendly point-and-click interface.
Using the above steps, PAM allows users to compare current production practices to a strategic 10-year production approach based on established BMPs to manage Palmer amaranth. Holding crop rotation and crop traits constant, strategies can be developed to illustrate the importance of critically timed chemical and nonchemical approaches (including fall management practices) for reducing Palmer amaranth population densities. Error checking and other automated features provide feedback to assist the user in quickly identifying areas within a given strategy that need improvement.
This software also helps illustrate how excessive reliance on a single herbicide mode of action leads to negative biological and economic repercussions compared to an approach that integrates chemical and nonchemical methods (Norsworthy et al. Reference Norsworthy, Ward, Shaw, Llewellyn, Nichols, Webster, Bradley, Frisvold, Powles, Burgos, Witt and Barrett2012). This comparison further highlights the positive relationship between management diversity and long-term economic implications using an NPV analysis. The NPV represents the economic value of management strategies in the long term and is intended to capture economic consequences of crop rotation and weed control costs. This allows an assessment of the opportunity cost of potentially mismanaging the soil seedbank size with untimely weed management practices while also monitoring the risk of resistance (Mueller et al. Reference Mueller, Mitchell, Young and Culpepper2005). This opportunity cost is the user-specified discount rate, which typically ranges from 3% to 10% in agricultural production analyses (Hardie Reference Hardie1984); higher values imply greater uncertainty and/or a pessimistic outlook in terms of growth in yield potential or prices.
Model Limitations
The PAM software was not designed as a forecast model; rather, it was strictly meant to be a “demonstration-based” DSS to show potential long-term economic changes as a result of biological interactions between the Palmer amaranth life cycle and chemical/nonchemical weed control options. Although PAM considers herbicide resistance levels at initiation of the 10-year rotation, it does not predict resistance, and hence, PAM is not a resistance simulation model (Bagavathiannan et al. Reference Bagavathiannan, Lindsay, Popp and Norsworthy2017). Moreover, as PAM is a deterministic model, it does not provide stochastic information about expected variations across years and/or production parameters. The model is only expected to provide an average response for a given strategy. Fixed costs, such as equipment and other capital costs, were excluded from economic return calculations, as they were treated as sunk costs on operations that would not be expected to acquire additional equipment as a result of management options employed (Lindsay Reference Lindsay2017). Finally, PAM is intended to track the effect of selected management options on Palmer amaranth only; therefore, any observed changes in biological or economic output with respect to the exclusion of or changes in herbicide options in strategy selections do not reflect the effect of those changes on other weed species that may be present in the field.
Future Analysis and Improvements
The tool has been presented at extension and industry meetings. Feedback has been used to improve the model; however, user satisfaction with the tool has not been surveyed to date, as training sessions through extension are currently in the planning stages. In addition, analyses of different strategies are under way to illustrate how the PAM model can be utilized to demonstrate the long-term biological and economic benefits of adopting specific BMPs identified by Norsworthy et al. (Reference Norsworthy, Ward, Shaw, Llewellyn, Nichols, Webster, Bradley, Frisvold, Powles, Burgos, Witt and Barrett2012). Future model developments will include addition of other major crops in the region, such as rice (Oryza sativa L.), inclusion of a prevalent monocot species, barnyardgrass (Echinochloa crus-galli L.) (Norsworthy et al. Reference Norsworthy, Bond and Scott2013; Riar et al. Reference Riar, Norsworthy, Steckel, Stephenson, Eubanks and Scott2013a), and additional weed control production practices such as manual weeding and mid-season tillage.
Acknowledgments
The authors are grateful for funding from the USDA-NIFA Crop Protection and Pest Management Program, Cotton Incorporated, Bayer CropScience, Dow AgroSciences, and Syngenta.


