Introduction
Cover crops provide soybean growers with many benefits, including erosion control, increased nutrient efficiency, and increased soil health (Pimentel et al. Reference Pimentel, Harvey, Resosudarmo, Sinclair, Kurz, McNair, Crist, Shpritz, Fitton and Saffouri1995; Reddy et al. Reference Reddy, Zablotowicz, Locke and Koger2003; Reeves and Wood Reference Reeves, Wood and Jensen1994; Sainju and Singh Reference Sainju and Singh1997). In addition, cover crops can sometimes provide winter and summer annual weed control (Cornelius and Bradley Reference Cornelius and Bradley2017; Kruidhof et al. Reference Kruidhof, Bastiaans and Kropff2008; Webster et al. Reference Webster, Scully, Grey and Culpepper2013).
Cover crops such as cereal rye, winter vetch, and winter wheat can reduce weed density by creating a barrier that blocks sunlight from reaching the soil, thus preventing weed seed from obtaining sunlight needed for germination (Huarte and Arnold Reference Huarte and Arnold2003; Teasdale et al. Reference Teasdale, Brandsaeter, Calegari, Neto, Upadhyaya and Blackshaw2007). Cover crops also can suppress weed seed germination by outcompeting seeds for moisture needed for germination, as well as by releasing allelopathic chemicals that inhibit weed germination and growth (Barnes and Putnam Reference Barnes and Putnam1986; Teasdale and Mohler Reference Teasdale and Mohler1993; Whittaker and Feeny Reference Whittaker and Feeny1971). The amount of cover crop biomass will often determine the level of weed suppression, because higher amounts of residue provide greater weed suppression (Brennan and Smith Reference Brennan and Smith2005).
Several studies have shown that cover crop species generally provide greater levels of winter annual than summer annual weed control (Cornelius and Bradley Reference Cornelius and Bradley2017; Webster et al. Reference Webster, Scully, Grey and Culpepper2013). Common winter annual weeds such as common chickweed [Stellaria media (L.) Vill.], field pennycress (Thlaspi arvense L.) and henbit (Lamium amplexicaule L.) were suppressed by cereal rye and a cereal rye plus winter vetch mixture; reductions in weed density ranged from 68% to 72% (Cornelius and Bradley Reference Cornelius and Bradley2017). Hayden et al. (Reference Hayden, Brainard, Henshaw and Ngouajio2012) found similar results, reporting 94% to 96% biomass reduction of common chickweed, field pennycress, and henbit from a cereal rye plus winter vetch mixture, with cereal rye alone reducing winter annual weed biomass by 94% to 98%. Winter wheat also is effective in reducing glyphosate-resistant horseweed [Conyza canadensis (L.) Cronq.] densities by 90% 1 mo after planting, but it was not an effective control 4 mo after planting compared with a fall-applied residual herbicide program consisting of 0.28 kg metribuzin ha−1 plus 0.07 kg flumetsulam ha−1 plus 0.56 kg 2,4-D ha−1 (Davis et al. Reference Davis, Gibson, Bauman, Weller and Johnson2007). Cereal rye reduced early-season waterhemp emergence up to 35% compared with the nontreated control 2 wk after cover crop termination, which was similar to that provided by 1.72 kg glyphosate ha−1 plus 0.56 kg 2,4-D ha−1 ester plus 0.098 kg sulfentrazone ha−1 plus 0.01 kg cloransulam-methyl ha−1 (Cornelius and Bradley Reference Cornelius and Bradley2017). However, Austrian winter pea, Italian ryegrass, winter vetch, crimson clover (Trifolium incarnatum L.), radish (Raphanus sativus L.), and oat provided no significant reduction in early-season waterhemp control compared with the nontreated control, and no cover crop species provided reductions in late-season waterhemp density comparable to a spring PRE residual herbicide (Cornelius and Bradley Reference Cornelius and Bradley2017). Similar patterns in early- versus late-season control were found for Palmer amaranth (Amaranthus palmeri S. Watson) suppression by cereal rye; weed densities increased by 43% from early June to late July (Webster et al. Reference Webster, Scully, Grey and Culpepper2013).
These reductions in summer annual weed control as the season progresses most likely are due to cover crop decomposition, which diminishes the residue’s soil cover to reduce weed seed germination (Kruidhof et al. Reference Kruidhof, Bastiaans and Kropff2009; Teasdale and Mohler Reference Teasdale and Mohler1993). Cellulose and lignin decompose very slowly and are the most abundant components of plant tissue (Fioretto et al. Reference Fioretto, Di Nardo, Papa and Fuggi2005). Therefore, cover crops with high cellulose and lignin content have slower decomposition rates, thus having greater potential to suppress summer annual weeds late in the season, compared with those that decompose faster (Teasdale et al. Reference Teasdale, Brandsaeter, Calegari, Neto, Upadhyaya and Blackshaw2007).
The use of PRE residual herbicides has been one of the primary methods of summer annual weed control in soybean and is one of the primary recommendations for the management and/or mitigation of herbicide-resistant weeds like waterhemp and Palmer amaranth (Norsworthy et al. Reference Norsworthy, Ward, Shaw, Llewellyn, Nichols, Webster, Bradley, Frisvold, Powles, Burgos, Witt and Barrett2012). Previous research has shown that an application of a PRE residual herbicide in combination with a cover crop residue could provide growers with adequate late-season control of troublesome weeds like waterhemp and Palmer amaranth (Cornelius and Bradley Reference Cornelius and Bradley2017; Wiggins et al. Reference Wiggins, Hayes and Steckel2016). Wiggins et al. (Reference Wiggins, Hayes and Steckel2016) found that cereal rye, winter vetch, crimson clover, or winter wheat, in combination with PRE-applied acetochlor or fluometuron, controlled Palmer amaranth greater than 87%, but cover crops that did not have a PRE herbicide application provided less than 65% control.
Although several recent studies have investigated the integration of cover crops with PRE residual herbicides for weed control, few studies have investigated the possibility of applying a PRE residual herbicide in combination with nonselective herbicides at the time of cover crop termination. A combined application would eliminate an additional sprayer pass; however, the primary concern is to what extent the living cover crop residue will intercept the residual herbicide that is intended to reach the soil surface. Wheat straw at a density of 9,000 kg ha−1 prevented applied metribuzin from reaching the soil surface, but when there was only 2,250 kg ha−1 of wheat straw, 25% of the applied metribuzin was detected in the soil (Banks and Robinson Reference Banks and Robinson1982). Plant residues have a higher capacity for herbicide sorption than does soil; however, the sorption capacity can change significantly, depending on the plant species and the interval between desiccation and herbicide application (Dao Reference Dao1991; Wagger Reference Wagger1989). Dao (Reference Dao1991) determined that wheat straw containing higher amounts of lignin had greater sorptive capacity, and the percentage of lignin in wheat straw increased with straw age.
A variety of studies have shown that certain cover crop species can provide some winter and summer annual weed control, in addition to reducing soil erosion and increasing soil health. Other research has shown that soybean growers should not rely on cover crops alone for weed control; cover crops can be a component of an integrated weed management program that includes a variety of cultural and chemical control methods (Cornelius and Bradley Reference Cornelius and Bradley2017; Norsworthy et al. Reference Norsworthy, Ward, Shaw, Llewellyn, Nichols, Webster, Bradley, Frisvold, Powles, Burgos, Witt and Barrett2012). However, little is known about the effect of cover crop residues on the ability of residual herbicides to reach the soil when applied with nonselective and nonresidual herbicides used for cover crop termination applications.
The goal of this study was to determine the most effective strategy for the integration of residual herbicides and cover crops in soybean. Therefore, the objectives of this research were to (1) determine the effect of termination timing on cover crop biomass accumulation; (2) determine the effect of cover crop residues on the amount of a residual herbicide, sulfentrazone, that can reach the soil; and (3) determine the effectiveness of applying residual herbicides in conjunction with a cover crop termination application on weed control.
Materials and Methods
Experimental Site Location and Design Description
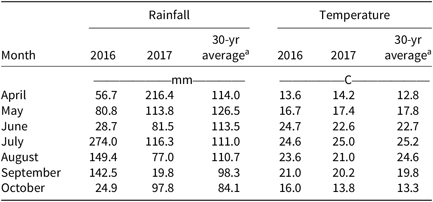
Field experiments were conducted in 2016 and repeated at a separate location in 2017 at the University of Missouri Bradford Research Center near Columbia, MO (38.90°N, 92.21°W). The soil at the 2016 site was a Mexico silt loam (fine, smectitic, mesic Vertic Epiaqualfs) with 2.4% organic matter and a pH of 6.4; at the 2017 location, soil was a Leonard silt loam (fine, smectitic, mesic Vertic Epiaqualfs) with 2.7% organic matter and a pH of 7.3. Cover crops were planted on September 13 and 29 in 2015 and 2016, respectively, with a no-till drill (John Deere 750; Deere & Company, Moline, IL). The winter annual cover crops and seeding rates were as follows: 123 kg ‘VNS’ cereal rye ha−1; 135 kg ‘VNS’ winter wheat ha−1; 28 kg ‘PPERC2’ Italian ryegrass ha−1; 78 kg ‘Bob’ oat ha−1; 34 kg winter vetch ha−1; 56 kg ‘Austrian’ winter pea ha−1; and a mix of 78 kg cereal rye ha−1 plus 34 kg winter vetch ha−1 (Cornelius and Bradley Reference Cornelius and Bradley2017; NRCS 2011). All cover crop species survived the winters. At 7 and 21 days prior to soybean planting (DPP) in the subsequent spring, cover crops were terminated by applying preplant (PP) herbicide programs. Soybean seed was planted into all plots at a density of 407,000 seeds ha−1 in 76-cm rows on May 7 and May 10 in 2016 and 2017, respectively. Average monthly temperature and monthly rainfall totals as well as 30-yr averages are presented in Table 1.
Table 1. Monthly rainfall, average monthly temperatures, and 30-yr averages a from April through October in 2016 and 2017 at the Boone County research location.

a National Climatic Data Center (2018).
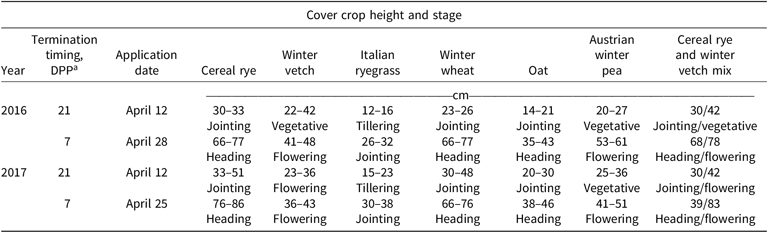
The experimental design for soybean planting was a randomized complete block in a split-plot arrangement of treatments. Whole plots consisted of the terminated, seven cover crop treatments, one conventional tillage, and one nontillage treatment; subplots consisted of herbicide treatments. The subplot sizes were 3 by 5 m and each treatment was replicated four times. Tillage plots were tilled 7 DPP with a field cultivator to remove any emerged weeds. Nontilled plots were left undisturbed. Herbicide applications were made using a CO2-pressurized backpack sprayer equipped with XR 8002 flat-fan nozzle tips (TeeJet®; Spraying Systems Co., Wheaton, IL) that delivered 140 L ha−1 at 117 kPa at a speed of 5 km h−1. The sources of all herbicides used in the experiments are listed in Table 2. The height of each cover crop species at the time of termination is listed in Table 3.
Table 2. Sources of materials used in the experiments. a
a Manufacturer’s label for each product can be found at http://www.cdms.net.
b Abbreviations: DF, dry flowable; EC, emulsifiable concentrate; L, liquid; SC, soluble concentrate; SL, soluble (liquid) concentrate; WG, water-dispersible granule.
Table 3. Height and stage of cover crops at the time of herbicide application.

a Abbreviation: DPP, days prior to planting.
Residual herbicides were evaluated either PP only, PP and POST, or POST. Glyphosate and 2,4-D were used to terminate the cover crops, whereas sulfentrazone plus chlorimuron applied PRE and fomesafen plus S-metolachlor applied POST were evaluated as the residual herbicide treatments. The herbicide programs evaluated for soybeans were as follows: (1) no residual: 1.40 kg glyphosate ha−1 plus 0.56 kg 2,4-D ha−1 PP; (2) residual PP: 1.40 kg glyphosate ha−1 plus 0.56 kg 2,4-D ha−1 plus 0.69 kg sulfentrazone ha−1 plus 0.04 kg chlorimuron ha−1 PP followed by 1.12 kg glyphosate ha−1POST; (3) residual PP and POST: 1.40 kg glyphosate ha−1 plus 0.56 kg 2,4-D ha−1 plus 0.69 kg sulfentrazone ha−1 plus 0.04 kg chlorimuron ha−1 PP followed by 1.12 kg glyphosate ha−1 plus 1.06 kg fomesafen ha−1 plus 4.90 kg S-metolachlor ha−1 POST; and (4) residual POST: 1.40 kg glyphosate ha−1 plus 0.56 kg 2,4-D ha−1 PP followed by 1.12 kg glyphosate ha−1 plus 1.06 kg fomesafen ha−1 plus 4.90 kg S-metolachlor ha−1 POST. The PP treatments to terminate the cover crops were applied 21 and 7 DPP, whereas residual POST treatments were applied 4 wk after the corresponding termination applications. When the residual was applied PP, POST applications were made 9 wk after the PP application. All residual herbicide applications received at least 1.11 cm of rainfall within 1 wk of application. All cover crop, tillage, and nontillage treatments also included plots that received no herbicide program (the nontreated control).
Treatment Evaluation and Data Collection
Weed control was visually evaluated 7 wk after soybean planting (WAP) using a scale of 0% (no control) to 100% (complete control). Visual assessments were compared with the no-till, nontreated control. The weed species evaluated in this study include A. tuberculatus, giant foxtail (Setaria faberi Herrm.), large crabgrass [Digitaria sanguinalis (L.) Scop.], common cocklebur (Xanthium strumarium L.), common ragweed (Ambrosia artemisiifolia L.), yellow nutsedge (Cyperus esculentus L.), horsenettle (Solanum carolinense L.), horseweed, barnyardgrass [Echinochloa crus-galli (L.) P. Beauv.], prickly sida (Sida spinosa L.), and shattercane [Sorghum bicolor (L.) Moench ssp. verticilliflorum (Steud.) de Wet ex Wiersema & J. Dahib]. Weed control is presented as overall weed control, which includes all weed species. Waterhemp control was rated separately because of its status as one of the most troublesome weeds in the United States and is presented as waterhemp control (Van Wychen Reference Van Wychen2017). Fresh wt of aboveground cover crop biomass and, in the case of the tillage treatments, any weed residue biomass remaining on the soil surface was harvested from one, 0.33-m2 quadrat plot−1. One 5-cm diam soil sample plot−1 to a depth of 10 cm was collected at five collection intervals: 0, 14, 28, 56, and 84 d after each PP herbicide application timing. Soil samples were immediately placed in a freezer and kept at −9 C until further processing to determine sulfentrazone amounts. Yield was determined by harvesting the innermost two soybean rows in each plot with a small plot combine, and seed moisture was adjusted to 13%.
High-Performance Liquid Chromatography Analysis
Soil samples were processed in a similar manner to that of Ohmes and Mueller (Reference Ohmes and Mueller2007). Frozen soil samples were air dried, passed through a 2-mm screen, and prepared for analysis with liquid chromatography and tandem mass spectrometry. From each soil sample, 10 g was added to 50-mL screw-top centrifuge tubes, and 20 mL of high-performance liquid chromatography–grade acetonitrile solution was added to each tube. Tubes were shaken for 1 h at 125 rpm on a reciprocating shaker. Samples were then centrifuged at 5,000 rpm for 5 min. Supernatant was decanted into a new 50-mL screw-top centrifuge tube. The extraction process was repeated with a fresh 20 mL of acetonitrile added to the soil, followed by shaking, centrifugation, and decanting. From the final volume of 40 mL, 1 mL of each supernatant sample was then pipetted into 1.5-mL Agilent liquid-chromatography vials (Agilent, Santa Clara, CA) for analysis with an Agilent Model 6460 triple quadrupole mass spectrometer using a multiple-reaction monitoring method with an electrospray ionization source equipped with Agilent Jet Stream Technology in negative mode and an Eclipse Plus C-18 4.6-mm by 50-mm by 1.8-μm column. The mobile phase was a 60:40 ratio of water plus 0.1% acetic acid to acetonitrile plus 0.1% acetic acid at a flow rate of 0.5 mL min−1. Both precursor and product ion scans were used. The operating conditions for the mass spectrometry parameters were as follows: gas flow, 11 L min−1; nebulizer, 35 psi; capillary voltage, 3,500 V; and gas temperature, 325 C. Retention time for sulfentrazone was 5.01 min. The amount of sulfentrazone (ng g−1 of soil) was then calculated for each sample. The limit of detection for this method is 2.45 pg g−1 of soil and the limit of quantification is 4.29 pg g−1 of soil. Recovery of sulfentrazone applied to the soil was 110%.
Statistical Analysis
All data were subjected to analysis using SAS, version 9.4 (SAS® Institute Inc., Cary, NC) using the PROC GLIMMIX procedure. Environments and replications were considered random effects, and herbicide programs, applications timings, collection intervals, and cover crop treatments were considered fixed effects. To make inferences over a wider range of environments, year was considered a random effect in the model (Blouin et al. Reference Blouin, Webster and Bond2011; Carmer et al. Reference Carmer, Nyquist and Walker1989). Individual treatment differences were separated using Fisher protected LSD at P ≤ 0.05.
Results and Discussion
Biomass
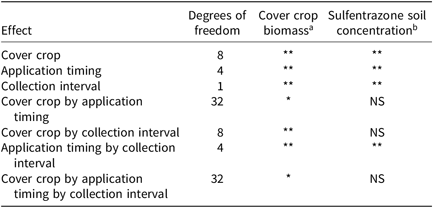
There was a cover crop treatment by application timing by collection interval interaction for cover crop biomass (P < 0.0001) (Table 4). At 0 d after the 21 DPP application timing, winter vetch had the highest biomass wt (17,247 kg ha−1); Austrian winter pea was the only other cover crop species with a similar wt (13,434 kg ha−1) (Table 5). On the contrary, Reddy (Reference Reddy2001) found that oat had higher biomass than winter vetch, crimson clover, and subterranean clover (Trifolium subterraneum L.), with biomasses of 11,100, 6,800, 6,000, and 6,700 kg ha−1, respectively. At all other collection intervals (14, 28, 56, and 84 d after application [DAA]), there were no significant differences in cover crop biomass among species at the 21 DPP application timing. Austrian winter pea had the highest biomass of cover crop species 0 d after the 7 DPP application timing (40,747 kg ha−1) (Table 5). Austrian winter pea also had the greatest biomass 14 d after the 7 DPP application (18,235 kg ha−1), though cereal rye plus winter vetch and winter vetch had similar wts of 16,063 and 12,513 kg ha−1, respectively (Table 5). At all remaining collection intervals (28, 56, and 84 DAA), there were no significant differences in biomass for all cover crop treatments at the 7 DPP application timing. At the 0 DAA collection interval, the 2-wk delay (21 vs. 7 DPP) in terminating the Austrian winter pea and cereal rye plus winter vetch mix resulted in a greater than 200% and 89% increase in biomass, respectively. Similar trends were observed at the 14 DAA collection interval: the 2-wk delay in terminating Austrian winter pea, cereal rye plus winter vetch mix and winter vetch resulted in significant biomass increases of 13,328, 11,076, and 8,739 kg ha−1, respectively (Table 5). There were no differences in the tillage and nontillage treatments at the 21 and 7 DPP application timings at any of the collection intervals (Table 5). These results indicate that allowing 2 wk more of cover crop growth in the spring before termination will result in substantial increases in cover crop biomass.
Table 4. Summary of effects for cover crop biomass and sulfentrazone soil concentration.

a NS at α = 0.05; *significant difference at α = 0.01; **significant difference at α = 0.001.
b Abbreviation: NS, no significant difference.
Table 5. Influence of cover crop species, herbicide application timing, and collection interval on cover crop biomass.
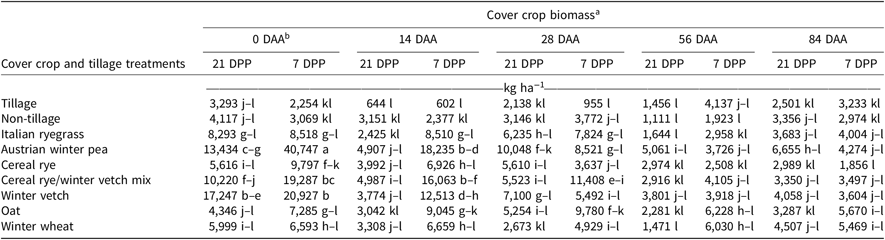
a Means within the same column and row followed by the same letter are not different at α = 0.05.
b Abbreviations: DAA, days after application; DPP, days prior to planting.
Sulfentrazone Soil Concentrations
There was a timing by collection interval interaction for sulfentrazone soil concentration (P < 0.001), but no other interactions (Table 4). When comparing application timings across collection intervals, sulfentrazone concentration was highest at the 0-, 14- and 28-d collection intervals for the 21 DPP application timing (Figure 1A). The 56- and 84-d collection intervals after the 7 DPP application had the lowest sulfentrazone concentrations of all collection intervals after both application timings (53 and 26 ng g−1, respectively) (Figure 1A). Except for the 56-d collection interval, all collection intervals had higher sulfentrazone levels after the 21 DPP than the 7 DPP application timing (Figure 1A). This was due to the later termination timings, resulting in more cover crop biomass accumulation. Similar sulfentrazone concentrations 56 DAA could be attributed to sorbed sulfentrazone being released from cover crop residues. Sulfentrazone concentration was highest when applied to the tillage treatment, with a concentration of 171 ng g−1 (Figure 1B). The cereal rye plus winter vetch mix, Austrian winter pea, winter vetch, Italian ryegrass, oat, and winter wheat had the lowest sulfentrazone concentrations of the cover crop treatments, with concentrations of 89, 68, 71, 92, 88, and 89 ng g−1, respectively (Figure 1B).
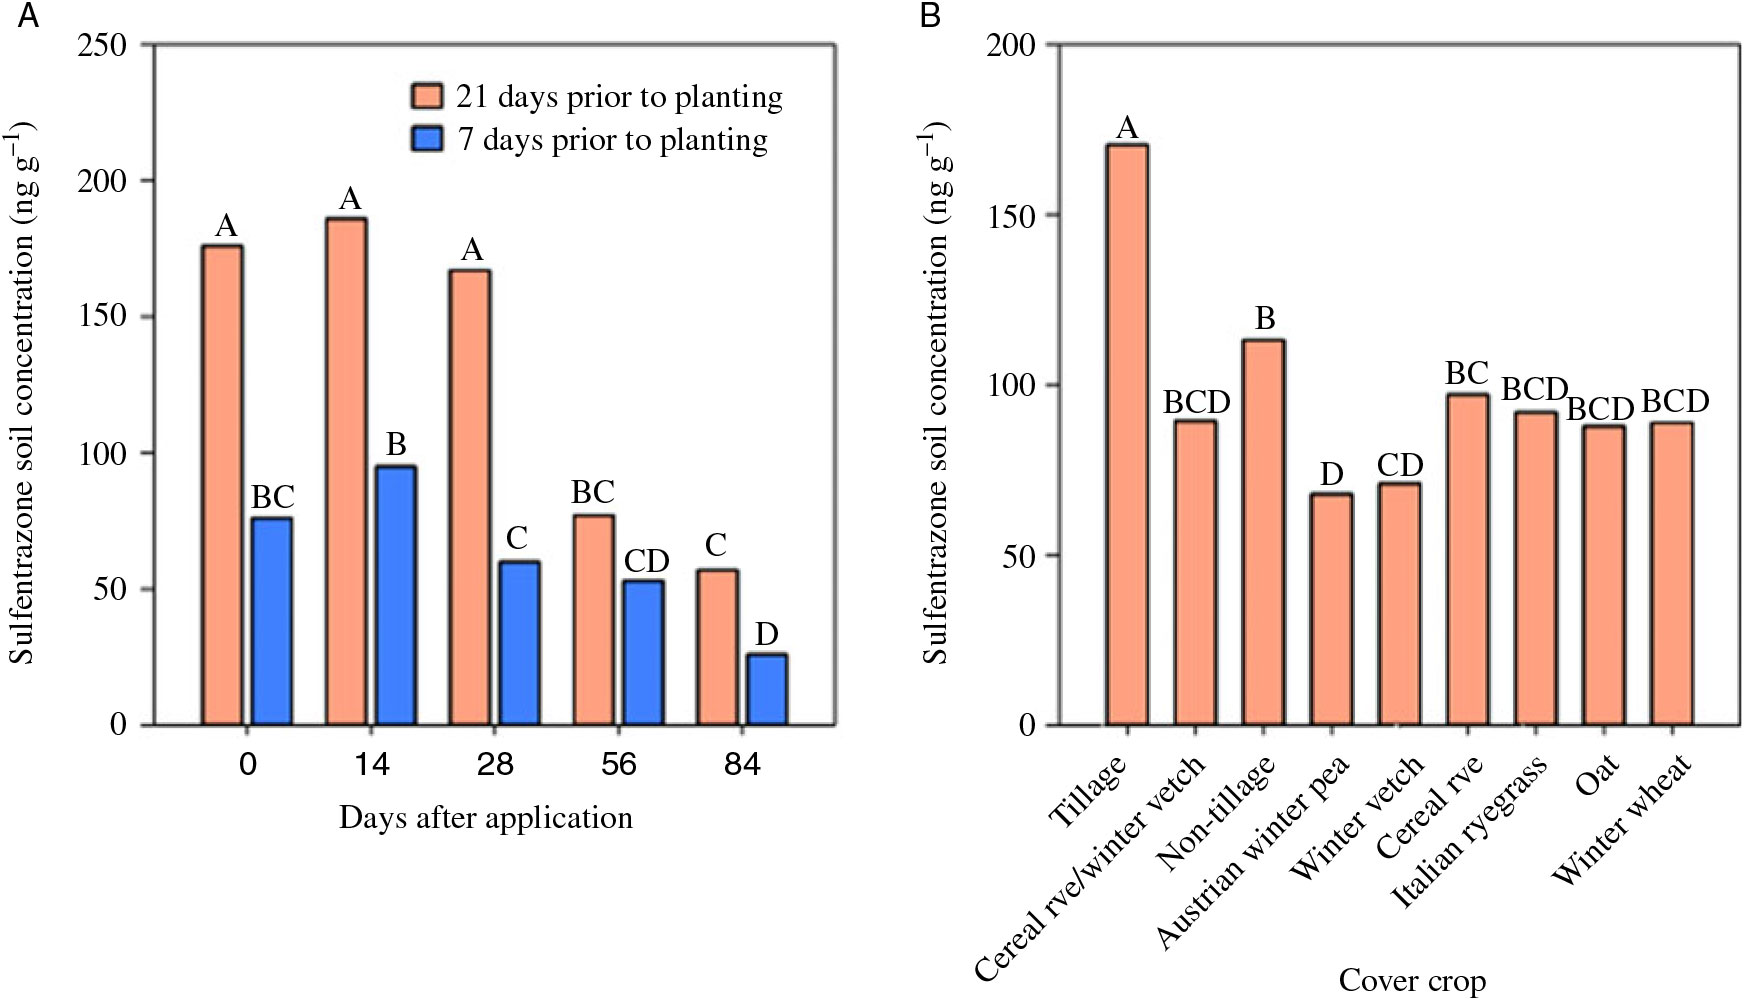
Figure 1. Influence of (A) preplant herbicide application timing and collection interval and (B) cover crop and tillage treatment on sulfentrazone soil concentrations. Within each graph, bars with the same letter are not different (α = 0.05). DPP, days prior to planting.
Biomass accumulation had an inverse relationship with sulfentrazone soil concentrations, with lower sulfentrazone concentration occurring where cover crop biomass was greatest (Figure 1B; Table 5). Banks and Robinson (Reference Banks and Robinson1982) observed a similar response in that less acetochlor, alachlor, metolachlor, and metribuzin were detected in soil as winter wheat straw residue increased. At the time of application (0 DAA), more sulfentrazone was recovered from the soil when herbicide applications were made 21 DPP than at 7 DPP (Figure 1A). Higher sulfentrazone concentrations 21 DPP compared with 7 DPP were likely due to lower biomass accumulation at the 21 DPP timing (Figure 1A; Table 5). Averaged across cover crop species, higher sulfentrazone concentration at 0, 14, and 28 d after the 21 DPP timing correlated to low levels of biomass at this timing (Figure 1A; Table 5). Consistent with this, the tillage treatment resulted in the lowest biomass accumulation at all collection intervals after both application timings, subsequently resulting in tillage having the highest sulfentrazone concentration of all cover crop treatments (171 ng g−1) (Figure 1B; Table 5). Sulfentrazone levels decreased as the time after application increased through the season, which is expected because of microbial degradation (Figure 1) (Shaner Reference Shaner2014).
Overall Weed Control
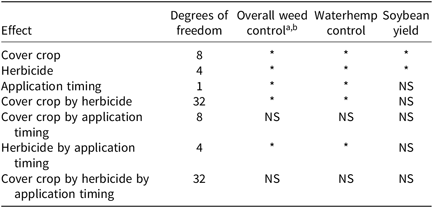
There was a cover crop species by herbicide interaction (P < 0.0001) and a herbicide by application timing interaction (P < 0.0001) for overall weed control, but no other interactions (Table 6). Comparing cover crop and tillage treatments within an herbicide program, all cover crop species and tillage treatments without a residual herbicide treatment (no-residual program) provided 20% to 48% overall weed control 7 wk after planting (Table 7). Without a residual herbicide, Italian ryegrass, oat, and wheat suppressed summer annual weeds by 48%, 38%, and 38%, respectively (Table 7). These data show that cover crops alone do not provide adequate weed control while also emphasizing the need for growers to use residual herbicides in their weed control programs. When the residual PP program was used, there were no significant differences among cover crops for this herbicide program, and weed control ranged from 72% to 85% (Table 7). In addition, cover crop treatments did not differ from tillage treatments without cover crops (Table 7). With the residual POST program, Italian ryegrass, Austrian winter pea, cereal rye, cereal rye plus winter vetch, tillage, oat, and winter wheat provided the most weed control, with control ranging from 79% to 88% (Table 7).
Table 6. Summary of effects for overall weed control and waterhemp control 7 wk after planting and soybean yield at harvest.

a NS at α = 0.05; *significant difference at α = 0.05.
b Abbreviation: NS, no significant difference.
Table 7. Influence of cover crop species and herbicide programs on overall weed and waterhemp control 7 wk after planting.
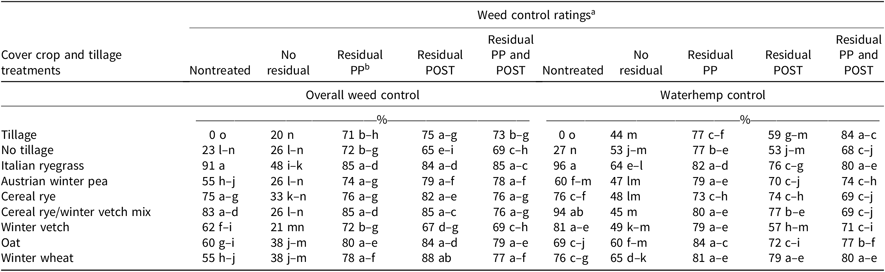
a Mean separation for overall weed control and waterhemp control are independent from each other. Means in the same column and row followed by the same letter are not different at α = 0.05.
b Abbreviation: PP, preplant.
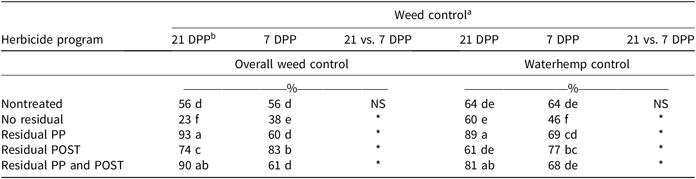
When comparing herbicide programs at different application timings, at 21 DPP, overall weed control was highest with the residual PP (93%) and residual PP and POST (90%) (Table 8). The no-residual program provided the lowest control (23% and 38% at either application timing) (Table 8). When applied 7 DPP, weed control was greatest from the residual POST program, with control of 83% (Table 8). This result is similar to those of Reddy (Reference Reddy2001), who found the POST-only herbicide program reduced total weed density by 78%, whereas the PRE-only herbicide program reduced weed density by only 54% when cover crops were terminated 14 DPP. The cover crop biomass likely prevented the PRE residual herbicides from completely reaching the soil. Weed control was higher from the no-residual program when applied 7 DPP rather than 21 DPP, with control of 38% and 23%, respectively (Table 8), likely due to the increased biomass accumulation 14 more days of growth from 21 DPP to 7 DPP. Delaying application to 7 DPP decreased weed control in the residual PP and residual PP and POST treatments (Table 8). However, the residual POST program was more effective when applied 7 DPP rather than 21 DPP, with control of 83% and 74%, respectively (Table 8). Reduced weed control at 7 DPP in the residual PP and residual PP and POST treatments was likely due to reduced herbicide activity because greater cover crop biomass prevented herbicide penetration to the soil (Figure 1B; Table 5). These results indicate that if a grower decides to include a residual herbicide with their termination application, terminating the cover crop 21 DPP will provide greater weed control because there is less cover crop biomass to intercept the residual herbicide and keep it from reaching the soil. However, for growers wanting to include the residual POST, terminating the cover crop 7 DPP will provide greater weed control.
Table 8. Influence of herbicide programs and preplant application timing on overall weed and waterhemp control 7 wk after planting.
a Mean separation for overall weed control and waterhemp control are independent from each other. Means in the same column and row followed by the same letter are not different at α = 0.05.*Significant difference at α = 0.05
b Abbreviations: DPP, days prior to planting; NS, no significant difference; PP, preplant.
Waterhemp Control
There was a cover crop species by herbicide interaction (P < 0.0001) and a herbicide by application timing interaction for waterhemp control (P < 0.0001), but no other interactions (Table 6). When comparing cover crops within different herbicide programs, waterhemp control was 94% or more in the Italian ryegrass and cereal rye plus winter vetch mix in nontreated control plots (Table 7). Across all herbicide programs, Italian ryegrass, winter wheat, oat, and the cereal rye plus winter vetch mix had the greatest waterhemp control (≥71%) (Table 7). The value of residual herbicides is shown between herbicide programs when conventional tillage was used, because the residual PP and residual PP and POST programs had the greatest waterhemp control (77% and 84%, respectively) (Table 7).
Waterhemp control from the no-residual program ranged from only 44% to 65% with all cover crop species and tillage treatments (Table 7). When the residual was applied PP, waterhemp control was similar among all cover crop treatments, with control ranging from 73% to 84% (Table 7). Compared with the no-residual program, the residual PP program for each cover crop species and tillage treatment increased waterhemp control (Table 7). When the residual herbicide was applied POST, waterhemp control ranged from 53% to 79% (Table 7). When comparing herbicide programs at different application timings, waterhemp control was highest (81% to 89%) with the residual PP and residual PP and POST programs when applied 21 DPP (Table 8). Similar results were reported by Wiggins et al. (Reference Wiggins, Hayes and Steckel2016), who found that Palmer amaranth control 28 DAA was greater when residual herbicides were used in conjunction with cover crop residue (58%) as opposed to using cover crops without residual herbicides for weed control (17%). When applied 21 DPP, the no-residual, nontreated control, and residual POST programs provided the poorest waterhemp control (60%, 64%, and 61%, respectively) (Table 8). Similar to overall weed control, waterhemp control was greater with the residual PP program when applied 21 DPP (89%) rather than 7 DPP (69%) (Table 8). However, the residual POST program was more effective when applied 7 DPP (77%) rather than 21 DPP (61%), whereas the residual PP and POST program provided greater waterhemp control when applied 21 DPP (81%) rather than 7 DPP (68%) (Table 8).
Soybean Yield
There was a significant effect of cover crop species (P < 0.0001) and herbicide program (P < 0.0001) on soybean yield, but no effect of herbicide application timing (Table 6). However, Liebl et al. (Reference Liebl, Simmons, Wax and Stoller1992) found that soybean yield was affected by cover crop termination date in all 4 yr of their study; they reported soybean yield when cereal rye terminated 2 wk before planting was higher than when cereal rye was terminated at planting, with average yields of 1,933 and 1,533 kg ha−1, respectively. No interactions (P > 0.05) were present among herbicide programs, cover crop species, and application timing for soybean yield (Table 6). Soybean yield was greatest with Italian ryegrass, cereal rye, winter vetch, tillage, oat, and winter wheat, with yield of 3,247 kg ha−1 or more (Figure 2A). Austrian winter pea, cereal rye plus winter vetch, and the no-tillage treatment resulted in the lowest yield (≤3,041 kg ha−1) (Figure 2A). Soybean yield differences in this study were likely due to reduced soybean stands in the broadleaf cover crop species, because planting into the broadleaf species was difficult due to the increased biomass accumulation. Soybean yield was greatest with the inclusion of a residual herbicide (Figure 2C). There was no difference in soybean yield between applications of a residual herbicide applied PP, POST, or PP and POST (Figure 2C).
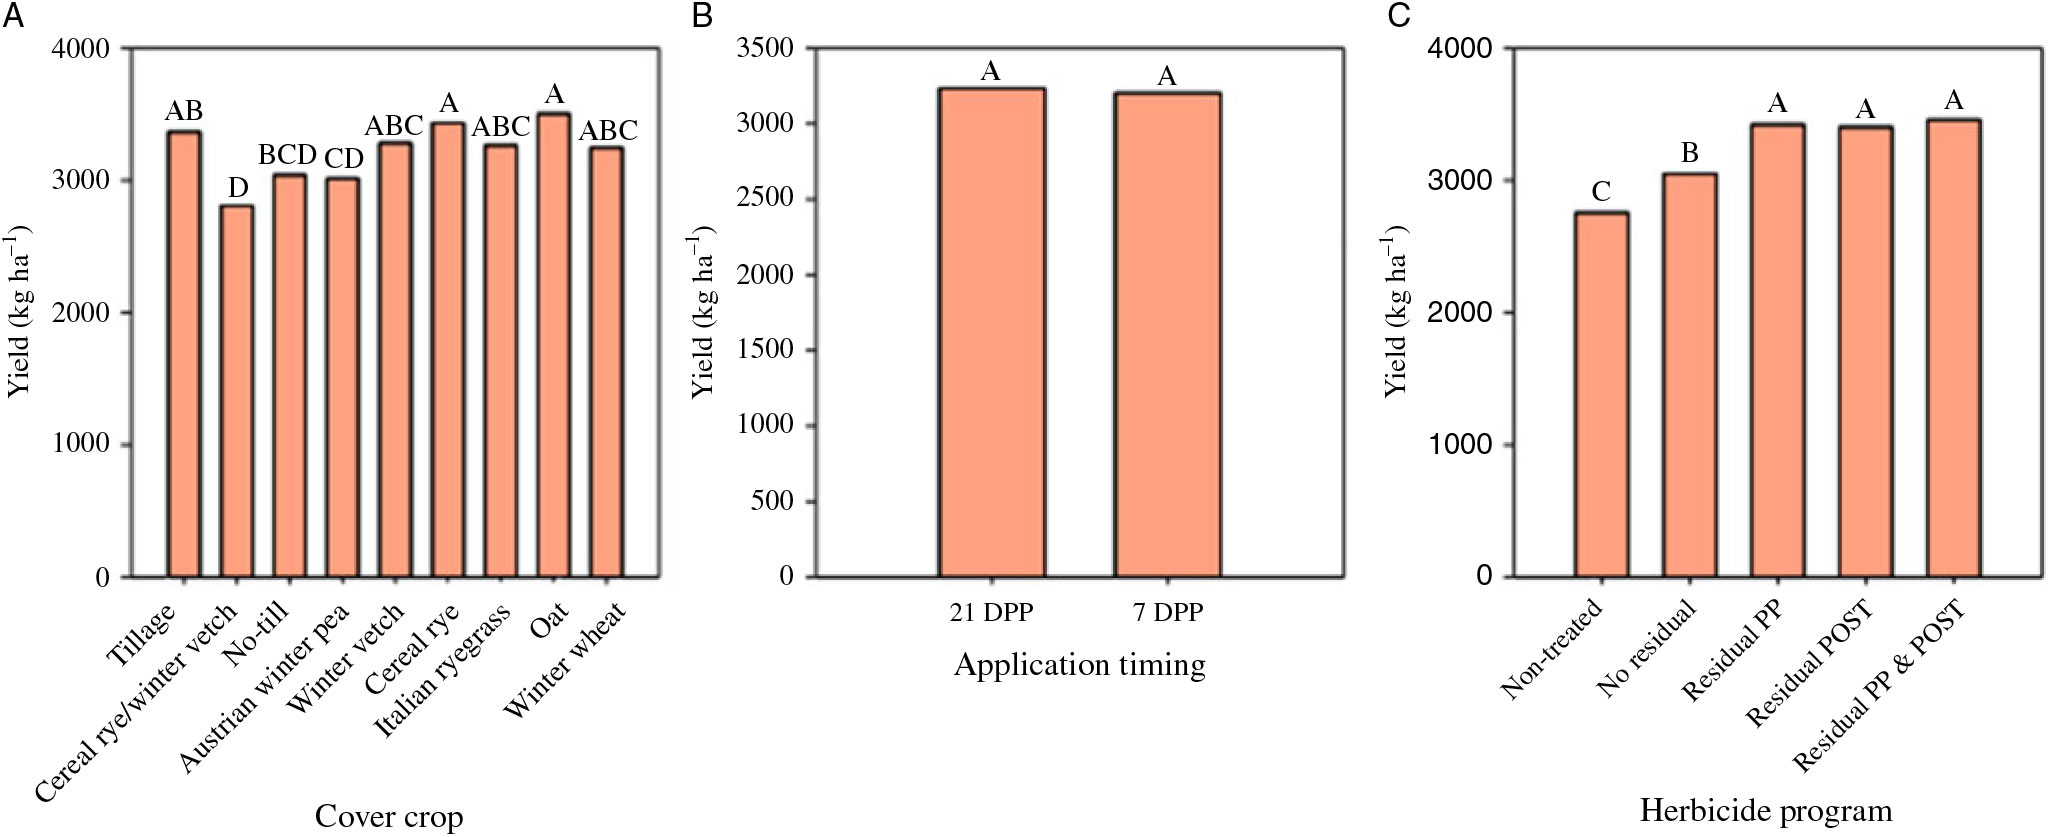
Figure 2. Influence of (A) cover crop and tillage treatments, (B) preplant herbicide application timing, and (C) herbicide program on soybean yield. Within each graph, bars with the same letter are not different at α = 0.05. DPP, days prior to planting; PP, preplant.
The results from these experiments indicate that growers can integrate residual herbicides with cover crops to eliminate an additional sprayer pass; however, applying the residual herbicide PP in conjunction with the termination application provided higher overall weed control than applying the residual herbicide POST (Table 8). The decision about cover crop and residual herbicide integration timing depends on several variables, including the targeted soybean planting date, the targeted cover crop termination application, and the amount of cover crop biomass desired before termination. In addition, growers need to consider their goals and expectations of using cover crops, and which benefits of cover crops they are targeting. Growers using cover crops for soil health and organic-matter benefits should allow for more spring biomass accumulation and should wait to apply residual herbicides POST, because greater biomass amounts will prevent herbicide penetration to the soil. In addition, cover crop seeding rates will affect the level of weed control achieved, as well as other benefits of cover crop use. For growers who desire to terminate cover crops several weeks before planting, the results from this research indicate application of a residual herbicide in conjunction with the termination application will be necessary to supplement the weed control provided by the cover crop. The amount of residual herbicide likely to reach the soil is inversely related to the biomass accumulation, because lower amounts of biomass earlier in the spring will enable higher amounts of the residual herbicide to reach the soil. Growers who prefer to terminate cover crops closer to planting will likely achieve greater weed control with application of a residual herbicide during the POST application, because greater cover crop biomass accumulation is likely to occur and consequently limit the amount of residual herbicide reaching the soil.
Acknowledgements
The authors would like to acknowledge FMC Corporation for technical assistance and the gift of analytical-grade sulfentrazone, as well as all those individuals who assisted with sample collection and processing. No conflicts of interest have been declared.