


Introduction
Palmer amaranth and waterhemp are, respectively, the number one and four most troublesome weeds in production agriculture in the United States (Van Wychen Reference Van Wychen2016). Herbicide resistance is widespread within these species, with many confirmed cases of multiple herbicide resistance (Heap Reference Heap2019; Shergill et al. Reference Shergill, Barlow, Bish and Bradley2018). A host of morphological and physiological adaptations have given pigweed increased competitiveness over crops (Ward et al. Reference Ward, Webster and Steckel2013). Densities of eight Palmer amaranth plants m−2 caused a 78% yield reduction in soybean, and 11 waterhemp plants m−2 reduced soybean yield by 56% (Bensch et al. Reference Bensch, Horak and Peterson2003); these examples emphasize the importance of controlling pigweed. In addition, the timing of pigweed emergence is even more critical than density in the prediction of yield loss in soybean (Dieleman et al. Reference Dieleman, Hamill, Weise and Swanton1995, Reference Dieleman, Hamill, Fox and Swanton1996).
An integrated approach encompassing more than just herbicides must be implemented to effectively manage these difficult-to-control weeds (Owen et al. Reference Owen, Beckie, Leeson, Norsworthy and Steckel2014). Aspects involving ecological considerations must be made for non-herbicide weed management options in soybean (Buhler et al. Reference Buhler, Gunsolus and Ralston1992) in addition to understanding the biology of each weed species (Walsh and Powles Reference Walsh and Powles2007). Although producers have little to no control over weed biology or biotypes present in a field, management practices (e.g., planting date, tillage, the use of residual herbicides) can be based around the emergence pattern of the driver weed species (Norsworthy et al. Reference Norsworthy, Ward, Shaw, Llewellyn, Nichols, Webster, Bradley, Frisvold, Powles, Burgos, Witt and Barrett2012). Furthermore, the density and timing of pigweed emergence can be influenced by the presence of crop residues, canopy, or tillage, as well as seasonal variation, which can make the prediction of pigweed emergence difficult (Jha and Norsworthy Reference Jha and Norsworthy2009; Refsell and Hartzler Reference Refsell and Hartzler2009).
Narrow row width (NRW; i.e., <76 cm) increases soybean tolerance of early-season weeds when compared with wide row spacing (Knezevic et al. Reference Knezevic, Evan and Mainz2003). Using NRW increases light interception (LI), enhances canopy development by the crop (Elmore Reference Elmore1998; Shibbles and Weber Reference Shibbles and Weber1966; Yelverton and Coble Reference Yelverton and Coble1991), and is recognized as a means of weed suppression (Buhler and Hartzler Reference Buhler, Hartzler, Boerma and Specht2004). NRWs have been reported to decrease late-season waterhemp density in soybean (Schultz et al. Reference Schultz, Myers and Bradley2015). Conversely, several studies have reported mixed results in terms of pigweed suppression with the use of NRW, compared with wide row widths, with only reductions in late-season pigweed biomass and little to no early-season benefits being reported (Bell et al. Reference Bell, Norsworthy, Scott and Popp2015; Butts et al. Reference Butts, Norsworthy, Kruger, Sandell, Young, Steckel, Loux, Bradley, Conley, Stoltenberg, Arriaga and Davis2016). Productive LI by the crop has been described as cumulative intercepted photosynthetically available radiation (CIPAR). Optimal soybean yield has been achieved as CIPAR levels reach 450 MJ m−2 (De Bruin and Pedersen Reference De Bruin and Pedersen2009). Therefore, factors that could increase CIPAR (e.g., NRW, plant density) could influence grain yield through LI. In contrast, Butts et al. (Reference Butts, Norsworthy, Kruger, Sandell, Young, Steckel, Loux, Bradley, Conley, Stoltenberg, Arriaga and Davis2016) found that CIPAR was not correlated to end-of-season pigweed growth or fecundity.
Cover crops (CCs) can suppress Palmer amaranth and waterhemp emergence and growth in soybean (Cornelius and Bradley Reference Cornelius and Bradley2017; DeVore et al. Reference DeVore, Norsworthy and Brye2013; Loux et al. Reference Loux, Dobbels, Bradley, Johnson, Young, Spaunhorst, Norsworthy, Palhano and Steckel2017). When implemented as part of a system, CCs should be combined into a planned PRE followed by POST residual herbicide program (Cornelius and Bradley Reference Cornelius and Bradley2017; Loux et al. Reference Loux, Dobbels, Bradley, Johnson, Young, Spaunhorst, Norsworthy, Palhano and Steckel2017). When selecting a CC to manage summer annual weeds such as Palmer amaranth and waterhemp, preference should be given to CC species producing ample biomass to generate adequate ground cover (e.g., cereal grasses) to reduce subsequent weed germination and emergence (Cornelius and Bradley Reference Cornelius and Bradley2017; Smith et al. Reference Smith, Reberg-Horton, Place, Meijer, Arellano and Mueller2011).
Row-crop cultivation in soybean is commonly recognized as an integrated weed management practice (Buhler and Hartzler Reference Buhler, Hartzler, Boerma and Specht2004) and when implemented during the critical weed-free period, reduces the impact of weeds on crop yields (Mohler et al. Reference Mohler, Marschner, Caldwell and DiTommaso2016; Peters et al. Reference Peters, Gebhardt and Stritzke1965). Although capable of providing excellent weed control between rows, row-crop cultivation does not control weeds in the crop row (Jordan et al. Reference Jordan, Coble, Wax and Wilcox1987; VanGessel et al. Reference VanGessel, Schweizer, Wilson, Wiles and Westra1998) and is better suited to fields with sparse weed densities (Buhler et al. Reference Buhler, Gunsolus and Ralston1992; Dieleman et al. Reference Dieleman, Mortensen and Martin1999). Historically, row-crop cultivation has been linked with conventional tillage systems and could result in substantial soil erosion concerns (Buhler et al. Reference Buhler, Doll, Proost and Visocky1995; Teasdale and Rosecrance Reference Teasdale and Rosecrance2003). The use of row-crop cultivation has decreased because of herbicide-resistant crops (e.g., glyphosate), personal preference, and adoption of no-tillage with an increased emphasis on soil and water conservation (Peterson Reference Peterson1999; Price et al. Reference Price, Balkcom, Culpepper, Kelton, Nichols and Schomberg2011). Widespread herbicide resistance and improved equipment have prompted the combination of row-crop cultivation and CC residues with no-till systems as a weed management option and provide a way to mitigate soil conservation concerns (Buhler Reference Buhler1995; Keene and Curran Reference Keene and Curran2016).
Herbicide applications to manage difficult-to-control weeds should be implemented as part of a diverse integrated weed management program (Shaner Reference Shaner2014) and should contain multiple components, such as sequential applications of residual herbicides (Chahal et al. Reference Chahal, Ganie and Jhala2018; Sarangi and Jhala Reference Sarangi and Jhala2018; Sosnoskie and Culpepper Reference Sosnoskie and Culpepper2014; Steckel et al. Reference Steckel, Sprague and Hager2002). In addition, treatments should be planned that contain multiple effective sites of action for those species that are most likely to develop herbicide resistance (e.g., Palmer amaranth and waterhemp) as a best management practice (Norsworthy et al. Reference Norsworthy, Ward, Shaw, Llewellyn, Nichols, Webster, Bradley, Frisvold, Powles, Burgos, Witt and Barrett2012).
Integrated systems should be used to manage pigweed; however, for the system to be effective at reducing the risk of resistance to any one component, the efficacy of each component of the system must be understood. The objectives of this research were to (1) understand the emergence profiles of various indigenous pigweed populations in a dryland (limited rainfall, nonirrigated) setting in the presence of a winter wheat CC, and (2) evaluate four components of an integrated pigweed management system—a winter wheat CC, row-crop cultivation, NRW, and an herbicide program—on pigweed height, density, and biomass in dryland, glufosinate-resistant soybean in Kansas.
Materials and Methods
Field Locations and Winter Wheat CC Management
Field experiments were conducted in Kansas during 2017 and 2018 in Riley County near Manhattan, at the Ashland Bottoms Experiment Field (39.12567°N, 96.613488°W); in Franklin County near Ottawa at the East Central Experiment Field (38.539265°N, 95.244301°W); and, during 2018, in Reno County near Hutchinson at the South Central Experiment Field (37.931114°N, 98.029392°W), for a total of five site-years of research. The Riley and Reno County sites had an indigenous population of Palmer amaranth, whereas the Franklin County site had an indigenous population of waterhemp—both species are collectively referred to in this article as pigweed. ‘Gallagher’ winter wheat was no-till drilled at 134 kg ha−1 in 19-cm row widths at all locations in the fall of each previous year (Table 1). ‘Gallagher’ was selected because it is adapted to all locations used in this research, and for its dual-purpose (i.e., forage and grain) pedigree (Edwards et al. Reference Edwards, Calhoun, Knori, Lollato and Cruppe2014). At spring green-up, the winter wheat CC received a topdress application of 56 kg ha−1 of nitrogen in the form of urea. Termination of CC with 1,065 g ae ha−1 glyphosate (Roundup PowerMAX®; Monsanto Co., St. Louis, MO) occurred at Feekes stage 10.5.1 “anthesis” (Table 1). Aboveground biomass of the CC was harvested from a representative 0.25-m2 area at soybean planting. Samples were dried for 10 d to constant mass and weighed (Table 2).
Table 1. Winter wheat cover crop planting and termination dates, soybean planting, herbicide application, and row-crop cultivation dates, and site characteristics at experiment locations.

a Abbreviation: meq, milliequivalents.
b All soil characteristics were assessed from a 0- to 7.6-cm soil sampling depth.
c Fine-silty, mixed superactive, mesic Pachic Argiudolls.
d Fine, smectic, thermic Abruptic Argiaquolls.
e Fine, smectitic, mesic Aquertic Argiudolls.
f Fine-loamy, mixed, superactive, mesic Udic Argiustolls.
g Loss-on-ignition (Ball Reference Ball1964).
h Adjusted to 7 pH (Rich Reference Rich1969).
Table 2. Winter wheat cover crop aboveground dry biomass at soybean planting.

Pigweed Emergence Study
At all experimental locations in 2018, a non-crop pigweed emergence study was conducted on the indigenous population. The two treatments consisted of a winter wheat CC (as previously described) and no cover crop (NCC) and were arranged in a randomized complete block design with four replications per site. Squares (50 by 50 cm)were placed in each plot during March. Pigweed emergence counts were taken weekly from April through September, with pigweed seedlings terminated with glufosinate (Liberty® 280 SL; Bayer Crop Science, Research Triangle Park, NC) upon counting. When the adjacent soybean experiment was planted (Table 1), the drill was operated without soybean seed through the emergence study area to simulate the soil disturbance that would occur with soybean planting.
Pigweed emergence for each treatment was modeled with a three-parameter sigmoid regression (Equation 1):
 $$y = {a \over {1 + {\rm{exp}}({{ - \left( {x - {x_0}} \right)} \over b})}}$$
where y is the proportion of the total emerged pigweed plants, x is the day of year, a is the maximum proportion of total pigweed emergence converged on 100%, b is the slope at the inflection point, and x 0 is the day of year for 50% emergence. Differences in the regressions for CC and NCC were compared using a pairwise F-test (α = 0.05); when no differences were detected within a location, the data were pooled across CC and NCC treatments.
Soybean Establishment
Sixteen treatments consisted of all possible combinations of a CC, three soybean row widths (76, 38, and 19 cm), row-crop cultivation (76-cm row width only), and an herbicide program. Treatments were arranged in a randomized complete block design with four replications per site. Plots at all sites were 3 m wide by 9 m long. Glufosinate-resistant soybean (Credenz® ‘3841’; Bayer Crop Science) was planted with a no-till drill (Model 1590; Deere and Co., Moline, IL) at all locations at 395,000 seeds ha−1 across all row widths with drill slots being closed to accommodate the various row widths. Dates for key field operations and site characteristics are listed in Table 1. Before planting, the entire experimental area received an application of 841 g ha−1 paraquat (Gramoxone® SL 2.0; Syngenta Crop Protection, LLC, Greensboro, NC) to control any emerged pigweed. The experimental area also received an application of 135 g ha−1 clethodim (Select Max®; Valent U.S.A., LLC., Walnut Creek, CA) to control grass weeds and 75 g ha−1 chlorantraniliprole (Prevathon®; E.I. du Pont e Nemours and Co., Wilmington, DE) to control insects as needed. Daily precipitation (Table 3) and available solar radiation measurements were recorded with weather stations located less than 2.5 km from each site.
Table 3. Precipitation for each site-year during cover crop and soybean growth and development.a

a Precipitation values reflect moisture that occurred during the growth and development of winter wheat cover crop.
b The 30-yr normals from 1980 to 2010 for each location were recorded by the National Oceanic and Atmospheric Administration (Arguez et al. Reference Arguez, Durre, Applequist, Squires, Vose, Yin and Bilotta2010).
c Values calculated from 30-yr normal precipitation from the planting date for each site-year through 8 weeks after planting.
Herbicide Program and Row-Crop Cultivation Components
The herbicide program component consisted of 2-week preplant applications, PRE applications, and 3 wk after planting (WAP) POST applications. Pyroxasulfone (Zidua®; BASF Corp., Research Triangle Park, NC) at 150 g ha−1 plus 252 g ha−1 sulfentrazone and 378 g ha−1 metribuzin (Authority® MTZ DF; FMC Corp., Philadelphia, PA) were applied for the pre-plant and PRE applications, with two-thirds of the total herbicide applied 2 weeks before planting and the remainder applied PRE. The POST application consisted of 738 g ha−1 glufosinate, 1,216 g ha−1 S-metolachlor, and 266 g ha−1 fomesafen (Prefix®; Syngenta Crop Protection, LLC), plus 3,364 g ha−1 ammonium sulfate. Herbicides were applied using a four-nozzle CO2-pressurized backpack sprayer calibrated to deliver 144 L ha−1 at 241 kPa. Turbo TeeJet Induction 110015 nozzles (TeeJet Technologies, Wheaton, IL) were used for the pre-plant and PRE applications and Air Induction Extended Range 110015 nozzles (TeeJet Technologies) were used for the POST application. For the row-crop cultivation component, a tractor-mounted, three-shank row-crop cultivator (Model 6200; Bison Industries Inc., Norfolk, NE) with a 46-cm–wide sweep per shank was operated 5-cm deep at 6.4 km h−1 approximately 2.5 WAP.
Pigweed Data Collection and Analyses
Pigweed height, density, and biomass were recorded at 3 and 8 WAP from representative 0.25-m2 areas within each plot. Biomass was dried at 65 C for 10 d to constant mass and weighed. Pigweed data were analyzed using the Mixed Procedure in JMP Pro 14 (SAS Institute, Cary, NC) and means were separated using Fisher protected LSD at α = 0.05. Treatment was considered as a fixed effect and replication as the random effect. Pigweed height, density, and biomass data were assessed for basic assumptions of ANOVA; waterhemp density data at both observation timings were log transformed to better meet assumptions of ANOVA with all means back transformed for discussion. When no site-year-by-treatment interactions were detected within a weed species, site-year was considered a random effect with replication nested within site-year. Contrasts of a single degree of freedom were applied to compare groups of treatments, which excluded the row-crop cultivation component, to assess the effects of NRW (i.e., 38- and 19-cm row widths) and CC within each data set.
In a separate analysis, pigweed biomass data collected 8 WAP from CC and NCC treatments were expressed as a percentage of average pigweed biomass within each site-year, pooled across site-years, and subjected to linear regression across row widths. The slope of the linear regression was compared with a slope of zero with a pairwise F-test (α = 0.05) in GraphPad Prism 5.0 (GraphPad Software, San Diego, CA).
Soybean LI and CIPAR Assessments and Analyses
Soybean LI was assessed weekly from emergence through 91 d after emergence (DAE) to understand the influence of soybean management factors (e.g., NRW, CC) on canopy development. Digital images were taken from the same area within each plot with a camera mounted on a 1.8-m pole and oriented 65° from the ground (Butts et al. Reference Butts, Norsworthy, Kruger, Sandell, Young, Steckel, Loux, Bradley, Conley, Stoltenberg, Arriaga and Davis2016). LI was only measured in plots containing the herbicide-program component within each row width and CC or NCC combination. Other treatments contained pigweed plants that would interfere with soybean LI and CIPAR calculations.
Each digital image was processed with TurfAnalyzer software (Green Research Services, LLC, Fayetteville, AR) to calculate the percentage of LI in each image. LI from this method produces equivalent results to those obtained from a line quantum sensor (De Bruin and Pedersen Reference De Bruin and Pedersen2009; Purcell Reference Purcell2000). A three-parameter exponential model (Equation 2) was fit to the LI data:
 $$LI = L{I_0} + \left( {L{I_{plateau}} - L{I_0}} \right) \times (1 - {e^{\left( { - Kx} \right)}})$$
where LI is expressed as a percentage, x is DAE, LI 0 is the LI at x 0, LI plateau is the LI at x infinite, and K is the rate constant expressed in the reciprocal DAE. Seasonal LI patterns were compared among row widths and CC versus NCC using a pairwise F-test (α = 0.05) in GraphPad Prism 5.0.
The ability of the soybean canopy to capture available solar radiation for photosynthesis was calculated as shown in Equation 3:
 $$CIPA{R_t} = \mathop \sum \nolimits_t^{} \left[ {daily\,total\,solar\,radiation \times 0.5 \times daily\,LI} \right]$$
where the unit of measure for CIPAR is megajoules (MJs) m−2, t is DAE, daily total solar radiation is MJ m−2 of incoming radiation for each location, and daily LI is the LI for the soybean canopy each day (De Bruin and Petersen 2009; Edwards et al. Reference Edwards, Purcell and Karcher2005; Purcell et al. Reference Purcell, Bass, Reaper and Vories2002). To estimate LI on days when images were not taken, daily solar radiation was calculated from quadratic models from each plot. The CIPAR was summed for each treatment from soybean emergence through 91 DAE. These CIPAR data were analyzed as a two-way factorial with the fixed effects of row width and with or without CC.
Results and Discussion
Pigweed Emergence Study
In the absence of soybean, a season total emergence of 1,056 and 2,820 Palmer amaranth plants m−2 were observed with CC and NCC, respectively, at the Riley County site in 2018, indicating that CC resulted in a 62% reduction in density (Table 4). When the emergence patterns of Palmer amaranth were compared between CC and NCC treatments, no differences were detected (P = 0.1885). At the Reno County site during 2018, CC resulted in a 46% reduction in Palmer amaranth emergence with 844 and 1,568 Palmer amaranth plants m−2 emerged throughout the season in the CC and NCC treatments, respectively. The emergence patterns between CC and NCC were different (P < 0.0001) (Figure 1). The CC treatment at the Reno County site achieved 80% emergence on June 20, whereas the NCC treatment achieved 80% emergence on July 14, which greatly extended the emergence period in the absence of the winter wheat CC residue. Palmer amaranth emergence at the Reno County site was extended compared with emergence at the Riley County site, which could be due to differences in rainfall (Table 3), changes in temperature at the soil surface, or other environmental conditions, as well as differences in biotypes present at each location.
Table 4. Total pigweed emergence, parameter estimates, and model fit values using Equation 1 and predicted calendar dates for 20% and 80% pigweed emergence with (CC) or without (NCC) a winter wheat CC in the absence of soybean at experiment sites during 2018.

a Abbreviations: CC, winter wheat cover crop; df, degrees of freedom; DOY, day of year; NCC, no cover crop.
b Parameter estimates: a is the maximum proportion of total pigweed emergence set to 100%; b is the slope at the inflection point; x 0 is the DOY for 50% pigweed emergence.
c Significance of pairwise F-test comparing the emergence patterns between the two treatments. If the regression curves were nonsignificant, the data were pooled within the location.
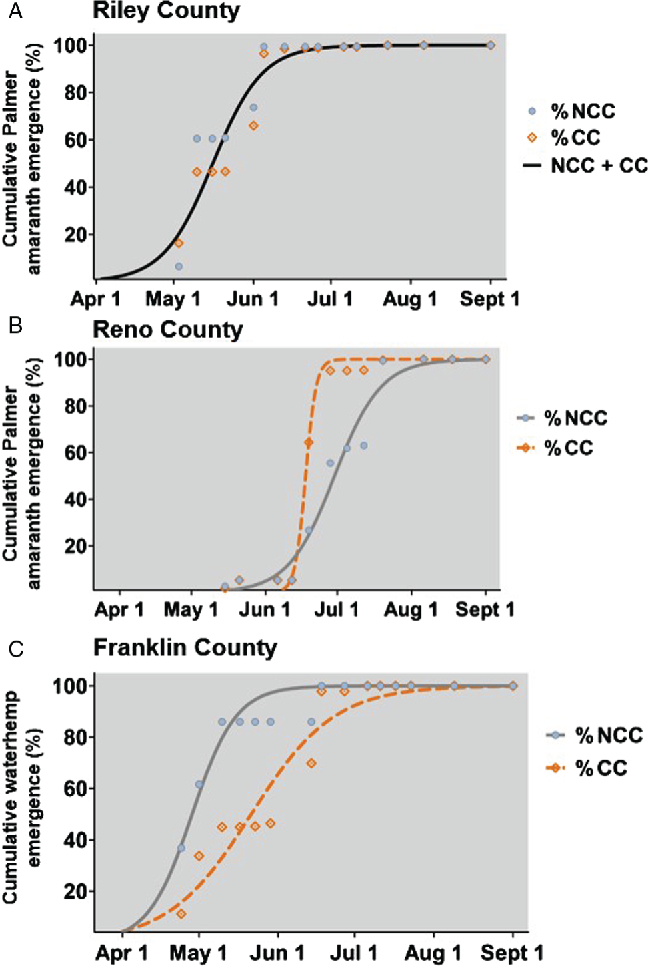
Figure 1. Pattern of indigenous pigweed emergence study in the absence of soybean for winter wheat cover crop (CC) and no cover crop (NCC) treatments at (A) Riley County site with Palmer amaranth (B) Reno County site with Palmer amaranth, and (C) Franklin County site with waterhemp. Regression parameters are described in Table 4.
The CC treatment at the Franklin County site during 2018 resulted in nearly a six-fold increase (4,376 vs. 664 plants m−2) in seasonal waterhemp emergence compared with NCC (Table 4). The presence of CC biomass also extended the waterhemp emergence pattern compared with the NCC treatment, with 80% seasonal emergence observed by May 17 for NCC and June 14 for CC. The greater density of total waterhemp in CC is contradictory to that reported in previous research in which cereal CCs have been documented to decrease waterhemp density (Cornelius and Bradley Reference Cornelius and Bradley2017; Loux et al. Reference Loux, Dobbels, Bradley, Johnson, Young, Spaunhorst, Norsworthy, Palhano and Steckel2017). Late-season observations of CC residues compared with early-season measurements have been documented to have greater weed densities compared with those taken in early season or when nitrogen was released from leguminous CCs, which may have stimulated more emergences (Cornelius and Bradley Reference Cornelius and Bradley2017; Webster et al. Reference Webster, Scully, Grey and Culpepper2013). The Franklin County site produced more CC biomass (3,155 kg ha−1) than did the Reno County site (2,580 kg ha−1) (Table 2). The Reno County site had enough CC biomass to reduce total Palmer amaranth emergence, whereas CC at the Franklin County site could not reduce waterhemp emergence. The Riley County site produced a similar amount of CC biomass (3,520 kg ha−1) as the Franklin County site; therefore, the greater seasonal density was not related to the amount of CC biomass produced. This contrasts with research that attributed enhanced pigweed control when more CC biomass was produced (Webster et al. Reference Webster, Scully, Grey and Culpepper2013). Other environmental factors such as thermal amplitude interacting with the CC biomass, as well as soil surface moisture retention beneath the CC, could be linked to the increased emergence in the CC treatment. The soil texture at the Franklin County site contained substantially less sand than the other locations (Table 1), which could have retained more moisture in the CC compared with the NCC after a rain event and encouraged more waterhemp emergence.
The paraquat application at soybean planting controlled approximately 65% of the seasonal Palmer amaranth emergence at the Riley County site, but less than 2% of the seasonal Palmer amaranth emergence at the Reno County site, simply due to emergence patterns relative to paraquat application date (Table 4). At the Franklin County site, 70% and 98% of seasonal waterhemp emergence in the CC and NCC, respectively, was controlled with the paraquat application. At the Riley and Franklin County sites, this herbicide application at planting controlled the emerged weeds and substantially reduced the total number of pigweed plants that would emerge to compete with the soybean. Controlling emerged weeds before the emergence of the cash crop is recognized as a strategy to reduce early-season competition and reduce the risk of herbicide resistance (Norsworthy et al. Reference Norsworthy, Ward, Shaw, Llewellyn, Nichols, Webster, Bradley, Frisvold, Powles, Burgos, Witt and Barrett2012).
Pigweed Height, Density, and Biomass
Treatments that included the herbicide program provided excellent pigweed control at both observation times (>97%; data not shown). Therefore, these treatments were removed, and the remaining eight treatments were analyzed for effects of CC, row width, and row-crop cultivation on pigweed height, density, and biomass. No year-by-treatment interactions were detected (α = 0.05) for Palmer amaranth height, density, or biomass at 3 and 8 WAP at the Riley County site. At 3 WAP, row-crop cultivation or NRW plus CC resulted in the greatest reductions in Palmer amaranth density compared with the 76-cm NCC treatment (Table 5), whereas NRW in the absence of CC did not reduce Palmer amaranth density or biomass compared with the 76-cm NCC treatment. Contrasts at 3 WAP revealed that NRW did not reduce Palmer amaranth density or biomass, whereas CC reduced density by 53% and reduced Palmer amaranth biomass by 76%. These data suggest a CC could reduce the selection pressure for herbicide-resistant biotypes by reducing the total number of individual plants exposed to the POST herbicide application.
Table 5. Influence of soybean row width, winter wheat CC, and RC on Palmer amaranth height, density, and biomass at Riley County site averaged across 2017 and 2018.

a Abbreviations: –, no CC or RC was present in the treatment; CC, winter wheat cover crop; NS, not significant; RC, row-crop cultivation; WAP, weeks after planting.
b Means followed by the same letter within a column are not statistically different according to Fisher protected LSD (α = 0.05).
c The 3 WAP height data for means and contrasts were NS and so are not shown.
d All contrasts were conducted in the absence of RC-containing treatments.
e P = 0.1 to 0.05
f P = 0.05 to 0.01
g P = 0.01 to 0.0001
h P < 0.0001
At 8 WAP at the Riley County site, treatments with multiple components reduced Palmer amaranth density compared with the 76-cm NCC treatment. When individual components such as row-crop cultivation alone, NRW alone, or CC in the absence of NRW were compared with the 76-cm NCC treatment, similar densities were observed (Table 5). Contrasts for density and biomass 8 WAP indicated the use of NRW did not improve control. CC resulted in a 49% reduction in density and 24% reduction in biomass compared with NCC across all row widths. The reduction in late-season pigweed density has been reported as a benefit of CCs in soybean (Cornelius and Bradley Reference Cornelius and Bradley2017; Loux et al. Reference Loux, Dobbels, Bradley, Johnson, Young, Spaunhorst, Norsworthy, Palhano and Steckel2017).
At the Reno County site, Palmer amaranth data could not be combined with either of the Riley County site-years; therefore, the site-year was analyzed alone. No Palmer amaranth was present at 3 WAP (data not shown), likely due to the lack of moisture to trigger emergence (Table 3). Even though no Palmer amaranth was present, row-crop cultivation was still implemented 2.5 WAP. By 8 WAP, no differences in Palmer amaranth density were found, which indicated that row-crop cultivation did not affect the Palmer amaranth emergence, compared with other treatments at the Reno County site (Table 6). This finding demonstrates that the soil disturbance caused by row-crop cultivation did not stimulate additional emergence compared with treatments that did not receive row-crop cultivation, which contrasts with prior research that indicated row-crop cultivation could increase weed emergence because of soil disturbance (Forcella and Lindstrom Reference Forcella and Lindstrom1988). The lack of additional emergence after row-crop cultivation in this site-year may have been due to the lack of moisture and to the drier climate, which is common across Kansas. Additional suppression in height was expected from the physical interference with CC biomass; however, the suppression at 8 WAP from row-crop cultivation was not anticipated, because no Palmer amaranth plants emerged at 3 WAP, indicating that consequences of row-crop cultivation at 2.5 WAP delayed Palmer amaranth emergence and subsequent growth when emergence occurred between 3 and 8 WAP. It is possible that the soil disturbance from row-crop cultivation altered the emergence pattern, decreased available moisture, or facilitated other environmental interactions reducing Palmer amaranth height compared with the treatment including both 76-cm row width and no row-crop cultivation. Contrasts reveal that NRW did not reduce Palmer amaranth height, but a 42% reduction in biomass was observed when the row width was decreased from 76 to 19 cm (Table 6).
Table 6. Influence of soybean row width, winter wheat CC, and RC on Palmer amaranth height and biomass at 8 WAP in Reno County during 2018.

a Abbreviations: –, no CC or RC was present in the treatment; CC, winter wheat cover crop; NS, not significant; WAP, weeks after planting.
b The 3 WAP data are not included because Palmer amaranth had not emerged. The 8 WAP density data for means and contrasts were NS and are not shown.
c Means followed by the same letter within a column are not statistically different according to Fisher protected LSD (α = 0.05).
d All contrasts were conducted in the absence of RC-containing treatments.
e P = 0.05 to 0.01
f P = 0.01 to 0.0001
Year-by-treatment interactions (P > 0.05) for waterhemp height, density, or biomass at 3 and 8 WAP were not observed at the Franklin County site, so data for the 2 years were combined (Table 7). By 3 WAP, greater waterhemp densities were observed in CC than NCC treatments, which was opposite to what was expected. No differences were detected between the 76- and 38-cm row widths within CC and NCC; however, the 19-cm row width plus CC resulted in greater densities than the 19-cm NCC treatment, also completely opposite to what was expected. Even though the presence of CC increased waterhemp density, similar low waterhemp densities were observed in the row-crop cultivation alone (24 plants m−2) or when combined with CC (30 plants m−2). Contrasts revealed that decreasing row widths did not change waterhemp density, but CC actually increased waterhemp density by 67% compared with NCC. Similarly, waterhemp biomass increased by 101% at 3 WAP with CC compared with NCC treatments (Table 7).
Table 7. Influence of soybean row width, winter wheat CC, and RC on waterhemp density and biomass at 3 and 8 WAP in Franklin County averaged across 2017 and 2018.a

a Height data for means and contrasts were found to be NS and are not shown.
b Abbreviations: –, no CC or RC was present in the treatment; CC, winter wheat cover crop; NS, not significant; RC, row-crop cultivation; WAP, weeks after planting.
c Means followed by the same letter within a column are not statistically different according to Fisher protected LSD (α = 0.05).
d All contrasts were conducted in the absence of RC-containing treatments.
e P = 00.1 to 0.05
f P = 0.05 to 0.01
By 8 WAP, treatments containing row-crop cultivation resulted in the lowest waterhemp densities (15 or 16 plants m−2) but did not differ from the 76-cm NCC treatment with 30 plants m−2 (Table 7). When CC was added to the 76-cm row width but no row-crop cultivation, waterhemp density was greater, at 97 plants m−2. The use of NRW or NRW plus CC resulted in intermediate waterhemp densities (56 to 71 plants m−2) as compared with 76-cm row width with or without CC. Contrasts indicated that NRW did not influence waterhemp density at 8 WAP, and CC actually increased waterhemp density by 50% across all row widths. Within the 76-cm row-width treatments, it was clear that CC facilitated additional waterhemp emergence. CCs conserve soil moisture at the surface (Wells et al. Reference Wells, Reberg-Horton and Mirsky2014). Throughout the growing season, it was noted that treatments with a CC had more moisture at the soil surface compared with NCC treatments at the Franklin County site (personal observation). Therefore, it is possible that this created a microenvironment favoring the emergence or survival of additional waterhemp plants. Although no differences were found across treatments for waterhemp biomass 8 WAP, the contrast comparing the 76- and 19-cm row widths showed that NRW resulted in a 66% reduction in biomass, indicating that although the use of CC as an integrated management strategy failed at this location, NRW could be used as an additional integrated strategy to provide some pigweed growth suppression.
Soybean LI and CIPAR
Pairwise F-tests revealed that the LI patterns for soybean in CC and NCC within each row width were different (P < 0.0001, 0.0023, and 0.0007 for the 76-, 38-, and 19-cm row widths, respectively). The regression curves for 38- and 19-cm row widths with CC or with NCC were similar (P > 0.05), so data were pooled across NRW with CC or NCC (Table 8). The regression curves for the 76-cm row width versus NRW with CC and NCC were different (P = 0.0003 and 0.0055, respectively). The combination of CC and NRW influenced soybean LI (Figure 2) such that NRW and NCC achieved 80% LI at 57 DAE compared with the 76-cm row width and NCC, which achieved 80% LI 1 wk later. Within the CC-containing treatments, NRW achieved 80% LI 12 d ahead of the 76-cm row width plus CC treatment (Table 8).
Table 8. Parameter estimates and model fit values for Equation 2 describing LI by soybean canopy growing in different treatments of soybean row widths and winter wheat CC or NCC pooled across all site-years.

a Abbreviations: DAE, days after emergence; df, degrees of freedom; CC, winter wheat cover crop; LI, light interception; NCC, no cover crop.
b Significance of pairwise F-test comparing the emergence patterns between the two treatments. If the regression curves were nonsignificant, the data were pooled.
c Parameter estimates: LI 0 is light interception at x 0; LI plateau is light interception at x infinite; K is the rate constant expressed in reciprocal of DAE.
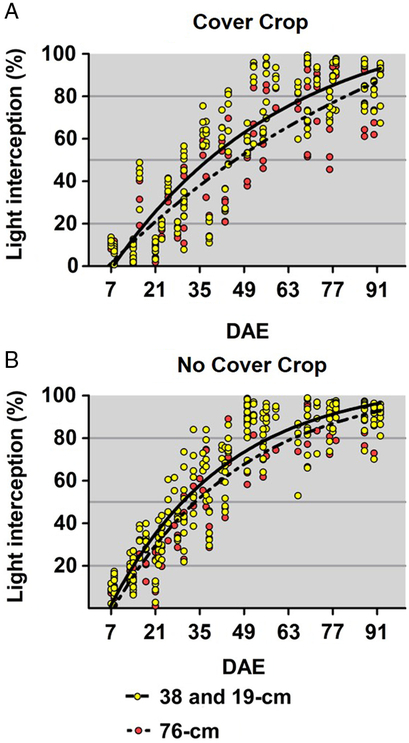
Figure 2. Percentage light interception by soybean days after emergence (DAE) for 76-, 38-, and 19-cm row widths and 76 cm within the (A) winter wheat cover crop and (B) no cover crop plots. Regression parameters are described in Table 8.
No site-year-by-treatment interactions were detected for soybean CIPAR data; therefore, CIPAR data were pooled. No interaction among row widths and use of CC was detected; subsequently, main effect of row width was not significant, whereas the use of a CC was. Lower CIPAR values (533 MJ m−2) were achieved in CC compared with NCC treatments (640 MJ m−2). There would likely be no differences in grain yield, because CIPAR values were greater than 450 MJ m−2 (De Bruin and Pedersen Reference De Bruin and Pedersen2009). The use of a CC did influence soybean phenology and, subsequently, LI. Delays in soybean canopy development because of the presence of a CC could enable late-season pigweed emergence or growth. In these data, soybean grown in the absence of a CC had enhanced LI, and pigweed emergence and growth was suppressed (Yelverton and Coble Reference Yelverton and Coble1991).
Greater LI was observed consistently with NRW and sooner than with the 76-cm row width in both CC and NCC treatments. When the early-season measurements were considered, all soybean canopies achieved 20% LI within a range of 6 d (14 to 20 DAE) (Table 8). The findings of Butts et al. (Reference Butts, Norsworthy, Kruger, Sandell, Young, Steckel, Loux, Bradley, Conley, Stoltenberg, Arriaga and Davis2016) corroborate these results; they also reported no benefit from NRW in terms of reductions in pigweed density or biomass by the time of POST application. It is likely that because of the similar level of LI for all row widths at 3 WAP, there was little to no appreciable contribution from NRW in terms of reducing pigweed height, density, or biomass across locations (Tables 5–7). In contrast, by 8 WAP, decreasing row widths resulted in reduced pigweed biomass for both CC and NCC (Figure 3). Pairwise F-test revealed that the slope was different from zero (P < 0.0001). Based on the regression, a 23% reduction in pigweed biomass was observed by decreasing the row width from 76 to 38 cm and a 15% reduction in biomass by decreasing the row width from 38 to 19 cm and was likely due to the difference in soybean LI with NRW 64 DAE (5% to 10% for 38 and 19 cm) compared with the 76-cm row width (Figure 2).

Figure 3. Pigweed biomass at 8 weeks after planting (WAP) as a proportion of the average for each site-year across three row widths. Data were described by linear regression pooled across site-years.
Practical Implications for Management
An integrated weed management system requires multiple tactics working in combination. Therefore, when developing these systems, it is imperative to understand the contribution of each component and how it integrates as a part of the system. The herbicide program in this study provided excellent pigweed control and was the most effective of the four components tested. The herbicide program included multiple facets (i.e., sequential applications, overlapping residuals, multiple effective sites of action). These aspects are proven components of any successful herbicide program (Norsworthy et al. Reference Norsworthy, Ward, Shaw, Llewellyn, Nichols, Webster, Bradley, Frisvold, Powles, Burgos, Witt and Barrett2012; Owen et al. Reference Owen, Beckie, Leeson, Norsworthy and Steckel2014). Unfortunately, in the absence of cultural or mechanical control tactics, even a robust herbicide program, albeit more sustainable than had a single site of action been used repeatedly, will inevitably result in the selection of herbicide-resistant biotypes (Evans et al. Reference Evans, Tranel, Hager, Schutte, Wu, Chatham and Davis2016; Neve et al. Reference Neve, Norsworthy, Smith and Zelaya2011; Shaner Reference Shaner2014).
Row-crop cultivation as a mechanical control tactic tended to result in better pigweed control when compared with cultural practices. The timing of row-crop cultivation when the pigweed plants were small as well as before POST herbicide application likely facilitated the success of this component. Although the integration of CC with row-crop cultivation did not improve pigweed control as compared with row-crop cultivation alone, using a CC could alleviate some soil conservation concerns that have historically discouraged the use of row-crop cultivation (Buhler et al. Reference Buhler, Doll, Proost and Visocky1995). The use of CC as a cultural control practice achieved mixed results across multiple site-years. In 3 of the 5 site-years, CC successfully reduced late-season pigweed biomass and density, thereby serving as an integrated strategy. At one location during both years, CC increased pigweed biomass and density compared with NCC, which suggests that unnecessary selection pressure would have been placed on herbicides, in addition to increasing pigweed seed production at this location. This example of inconsistent performance indicates the need for caution when using CC on a large scale, and the economic feasibility of implementing CC should be considered.
The use of NRW did not improve pigweed control 3 WAP and subsequently would not have reduced selection pressure on pigweeds with POST herbicide applications. By 8 WAP, reductions in pigweed biomass were observed with NRW, indicating that NRW should be combined as an integral strategy with other tactics as a component of an overall pigweed management system.
Acknowledgements
The authors appreciate undergraduate researchers Peter P. Bergkamp and Dakota W. Came, former graduate student Garrison J. Gundy, Assistant Scientist Cathy Minihan, and the experiment field staff for their assistance with this project. The authors appreciate financial support from the Kansas Soybean Commission to make this research possible. No conflicts of interest have been declared.


