Introduction
In the Midsouth and southeastern United States cotton-producing states, amaranth (Amaranthus spp.), large crabgrass [Digitaria sanguinalis (L.) Scop.], morningglory (Ipomoea spp.), nutsedges (Cyperus spp.), goosegrass [Eleusine indica (L.) Gaertn.], and sicklepod [Senna obtusifolia (L.) H. S. Irwin & Barneby] are the highest-ranked troublesome weeds (Van Wychen Reference Van Wychen2016). Widespread glyphosate-resistant horseweed (Erigeron canadensis L.) (Davis et al. Reference Davis, Gibson, Bauman, Weller and Johnson2007; Nichols et al. Reference Nichols, Bond, Culpepper, Dodds, Nandula, Main, Marshall, Mueller, Norsworthy, Price, Patterson, Scott, Smith, Steckel, Stephenson, Wright and York2009; Owen and Zelaya Reference Owen and Zelaya2005) and acetolactate synthase (ALS) inhibitor- and/or glyphosate-resistant Palmer amaranth in this area has reemphasized the need for integrated herbicide-resistant weed control strategies (Culpepper et al. Reference Culpepper, Grey, Vencill, Kichler, Webster, Brown, York, Davis and Hanna2006; Norsworthy et al. Reference Norsworthy, Griffith, Scott, Smith and Oliver2008; Price et al. Reference Price, Reeves and Lamm2009, Reference Price, Balkcom, Raper, Monks, Barentine and Iversen2011b). The urgent need for integrated weed management strategies was highlighted in a Weed Science journal special issue “Herbicide Resistant Weeds” containing a brief best management practice (BMP) section entitled “Cover Crops and Synthetic Mulches” (Norsworthy et al. Reference Norsworthy, Ward, Shaw, Llewellyn, Nichols, Webster, Bradley, Frisvold, Powles, Burgos, Witt and Barrett2012). In this section, authors described the need to understand diverse BMPs, including “cultural management techniques that suppress weeds by using crop competitiveness” and “using mechanical and biological management practices where appropriate.” Recent academic and U.S. Department of Agriculture–Agriculture Research Service (USDA-ARS) Amaranthus species research and state Cooperative Extension System (CES) efforts have focused on integrated cultural and chemical weed management strategies to provide effective control and reduce selection pressure for ALS-inhibitor and glyphosate resistance (Gustafson Reference Gustafson2008; Neve et al. Reference Neve, Norsworthy, Smith and Zelaya2011; Norsworthy et al. Reference Norsworthy, McClelland, Griffith, Bangarwa and Still2011; Price et al. Reference Price, Monks, Culpepper, Duzy, Kelton, Marshall, Steckel, Sosnoskie and Nichols2016). BMPs for use in integrated weed management approaches include: intensified crop rotation to disrupt reoccurring weed life cycles, conservation tillage (CT) systems that maximize cover crop residue biomass, delayed cotton planting to optimize increased soil temperatures and growing degree days advantaging cotton growth, increased scouting to identify weed emergence or management problems early, timely herbicide applications to maximize efficacy, use of diversified herbicide chemistries (including PRE herbicides) to reduce herbicide selection pressure, and intermittent inversion tillage (strategic tillage) to bury weed seed beyond successful emergence depth (Norsworthy et al. Reference Norsworthy, Ward, Shaw, Llewellyn, Nichols, Webster, Bradley, Frisvold, Powles, Burgos, Witt and Barrett2012; Price et al. Reference Price, Balkcom, Culpepper, Kelton, Nichols and Schomberg2011a, Reference Price, Monks, Culpepper, Duzy, Kelton, Marshall, Steckel, Sosnoskie and Nichols2016). The implementation of these integrated approaches and practices; however, has yet to be fully developed and subsequently adopted by producers. In addition, the increased use of tillage and subsequent decrease in CT hectarage is a major USDA–Natural Resource Conservation Service (USDA-NRCS) land resource concern due to soil-quality degradation and erosion concerns (Duzy et al. Reference Duzy, Price, Balkcom and Kornecki2015; Price et al. Reference Price, Balkcom, Culpepper, Kelton, Nichols and Schomberg2011a).
The Brazilian CT system, which maximizes cover crop residue biomass, is increasingly being adopted by producers in the United States. This CT system is characterized by terminating reproductively mature cover crops using glyphosate and mechanical flattening with a roller/crimper. This practice aims to form a dense residue biomass mat (>4,500 kg ha−1 to attain soil-quality benefits) on the soil surface, through which crop seeds are planted (Derpsch et al. Reference Derpsch, Roth, Sidiras and Köpke1991; Reeves Reference Reeves2003). However, research has shown that biomass >4,500 kg ha−1 is needed to provide substantial weed suppression (Norsworthy et al. Reference Norsworthy, McClelland, Griffith, Bangarwa and Still2011; Price et al. Reference Price, Balkcom and Arriaga2005; Teasdale and Mohler Reference Teasdale and Mohler2000). In the Midsouth and southeastern United States, winter cereal cover crops can reach anthesis and be terminated using similar practices in a timely fashion before recommended planting windows for CT cotton and other crops (Aulakh et al. Reference Aulakh, Price and Balkcom2011, Reference Aulakh, Price, Enloe, van Santen, Wehtje and Patterson2012, Reference Aulakh, Price, Enloe, Wehtje and Patterson2013; Korres and Norsworthy Reference Korres and Norsworthy2015; Mirsky et al. Reference Mirsky, Curran, Mortensen, Ryan and Shumway2011; Price et al. Reference Price, Reeves and Lamm2009; Reeves et al. Reference Reeves, Price and Patterson2005). CT high-biomass cereal rye systems can reduce weed emergence and growth over conventional or CT winter-fallow systems (Aulakh et al. Reference Aulakh, Price and Balkcom2011; Korres and Norsworthy Reference Korres and Norsworthy2015; Mirsky et al. Reference Mirsky, Curran, Mortensen, Ryan and Shumway2011; Price et al. Reference Price, Balkcom and Arriaga2005, Reference Price, Reeves and Patterson2006, Reference Price, Balkcom, Duzy and Kelton2012; Reeves et al. Reference Reeves, Price and Patterson2005; Ryan et al. Reference Ryan, Curran, Grantham, Hunsberger, Mirsky, Mortensen, Nord and Wilson2011; Shilling et al. Reference Shilling, Brecke, Hiebsch and MacDonald1996; Smith et al. Reference Smith, Reberg-Horton, Place, Meijer, Arellano and Mueller2011; Teasdale and Mohler Reference Teasdale and Mohler2000).
Cotton, due to its slow emergence and initial growth, experiences increased weed interference compared with other row crops (Buchanan and Burns Reference Buchanan and Burns1970). Because of this slow growth attribute, yield losses may be significant when problematic weeds are not controlled or suppressed in a timely manner. Currently, cotton weed management decisions are driven by the need to control resistant and troublesome weeds, as previously discussed. The critical period for weed control (CPWC) is the time interval in crop growth when a weed-free state must be maintained to prevent substantial (≥5%) yield loss (Knezevic et al. Reference Knezevic, Evans, Blankenship, Van Acker and Lindquist2002). The CPWC has two separately measured weed–crop competition components: (1) the critical timing for weed removal (CTWR; i.e., the maximum time duration the crop can tolerate early-season weed competition before incurring increasingly substantial yield loss) and (2) the critical weed-free period (CWFP; i.e., the minimum time duration from time of planting onward when a crop needs to be kept weed free to prevent substantial yield losses above a predetermined level) (Knezevic et al. Reference Knezevic, Evans, Blankenship, Van Acker and Lindquist2002; Korres and Norsworthy Reference Korres and Norsworthy2015; Williams et al. Reference Williams, Ransom and Thompson2007). The CTWR determines the beginning of CPWC, while the CWFP determines its end; the combination of both components determines the duration of CWFP. Weeds that are present before or emerge after this period do not cause significant (>5%) yield loss (Knezevic et al. Reference Knezevic, Evans, Blankenship, Van Acker and Lindquist2002). The use of cover crops managed for maximum biomass could decrease or delay weed emergence, effectively reducing the CPWC (Korres and Norsworthy Reference Korres and Norsworthy2015). Thus, a field experiment was conducted to compare how CT following high-biomass cereal rye cover crop affects CPWC and its components compared with CT following winter-fallow or conventional tillage systems.
Materials and Methods
Experimental Design
A field experiment was initiated during the fall of 2010 at the E. V. Smith Research Center Field Crops Unit (32.4417° N, 85.8974° W) near Shorter, AL, on a Compass sandy loam (coarse-loamy, siliceous, subactive, thermic Paleudults). The experimental design consisted of a split-plot treatment restriction in a randomized complete block design with four replicates. The main plots consisted of agronomic system: (1) conventional tillage without a cover crop (CVT), (2) CT following winter fallow (CT+WF), or (3) CT following a cereal rye cover crop (CT+CC) managed for maximum biomass, and subplots were various durations of naturally occurring weed interference and weed-free periods. These periods consisted of 10 durations of 0 to 70 d after planting (DAP) in 1-wk increments. Season-long weed-free and season-long weed interferencewere also included and started at 0 DAP. Weed control after each weed interference duration or for maintaining weed-free periods consisted of glyphosate applied at 1.12 kg ae ha−1 as needed throughout the experiment using a CO2-pressurized backpack sprayer equipped with 11102 XR nozzles calibrated to deliver 187 L ha−1. There were no glyphosate-resistant weeds in the experimental area during this experiment.
Crop Establishment and Management
Cereal rye ‘Wrens Abbuzi’ in the CT+CC plots was established with a no-till drill each fall at a seeding rate of 101 kg ha−1. In early spring, 34 kg N ha−1 (as NH4NO3) was applied to the cover crop to enhance biomass production. In the spring before termination, cover crop biomass samples were collected by clipping all aboveground plant parts close to the soil surface from one randomly selected 0.25-m2 section in each plot. Plant material was dried at 60 C for 72 h and weighed. All plots were then rolled with a mechanical roller-crimper before glyphosate application, as described by Ashford and Reeves (Reference Ashford and Reeves2003), to aid in cover crop termination and to provide a uniform mat of residue on the soil surface in CT+CC plots, while desiccating emerged winter weeds in CT+WF plots.
Because the experimental site had a well-developed hardpan, the entire experimental area (including the CVT treatments, to eliminate the chance of a deep-tillage interaction) was in-row subsoiled before cotton planting with a narrow-shank parabolic subsoiler (Parabolic subsoiler, KMC, Tifton, GA) equipped with pneumatic tires to close the subsoil channel. This equipment minimally disturbed residue and soil in a 5-cm-wide planting zone. Two disking passes and multiple field cultivator passes were then performed in the CVT plots.
Cotton ‘Stoneville 4427 B2RF’ (Stoneville Pedigreed Seed Company, Inc., MO, US/Bayer CropScience) was planted on May 17, 2010, and May 17, 2012, respectively. All plots received 47 kg N ha−1 as a starter in the form of NH4NO3, before planting. An additional 67 kg N ha−1 was side-dressed as urea-ammonium nitrate.
CPWC Estimation
CPWC is a time period that is inferred rather than verified from two independently and distinctly different competition components, the CTWR and the critical weed-free period (CWFP) that determine the beginning and the end of CPWC, respectively (Knezevic et al. Reference Knezevic, Evans, Blankenship, Van Acker and Lindquist2002; Weaver Reference Weaver1984). It is evaluated by typically fitting a logistic model to CTWR data and a Gompertz model to CWFP data. The first step is the choice of an acceptable level of yield potential (i.e., relative yield for both CTWR and CWFP in relation to season-long weed-free treatment) for both the beginning and end of the CPWC. Usually, an acceptable yield response is 95% (Blankenship et al. Reference Blankenship, Stroup, Evans and Knezevic2003; Knezevic et al. Reference Knezevic, Evans, Blankenship, Van Acker and Lindquist2002). Relative yield was then regressed as a function of timing of weed removal/interference. Once the nonlinear regression models corresponding to CTWR and CWFP are fit, the CPWC is estimated.
Therefore, CPWC for each of the CVT, CT+WF, and CT+CC treatments was evaluated as described by Knezevic et al. (Reference Knezevic, Evans, Blankenship, Van Acker and Lindquist2002), Williams et al. (Reference Williams, Ransom and Thompson2007), and Korres and Norsworthy (Reference Korres and Norsworthy2015). More specifically, a logistic model with three parameters was fit to relative cotton yield (expressed as percentage of season-long weed-free treatment) for the evaluation of the CTWR (weedy) treatments (Equation 1).
 $$y{\equals}{a \over {1{\plus}e^{{{\minus}b(x{\minus}x_{0} )}} }}$$
In addition, a Gompertz model with three parameters (Equation 2) was employed to describe the effects of the CWFP (weed-free) on cotton relative yield.
 $$y{\equals}ae^{{e^{{{\minus}b(x{\minus}x_{0} )}} }} $$
where y is the relative yield, α is the asymptote, b is the slope of the curve, x 0 is the point of inflection, and x is time (i.e., weeks after planting). The combination of these two components represents the duration of CPWC based on yield losses of 5% for each of the experimental treatments.
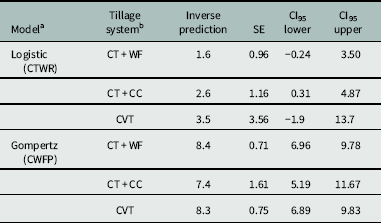
As mentioned earlier, weed removal studies evaluate the relationship between time of weed removal and relative yield crop yield, and then infer the optimum interval of weed control. Typically, these studies are designed as split plots that result in multiple error terms or other error structures (Blankenship et al. Reference Blankenship, Stroup, Evans and Knezevic2003). To strengthen the outcome of the results described in this work, an inverse prediction for 95% relative yield was performed to estimate both CTWR and CWFP for CVT, CT+WF, and CT+CC treatments.
Weed Biomass
Weed biomass production was also examined as a function of the weed removal timing and the weed-free period for each experimental treatment as it was described previously using Equations 1 and 2 (i.e., y in this instance represents weed biomass).
Data Analysis
Cotton yield data were subjected to ANOVA and means were separated using Fisher’s LSD at α=0.05 to evaluate treatment effects on actual and relative (expressed as percentage of weed-free period) cotton yield. Because there was a treatment by year interaction, subsequent statistical analysis for estimating CPWC was done and is presented separately for each experiment.
SigmaPlot v. 13.0 (Systat Software, San Jose, CA) and JMP Pro v. 13 (SAS Institute, Cary, NC) were used for ANOVAs, curve-fitting regressions, and inverse predictions and for the evaluation of the significance of model parameters. Model parameters, particularly curve asymptotes, are used for corroboration (i.e., the estimation of inverse predictions) when the value of an explanatory variable, in our case time period of CTWR and CWFP, is predicted given a value of a response variable, in this case relative yield. Coefficient of determination (r2) was used to assess the fit of each model, whereas comparisons between model parameters were conducted to examine the influence of experimental treatments on weed biomass production.
Results and Discussion
Rye Biomass and Cotton Yield
At time of termination, rye biomass was 4,100 and 7,900 kg ha−1 in 2010 and 2012, respectively. The crop establishment treatments affected the cotton yield differently in the two years. Weed-free seed cotton yield in 2010 following rye was similar to winter fallow and conventional tillage (1,564, 1,547, and 1,523 kg ha−1, respectively). In 2012, weed-free seed cotton yield following rye was significantly less (1,543 kg ha−1) than winter fallow (2,484 kg ha−1) and conventional tillage (2,623 kg ha−1). Variability in yields following different cover crop and tillage regimes is well documented (Aulakh et al. Reference Aulakh, Price and Balkcom2011; Price et al. Reference Price, Reeves and Patterson2006, Reference Price, Balkcom, Duzy and Kelton2012).
Critical Period for Weed Control
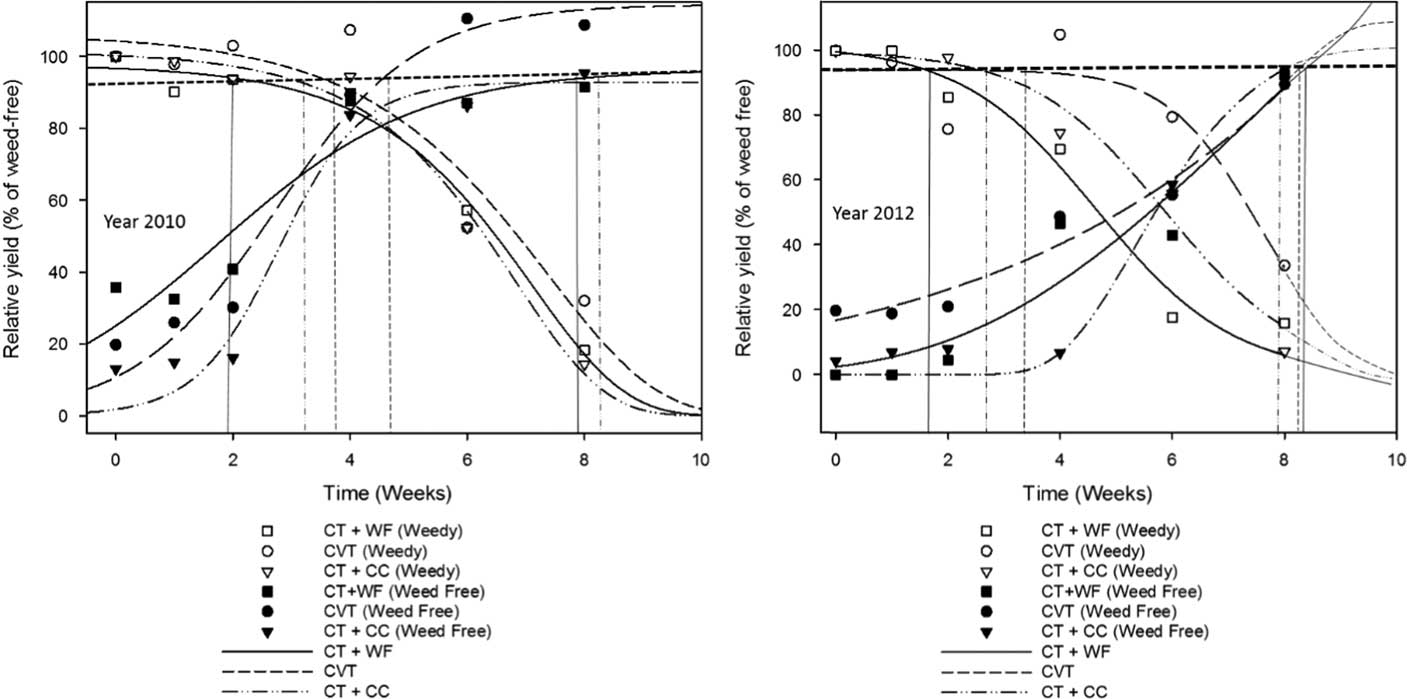
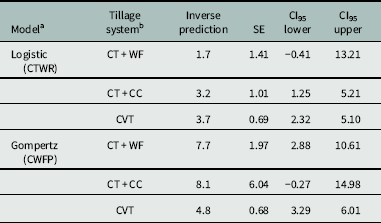
The presence of rye cover crop (i.e., CT+CC) delayed the CTWR and shortened CWFP in both experimental years. When relative yield in relation to season-long weed-free control is 95%, the predicted value of CTWR in 2010 equals 1.7, 3.2, and 3.7 WAP for CT+WF, CT+CC, and CVT, respectively. Additionally, the predicted value of CWFP at the same experimental year equals 7.7, 8.1, and 4.8 for CT, CT+CC, and CVT, respectively (Table 1). The predicted value of CTWR equals 1.6, 2.6, and 3.5 WAP, while that of CWFP for 2012 equals 8.4, 7.4, and 8.3 WAP for CT+WF, CT+CC, and CVT respectively (Table 2). In general, CTWR under CT+CC was approximately 7 to 10 d delayed compared with CT+WF, while CVT delayed CTWR about 2 wk compared with CT+WF for 2010 and 2012 (Figure 1; Tables 1 and 2), likely due to delayed weed seedling emergence (Haramoto and Gallandt Reference Haramoto and Gallandt2004; Korres and Norworthy Reference Duzy, Price, Balkcom and Kornecki2015; Teasdale Reference Teasdale1996). In 2010, seed yield loss reached 5% in less than 2 wk in the winter-fallow system in the presence of competition, while CT+CC reached 5% in 3.2 wk and CVT reached 5% in 3.7 wk. Thus, comparing CT+WF and CT+CC systems, the presence of rye delayed the beginning of CWFP about 1 wk, but did not change the duration. Similarly, in 2012, the relative order of CTWR and CWFP did not change, although there was less system influence (Figure 1; Tables 1 and 2). In 2012, CT+CC and CVT both shortened the CPWC by approximately 1.5 wk compared with CT+WF (Figure 1; Tables 1 and 2). This could offer a significant competitive advantage for cotton against weeds.

Figure 1 Critical period for weed control and its components (critical timing for weed control [CTWR; i.e., weedy] and critical weed-free period [CWFP; i.e., weed free]) for each of the conservation tillage following winter fallow (CT+WF), conventional tillage without a cover crop (CVT), and conservation tillage following a cereal rye cover crop (CT+CC) experimental treatments for 2010 and 2012. Point estimates for CTWR and CWFP for CT+WF, CT+CC, and CVT treatments are presented in Tables 1 and 2.
Table 1 Point estimates (inverse predictions), standard errors (SE) of inverse predictions, and confidence intervals (CI95) corresponding to a 5% acceptable yield loss level for the logistic and Gompertz models used to determine the beginning and end of the critical period in 2010 for weed control in cotton under three agronomic tillage systems.

a CWFP, critical weed-free period; CTWR, critical timing for weed removal.
b CT+CC, conservation tillage following a cereal rye cover crop; CT+WF, conservation tillage following winter fallow; CVT, conventional tillage without a cover crop.
Table 2 Point estimates (inverse predictions), standard errors (SE) of inverse predictions, and confidence intervals (CI95) corresponding to a 5% acceptable yield loss level for the logistic and Gompertz models used to determine the beginning and end of the critical period in 2012 for weed control in cotton under three agronomic tillage systems.
a CTWR, critical time for weed removal; CWFP, critical weed-free period.
b CT+CC, conservation tillage following a cereal rye cover crop; CT+WF, conservation tillage following winter fallow; CVT, conventional tillage without a cover crop.
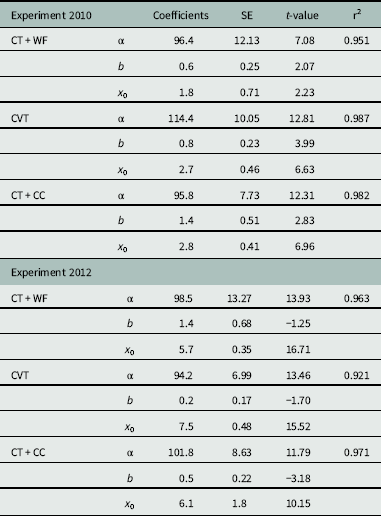
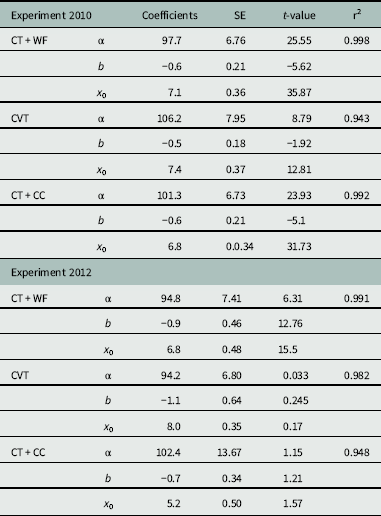
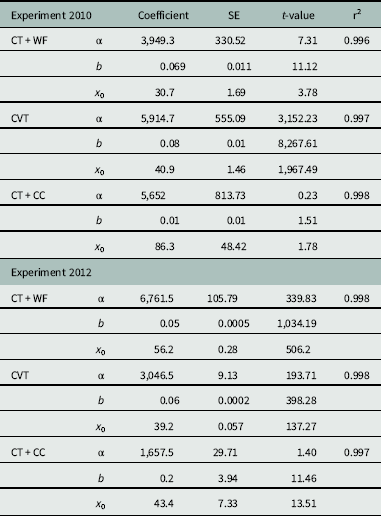
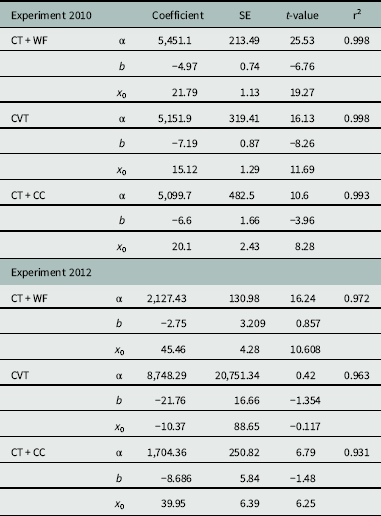
The results, as presented in Figure 1 and Tables 1 and 2, revealed the influence of CVT treatment on relative yield by extending the CTWR compared with CT+WF and CT+CC treatments (i.e., inflection point under CVT treatment equals 2.7 and 7.5 WAP, compared with 1.8 and 5.7 WAP for CT+WF and 2.8 and 6.1 WAP for CT+CC in 2010 and 2012, respectively; Table 3). The inflection point for CWFP under CVT treatment recorded at 7.4 and 8.0 wk was compared with those of CT+WF (7.1 and 6.8 wk) and rye cover crop (CT+CC; 6.8 and 5.2 wk) for 2010 and 2012, respectively (Table 4). Analysis of means for asymptote, inflection, and growth rate estimates revealed no significant differences between parameter estimates for each of the CTWR curves fit for fallow, CT, and rye cover treatments (unpublished data). Similar results were obtained for CWFP curve parameters of CT+WF, CT+CC, and CVT for 2010 and 2012.
Table 3 Statistics of the three-parameter logistic regression model (critical timing for weed removal, CTWR) used for each of the conservation tillage following winter fallow (CT+WF), conventional tillage without a cover crop (CVT), and conservation tillage following a cereal rye cover crop (CT+CC) treatments for the evaluation of the critical period of weed control.

Table 4 Statistics of the three-parameter Gompertz regression model (critical weed-free period, CWFP) used for each of the conservation tillage following winter fallow (CT+WF), conventional tillage without a cover crop (CVT), and conservation tillage following a cereal rye cover crop (CT+CC) treatments for the evaluation of the critical period of weed control.

Curve parallelism tests revealed no significant differences between CTWR or CWFP treatment curves in both years 2010 and 2012 (unpublished data), indicating a similar impact of CT+WF, CVT, and CT+CC treatment on CPWC. Previous research has reported that cover crop use in CT causes weed seedling emergence and establishment delays due to allelopathic compound releases, decreased environmental cues weed seed may require for germination initiation, or physical interference with emergence (Akemo et al. Reference Akemo, Regnier and Bennett2000; Haramoto and Gallandt Reference Haramoto and Gallandt2004; Korres and Norsworthy Reference Korres and Norsworthy2015; Peachy et al. Reference Peachy, Luna, Dick and Sattell1999; Teasdale Reference Teasdale1996; Teasdale and Mohler Reference Teasdale and Mohler1993). CPWC was found to equal 6, 4.9, and 1.1 wk in 2010 and 6.8, 4.8, and 4.8 wk in 2012 for CT+WF, CT+CC, and CVT, respectively (Figure 1; Tables 1 and 2).
Effects of Treatments on Weed Biomass Production
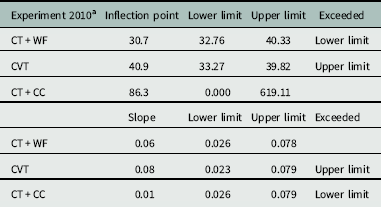
Grasses (large crabgrass and goosegrass), nutsedges (yellow nutsedge [Cyperus esculentus L.] and purple nutsedge [Cyperus rotundus L.]), sicklepod, and Palmer amaranth were the dominant weed species present during both years. In 2010, to prevent a yield loss greater than 5%, CTWR was initiated at approximately 2 WAP, and it was maintained up to 6 to 8 wk for all treatments in which weed biomass was recorded between 200 and 400 g m−2 (2,000 to 4,000 kg ha−1) (Figure 2). A similar trend was observed for 2012, although the production of the weed biomass was recorded at approximately 200 g m−2 (2,000 kg ha−1) (Figure 2). The presence of the rye cover crop (CT+CC) suppressed the production of weed biomass up to approximately 7 WAP in 2010 and 2012 compared with CT+WF and CVT treatments, a result with direct implications on weed soil seedbank. Of note is the extended period, based on inflection point evaluations, for weed removal under the rye cover crop compared with fallow and, to lesser extent, CVT treatments (Table 5). This result is particularly notable in 2010 and contributes greatly to differences between curve parallelism tests. This is an indication of whether the fitted curves between experimental treatments exhibit the same shape and/or are shifted along the x-axis. Differences between growth rate and inflection point estimates of CT+CC and CVT in comparison with CT+WF treatment (Table 6) resulted in differences of curve shape between treatments. Increased CWFP resulted in decreased weed biomass production between 2 and 5 WAP for maintaining yield losses below 5% (Figure 3). None of the model parameters evaluated for CWFP (Table 7) was significantly different between experimental treatments in both years (unpublished data), indicating the importance of CTWR for selecting the most effective treatment for yield loss prevention below the acceptable 5% level.

Figure 2 Weed biomass as a function of critical timing for weed removal (duration of weed interference with crop) under conservation tillage following winter fallow (CT+WF), conventional tillage without a cover crop (CVT), and conservation tillage following a cereal rye cover crop (CT+CC) for 2010 and 2012 treatments. Parameters of the models are presented in Table 4.
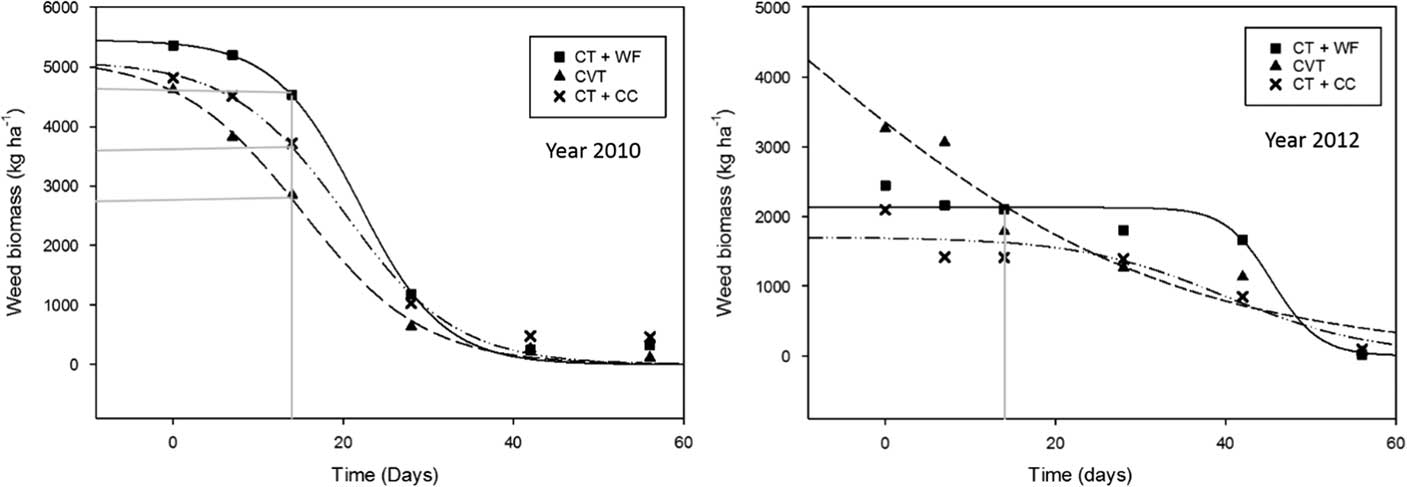
Figure 3 Weed biomass as a function of critical weed-free period under conservation tillage following winter fallow (CT+WF), conventional tillage without a cover crop (CVT), and conservation tillage following a cereal rye cover crop (CT+CC) for 2010 and 2012 treatments. Parameters of the model are presented in Table 6.
Table 5 Statistics for the three-parameter Gompertz model used for fitting weed biomass production under various weedy periods for each of the conservation tillage following winter fallow (CT+WF), conventional tillage without a cover crop (CVT), and conservation tillage following a cereal rye cover crop (CT+CC) treatments.

Table 6 Analysis of means for inflection point and slope of the curve estimates for the evaluation of the parallelism of fitted curves between experimental treatments in 2010.

a CT+CC, conservation tillage following a cereal rye cover crop; CT+WF, conservation tillage following winter fallow; CVT, conventional tillage without a cover crop.
Table 7 Statistics for the three-parameter logistic model used for fitting weed biomass production under various weed-free periods for each of the conservation tillage following winter fallow (CT+WF), conventional tillage without a cover crop (CVT), and conservation tillage following a cereal rye cover crop (CT+CC) treatments.

Practical Application
Understanding how different cultural practices affect CWFP can be valuable when making decisions about integrated weed management systems and resistant weed management (Korres and Norsworthy Reference Korres and Norsworthy2015). In this study, rye biomass suppressed early-season weed biomass and extended the CPWC, thus delaying the start of the CPWC. CPWC was found to be 6, 4.9, and 1.1 wk in 2010 and 6.8, 4.8, and 4.8 wk in 2012 for CT+WF, CT+CC, and CVT, respectively. Integrating weed-suppressive high-biomass cover crops in cotton could decrease troublesome weed interference and subsequently decrease reliance on herbicides or tillage (Price et al. Reference Price, Balkcom, Culpepper, Kelton, Nichols and Schomberg2011a). Results also indicate that systems using CT practices following winter fallow are risking greater yield loss if herbicides alone are not effective at controlling problematic weeds, compared with CT systems that include high-biomass cover crops. These results concerning CT winter fallow are similar to previous research results (Aulakh et al. Reference Aulakh, Price, Enloe, van Santen, Wehtje and Patterson2012, Reference Aulakh, Price, Enloe, Wehtje and Patterson2013; Price et al. Reference Price, Balkcom and Arriaga2005, Reference Price, Balkcom, Duzy and Kelton2012).
Acknowledgments
Mention of a trade name, proprietary product, or specific equipment does not constitute a guarantee or warranty by USDA and does not imply endorsement of a product to the exclusion of others that may be suitable. No conflicts of interest have been declared. This research received no specific grant from any funding agency or the commercial or not-for-profit sectors.