Introduction
Horseweed, also known as marestail, is a native plant to North America, where it can function as a summer or winter annual. Peak germination times have been reported to be in April or May and in late August to early September in Illinois, Massachusetts, and Tennessee (Bhowmik and Bekech Reference Bhowmik and Bekech1993; Main et al. Reference Main, Steckel, Hayes and Mueller2006; Regehr and Bazzaz Reference Regehr and Bazzaz1979). Each horseweed plant can also produce up to 200,000 seeds, which are adapted for wind dispersal and can travel over 150 m from the mother plant (Andersen Reference Andersen1993; Bhowmik and Bekech Reference Bhowmik and Bekech1993; Dauer et al. Reference Dauer, Mortensen and Humston2006). Horseweed is especially problematic in no-tillage situations, as horseweed seed readily germinates at the soil surface. Studies have shown that no seedlings will emerge if seeds are buried at a depth of 0.5 cm or deeper in the soil profile (Nandula et al. Reference Nandula, Eubank, Poston, Koger and Reddy2006).
Horseweed can be a challenging weed to control and can detrimentally affect crop yield, with reported 46% yield loss in cotton at a density of 20 to 25 plants m–2 (Steckel and Gwathmey Reference Steckel and Gwathmey2009). In soybeans, control is difficult because of the lack of effective POST herbicide options (Bruce and Kells Reference Bruce and Kells1990; Moseley and Hagood Reference Moseley and Hagood1990), which are further limited with herbicide-resistant populations. Currently, 18 countries have reported herbicide resistance in horseweed, and in the United States, horseweed is resistant to five site-of-action groups (Heap Reference Heap2018). Glyphosate-resistant horseweed was first found in Delaware in 2001, and biotypes with multiple resistances to glyphosate (WSSA group 9) and acetolactate synthase–inhibiting (WSSA group 2) herbicides have been reported in Ohio and Indiana (Kruger et al. Reference Kruger, Davis, Weller, Stachler, Loux and Johnson2008; VanGessel Reference VanGessel2001). Horseweed has also been found to be resistant to paraquat (WSSA group 22), diuron (WSSA group 7), and triazine herbicides (WSSA group 5) (Heap Reference Heap2018). Therefore, alternative horseweed control methods are necessary.
Cover crops are an alternative weed control tactic that offer two periods of potential weed suppression: first, while the cover crop is actively growing, where weeds are suppressed through competition; and second, after termination, when the cover crop residue creates a mulch layer on the soil surface (Hayden et al. Reference Hayden, Brainard, Henshaw and Ngouajio2012; Lawley et al. Reference Lawley, Weil and Teasdale2012; Mirsky et al. Reference Mirsky, Ryan, Teasdale, Curran, Reberg-Horton, Spargo, Wells, Keene and Moyer2013). This mulch layer reduces the amount of light that reaches the soil surface, reduces soil temperature, and creates a physical barrier to suppress weeds (Mirsky et al. Reference Mirsky, Ryan, Teasdale, Curran, Reberg-Horton, Spargo, Wells, Keene and Moyer2013). However, horseweed germination is unaffected by shade; therefore, reducing sunlight is not a method of suppression by cover crops (Górski et al. Reference Górski, Górska and Nowicki1977). With horseweed able to behave as a summer or winter annual, cover crops have the potential to target both germination periods (Bhowmik and Bekech Reference Bhowmik and Bekech1993; Regehr and Bazzaz Reference Regehr and Bazzaz1979).
Winter cover crops can reduce horseweed populations in the subsequent cash crop. Cholette et al. (Reference Cholette, Soltani, Hooker, Robinson and Sikkema2018) reported a 76% to 95% visible reduction of horseweed in mid-May after corn planting, and 29% to 65% horseweed reduction in September prior to harvest using grass, legume, and brassica cover crop species. Compared to the nontreated (no cover crop) check, horseweed density was reduced by 23% to 83% by cover crops, depending on the species or mixture (Cholette et al. Reference Cholette, Soltani, Hooker, Robinson and Sikkema2018). Growing a winter cover crop has been shown to reduce horseweed populations but isn’t always as effective as fall-applied herbicides. Davis et al. (Reference Davis, Gibson, Bauman, Weller and Johnson2007, Reference Davis, Kruger, Stachler, Loux and Johnson2009) reported horseweed densities of 13 plants m–2 in treatments that received fall-applied herbicides as compared to a winter wheat cover crop, which had 0.5 horseweed plants m–2, in one year. Conversely, in the following year, there was a higher horseweed density in the cover crop treatments compared to the fall-applied herbicide treatments (Davis et al. Reference Davis, Gibson, Bauman, Weller and Johnson2007, Reference Davis, Kruger, Stachler, Loux and Johnson2009).
Although fall-applied herbicides can control horseweed, control will usually not persist into the subsequent summer growing season (Davis et al. Reference Davis, Kruger, Young and Johnson2010; Owen et al. Reference Owen, Steckel, Koger, Main and Mueller2009). The efficacy of residual herbicides on horseweed suppression is variable. Herbicide dissipation will vary depending on the product applied, soil moisture, soil pH, microbial activity, and tillage (Flint and Witt Reference Flint and Witt1997; Loux and Reese Reference Loux and Reese1992; Moyer et al. Reference Moyer, Coen, Dunn and Smith2010; Shaner and Hager Reference Shaner and Hager2014; Weber Reference Weber1990). Another confounding factor for fall-applied herbicides is that most horseweed may germinate in the spring (Davis and Johnson Reference Davis and Johnson2008). Fall-applied herbicides without residual activity can result in increased horseweed populations by controlling competing winter annual weeds and therefore, decreasing competition for resources (Davis et al. Reference Davis, Kruger, Young and Johnson2010).
Mostly as a result of herbicide resistance, growers are looking for alternative options to manage horseweed. Cover crops could have a place as part of an integrated approach to suppress this weed. There is little research that evaluates different cover crop monocultures and mixtures for horseweed suppression. Therefore, the objectives of this study are to compare horseweed suppression between cover crop monocultures and mixtures and compare that to suppression from two fall-applied residual herbicides.
Materials and Methods
Study Sites
Studies were conducted in 2016–2017 in Blacksburg, VA, at Kentland Farm (37.192913° N, –80.573942° W), which is located in the New River flood plain on a Ross loam (fine-loamy, mixed, superactive, mesic Cumulic Hapludolls) with a pH of 6.7 and 4.3% organic matter, and in 2015 to 2017 in Blackstone, VA, at the Southern Piedmont Agricultural Research and Extension Center (37.082840° N, –77.972062° W) on an Appling coarse sandy loam (fine, kaolinitic, thermic, Typic Kanhapludults) with a pH of 6.4 and 3.9% organic matter.
Experimental Design
This experiment was designed as a split-split block with the main factor being a fall-planted cover crop treatment or fall-applied herbicide treatment in a randomized complete block with four replications. A no-cover-crop and no fall-applied herbicide check was included and is subsequently referred to as the nontreated check. The cover crop or herbicide treatment was first split at cover crop termination by cash crop, which was planted in either corn or soybean. These cash crop blocks were divided again on the basis of horseweed management. Horseweed was either controlled through the first 8 wk of the cash crop growing season, as described below, or left uncontrolled, with no further measures taken beyond the suppression provided by the treatments through the season (i.e., horseweed present or horseweed absent). This split allowed cash crop yields to be evaluated with and without horseweed competition. Crop yield was the only data point collected from the horseweed-absent subblock; all other data points were collected from the whole plot or horseweed-present subblock. Experimental main plots were 46.4 m2 with cash crop blocks divided into 23.2-m2 subblocks, and horseweed-controlled or horseweed-uncontrolled subblocks were 11.6 m2.
Main-factor treatments included four different cover crops in monoculture and mixtures of these cover crops, two fall residual herbicides, and a nontreated check (Table 1). Cover crops included cereal rye (Elbon South; Green Cover Seeds, Bladen, NE), forage radish (Nitroradish; Green Cover Seeds), hairy vetch (TNT; Green Cover Seeds), and crimson clover (Dixie; Green Cover Seeds). Because of a lack of seed availability in 2015, the monoculture plot of cereal rye was planted using a variety not stated (Southern States, Richmond, VA). Cover crop seeding rates and herbicide rates can be found in Table 1. The seeding rates are on the high end of recommended rates from the Virginia Natural Resources Conservation Service to conform to local incentive programs but still obtain sufficient biomass to suppress horseweed (USDA NRCS 2015).
Table 1. Cover crop and herbicide treatments with corresponding seeding and application rates.

a Included nonionic surfactant at 0.25% (v/v).
b Included crop oil concentrate at 1% (v/v).
The fall-applied residual herbicide treatments, flumioxazin+paraquat and metribuzin+chlorimuron-ethyl, were chosen because they can be applied in the fall to suppress horseweed. However, according to the label, there is a 9- to 18-mo rotation restriction to corn following metribuzin+chlorimuron-ethyl application; this restriction was not observed in this experiment. As the objective was to measure horseweed suppression, the discussion of metribuzin+chlorimuron-ethyl in the corn block was included in the Results and Discussion.
Field Management and Data Collection
The Blacksburg location was previously in corn and was planted no-till, whereas the Blackstone location was previously in sod and was prepped for planting by disking the area to create a seedbed. Both locations received a pre-plant application of glyphosate (Roundup Powermax; Monsanto Co., St. Louis, MO) at 1.26 kg ae ha–1 so that the sites were weed-free at the time of cover crop planting.
Cover crops were drilled on 16.5-cm rows to a depth of 3 to 4 cm, and herbicides were applied on October 20, 2015, in Blackstone. In 2016, treatments were applied on September 28 and October 14 in Blacksburg and Blackstone, respectively. Therefore, the study was conducted across three site-years. The fall-applied herbicides were applied with a six-nozzle boom with 46-cm nozzle spacing equipped with TeeJet (XR11002) nozzles calibrated to apply 140 L ha–1 of spray volume.
Cover crop treatments were terminated by two passes with a roller crimper 2 wk apart, with the initial pass in Blackstone on May 3, 2016. In 2017, termination occurred on April 26 and May 2 for Blackstone and Blacksburg, respectively. One pass was not enough to completely terminate the cover crop species, and the second pass improved the control of the cover crop species. Corn and soybeans were planted immediately after the second pass into the rolled cover crop residue. Corn, variety P1197AM (DuPont Pioneer, Johnston, IA) in 2016 and variety DKC62-08 (DeKalb, DeKalb, IL) in 2017, was planted at a rate of 61,775 seeds ha–1. Soybean, variety P46T21R (DuPont Pioneer, Johnston, IA) in 2016 and variety AG48X7 (Asgrow, Kalamazoo, MI) in 2017, was planted at 327,408 seeds ha–1. Both crops were planted on 76-cm rows with four rows per plot. All blocks were fertilized at planting with 56 kg ha–1 of P2O5 and K2O at planting. Corn blocks received 67 kg ha–1 of N applied at planting and again when the corn reached 0.3 m tall. Horseweed populations were endemic to the study locations and were not herbicide resistant. Horseweed-absent subblocks were maintained by spot-treating horseweed with a 2% (v/v) glyphosate solution as needed until 8 wk after cash crop planting. No other weed control measures were used in this experiment.
Horseweed density measurements were taken in late March, prior to cover crop termination, in a 0.37-m2 quadrat per plot. At cover crop termination, aboveground biomass samples from a 0.09-m2 area were collected. These samples were divided into the desired cover crop species and dried at 66 C for 3 d for mass determination. There is only one value for cover crop biomass at termination, as this sampling occurred before the whole plots were first split for cash crop planting. Visible weed suppression ratings were taken on a 2-wk interval after cash crop planting on a 0 to 100% scale, with 0 being complete infestation, based on the amount of horseweed present in the no-herbicide/no-cover-crop plot, and 100% being complete suppression of horseweed (Frans et al. Reference Frans, Talbert, Marx and Crowley1986). Ratings were discontinued when the weed suppression offered by the cover crop was negligible compared to the nontreated check.
Cash crop yield was evaluated from the middle two rows in each plot and adjusted for moisture to 15.5% for corn and 13% for soybeans. Just prior to harvest, 0.09-m2 quadrats of horseweed aboveground biomass were collected in subblocks where horseweed was not controlled during the cash crop growing season and dried to determine biomass. In 2017, 0.25-m2 quadrats were used because of lower horseweed densities.
Data analyses were conducted using JMP (JMP Pro 13; SAS Institute, Inc., Cary, NC). Effects of treatment, year, location, block, and interactions of year and location with treatment were included in the model as fixed effects. The forage radish winterkilled, and there was no biomass present past the winter to suppress horseweed. Therefore, the forage radish in monoculture treatment was excluded from all analyses. For the cover crop biomass analysis, data from the herbicide treatments and from the nontreated check were excluded, because there was no cover crop biomass in these plots. The nontreated check was excluded in the visible rating analyses. An overall model was run using ANOVA to determine whether there were significant (P<0.05) interactions. If there was not a significant interaction between year and treatment or location and treatment, data were pooled. Contrast statements were then used to answer specific questions about the ability of cover crops and fall-applied residual herbicides to suppress horseweed, according to the objectives, using α=0.05. Yield data were analyzed using the difference in yield between the horseweed-present/horseweed-absent subblocks to determine the effect of horseweed competition on yield. The model consisted of effects of treatment, year, location, block, and the interactions of year and location with treatment. Contrast statements comparing treatments and groups of treatments were then conducted using α=0.05.
Results and Discussion
Cover Crop Biomass
The interactions between year and treatment as well as location and treatment were not significant (P=0.067 and P=0.161); thus, cover crop biomass data were pooled across location and year. Overall, cereal rye produced more than double the biomass of the legume cover crop monocultures: 7,671 and 3,335 kg ha–1, respectively (Figure 1). The combined average of mixtures also produced greater biomass than the combined average of the monocultures, 7,720 kg ha–1 and 4,781 kg ha–1, respectively. This difference was driven by the legumes in monoculture, as evidenced by the lack of difference detected between cereal rye alone and the mixtures: 7,671 and 7,720 kg ha–1.
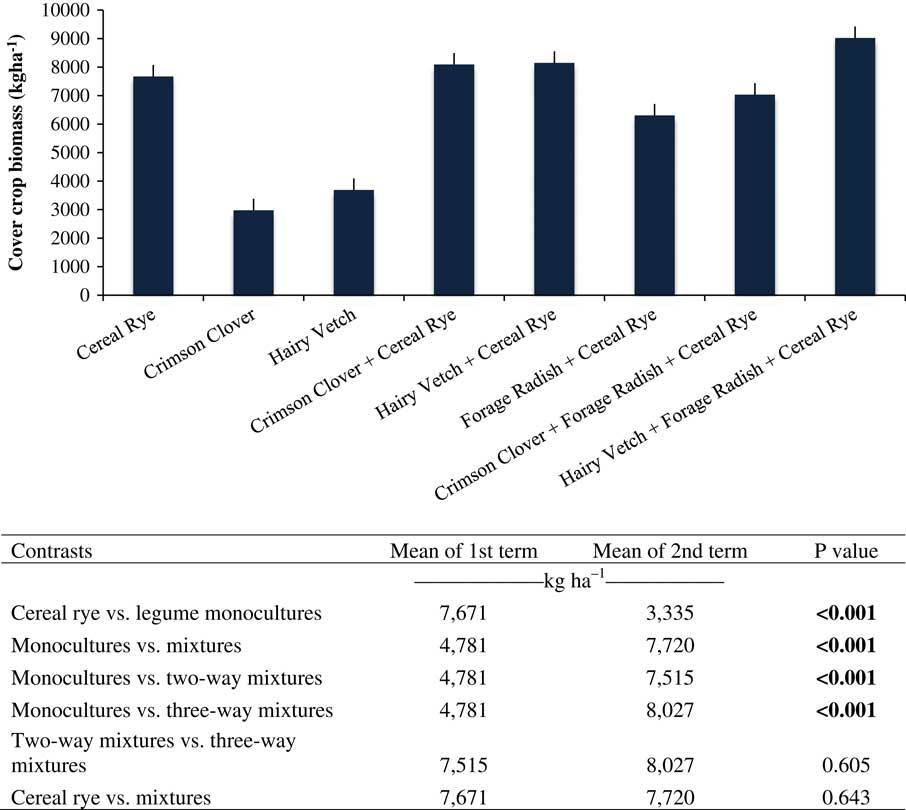
Figure 1. Cover crop biomass at termination in early May from fall-planted cover crops averaged across location and year. Means and standard errors are displayed with contrast statements shown in the table below. Significant differences (P<0.05) between means are shown in bold.
Cover crop biomass accumulation in this study is similar to that reported in Maryland, Pennsylvania, and Georgia, with most monocultures and mixtures ranging from 3,000 to 7,000 kg ha–1 (Finney et al. Reference Finney, White and Kaye2015; Mirsky et al. Reference Mirsky, Ryan, Teasdale, Curran, Reberg-Horton, Spargo, Wells, Keene and Moyer2013; Sainju et al. Reference Sainju, Whitehead and Singh2005). Wiggins et al. (Reference Wiggins, Hayes and Steckel2016) reported less biomass in Tennessee, ranging from 2,000 to 4,000 kg ha–1.
Horseweed Density before Cover Crop Termination
The interaction between year and treatment was not significant (P=0.991), but the interaction between location and treatment was significant (P<0.001). So data were pooled across year but analyzed separately by location. Horseweed density was more than threefold greater in Blacksburg than Blackstone; the nontreated check had 94.2 and 25.6 plants m–2, respectively (Figure 2). Among the herbicide treatments, flumioxazin+paraquat reduced horseweed density compared to the nontreated check, by 64% and 71% in Blacksburg and Blackstone, respectively. Plots treated with metribuzin+chlorimuron-ethyl had horseweed either similar to or more horseweed present than the nontreated check. Cover crop treatments had greater horseweed suppression when compared to the nontreated check in both locations. Horseweed density was reduced by 97% and 88% in Blacksburg and Blackstone, respectively. No difference could be distinguished between cereal rye–containing cover crop treatments and the legume cover crop treatments or between monocultures and mixtures.
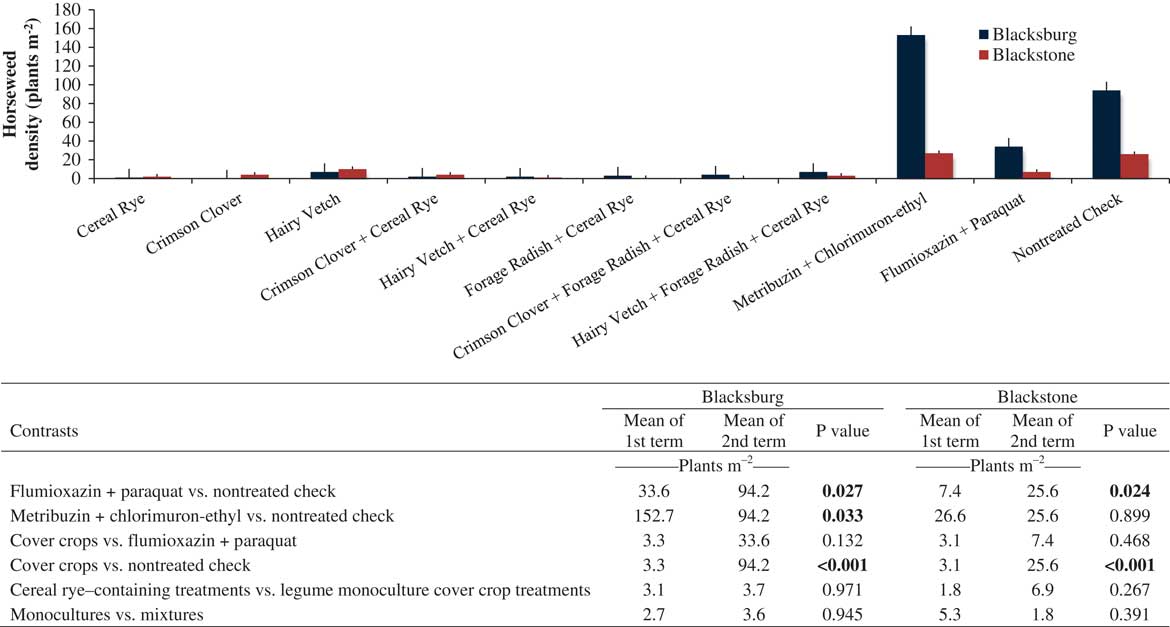
Figure 2. Horseweed density prior to cover crop termination in Blacksburg and Blackstone, VA, averaged across years. The graph above shows means and standard errors for each treatment with contrast statements in the table below. Significant differences (P<0.05) between means are shown in bold.
These findings are similar to those of Hayden et al. (Reference Hayden, Brainard, Henshaw and Ngouajio2012), who reported decreases in winter annual weed populations in the presence of actively growing cover crop. Cornelius and Bradley (Reference Cornelius and Bradley2017) also reported a decrease in winter annual weed density in the presence of cover crops compared to a no-cover check. However, Cornelius and Bradley (Reference Cornelius and Bradley2017) found greater winter annual weed suppression in the cereal rye and cereal rye+hairy vetch treatment as compared to crimson clover or hairy vetch alone. This difference was not captured in our study but is probably due to differences in weed species and their response to competition from cover crops.
Visible Horseweed Suppression
Visible horseweed suppression rating data were considered separately for the corn and soybean blocks. Data were collected at 4, 6, and 8 wk after cover crop termination (WAT). Similar trends were seen across all rating dates, so only the 6-WAT rating data are presented as this timing corresponds with 4 wk after cash crop planting, the approximate time that a POST herbicide would be applied in standard production practices. The interaction between year and treatment was significant (P=0.04) 6 WAT in corn but not in soybean (P=0.47), so data were separated by year in the corn block but pooled across year in soybean. Data from both crops were pooled across study locations.
Across both crops and years, the cover crop treatments and flumioxazin+paraquat resulted in greater horseweed suppression than the metribuzin+chlorimuron-ethyl treatment, whereas the cereal rye–containing cover crop treatments suppressed horseweed at the same level as the legume monocultures (Table 2). Flumioxazin+paraquat suppressed horseweed at a level similar to the cover crop treatments in the corn block during 2015–2016, with 43% and 55% suppression, respectively. However, in 2016–2017, flumioxazin+paraquat was not as effective in suppressing horseweed (34% suppression) compared to the cover crop treatments (95% suppression). Also, in the corn block in 2015–2016, the cover crop mixes had 50% greater horseweed suppression than the monocultures, 63% and 41%, respectively. Overall, cover crops, monocultures or mixtures, resulted in similar or better horseweed suppression than fall-applied residual herbicides.
Table 2. Orthogonal contrasts of visible horseweed suppression 6 wk after cover crop termination in the soybean and corn blocks in Blacksburg and Blackstone, VA in 2016 and 2017.

a Data were pooled across site-year for soybean but split for corn because of a significant year-by-treatment effect.
Multiple studies support the finding that cover crops suppress various summer annual weeds as compared to a no-cover check early in the cash crop growing season. Often in these studies, cereal rye and cereal rye–containing mixtures provide better suppression than legumes alone (Cornelius et al. Reference Cornelius and Bradley2017; Mohler and Teasdale Reference Mohler and Teasdale1993; Teasdale and Mohler Reference Teasdale and Mohler2000; Wayman et al. Reference Wayman, Cogger, Benedict, Burke, Collins and Bary2014). The results of this study indicate that for horseweed suppression, hairy vetch and crimson clover are able to suppress horseweed at the same level as cereal rye and cereal rye–containing mixtures.
These findings are in contrast to those of Cornelius et al. (Reference Cornelius and Bradley2017), who found that cover crops have the ability to suppress weeds throughout the soybean season as compared to a no-cover check but not more successfully than a fall herbicide program. The fall herbicide treatment used in this study was glyphosate+2,4-D+sulfentrazone+chlorimuron-ethyl (Cornelius et al. Reference Cornelius and Bradley2017), possibly accounting for the differences in weed suppression. Also, observationally, a majority of the horseweed germinated in the spring, allowing time for the herbicide to dissipate between application and horseweed germination.
Horseweed Biomass at Crop Harvest
The interaction between year and treatment was significant in corn (P=0.002) but not in soybean (P=0.207); therefore, only data from corn were analyzed separately by year. In corn in 2016–2017 and in soybean, no differences could be detected in horseweed biomass between flumioxazin+paraquat, and metribuzin+chlorimuron-ethyl when compared to the nontreated check (Figure 3). All cover crop treatments reduced horseweed biomass by 95% in corn in 2016–2017 and in soybean by 66%.
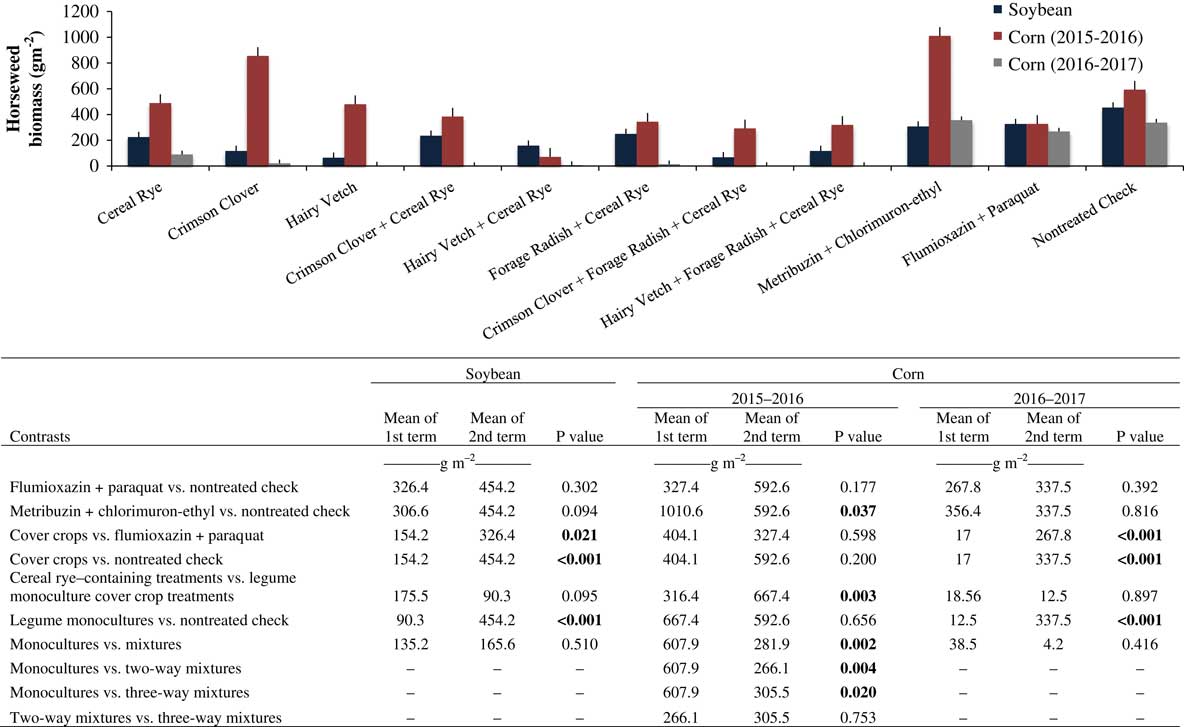
Figure 3. Horseweed biomass at harvest in corn and soybean blocks in Blacksburg and Blackstone, VA, shown graphically by means and standard error above and with contrast statements below. Significant differences (P<0.05) between means are shown in bold.
In the corn analysis for 2015–2016, different patterns of significance were noted in the contrasts from those that were significant in the corn 2016–2017 and soybean analyses (Figure 3). During the 2015–2016 experiment in the corn block, horseweed biomass was about 50% lower in cereal rye–containing treatments (316.4 g m–2), than legume cover crop treatments (667.4 g m–2). A difference was also detected in biomass between monocultures versus mixtures, with a greater than twofold increase in horseweed biomass found in the monocultures compared to the two- and three-way mixtures. The difference seen between years could be driven by the performance of the legume cover crop species, which did not provide adequate horseweed suppression and was not statistically different from the nontreated check during 2015–2016. In 2015–2016, flumioxazin+paraquat was comparable to most cover crop treatments. The next year, flumioxazin+paraquat did not provide as much suppression.
The increase in horseweed presence in the metribuzin+chlorimuron-ethyl treatment as compared to the nontreated check is similar to what Davis et al. (Reference Davis, Kruger, Young and Johnson2010) reported with horseweed populations between fall-applied glyphosate+2,4-D and their nontreated check. They noted that herbicide application controlled some winter annual weed species, which reduced competition for elements necessary for plant growth that were taken advantage of by horseweed.
Soybean and Corn Yield
For the yield analysis, contrasts were run on the difference in yield between the subblocks where horseweed was controlled for the first 8 wk of cash crop growth (horseweed absent) and where horseweed was not controlled (horseweed present) to determine the impact of horseweed competition on yield. In the analysis for both corn and soybean yield, no interactions were significant; therefore, data were pooled across locations and years.
In the corn block, yield from the horseweed-absent subblocks ranged from 2,157 to 3,845 kg ha–1, whereas yield from the horseweed-present subblocks ranged from 294 to 3,757 kg ha–1 (Figure 4). The larger variation seen in the horseweed-present subblocks is indicative of horseweed suppression or lack thereof from either the cover crop or herbicide treatment. Differences in corn yield between the cover crop treatments and the nontreated check were 668 and 2,302 kg ha–1, respectively, meaning that the impact of horseweed on yield was less in the cover crop treatments than in the nontreated check. There were no differences detected between the cereal rye–containing and legume monoculture cover crop treatments, which corroborate the suppression data. Although the rotation restriction was not met for the metribuzin+chlorimuron-ethyl prior to corn, no injury to the corn was observed, and yields were not affected (Figure 4).
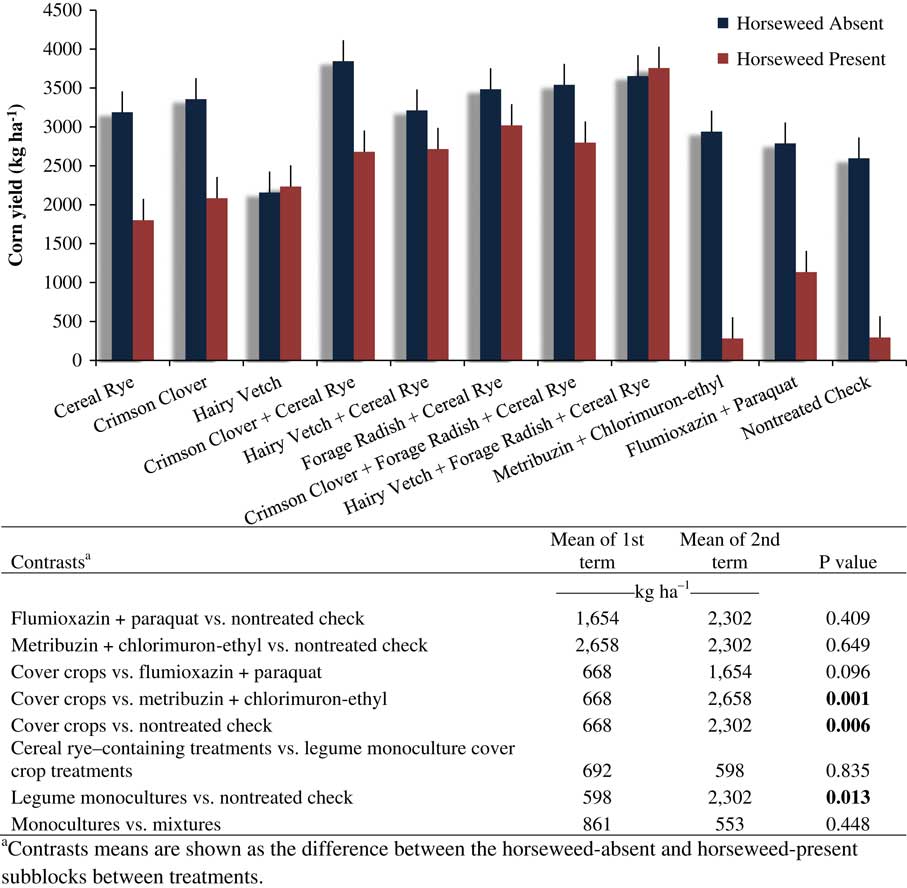
Figure 4. Corn yield from the horseweed-absent and horseweed-present subblocks in Blacksburg and Blackstone, VA, in 2016 and 2017, shown graphically above with contrast statements below. Significant differences (P<0.05) between means are shown in bold.
In soybean, yield from the horseweed-absent subblocks ranged from 656 to 1,277 kg ha–1, and yield in the horseweed-present subblocks ranged from 255 to 820 kg ha–1 (Figure 5). For the analysis of soybean yield, the only difference detected from any of the contrasts was between the legume cover crop treatments and the nontreated check, with a difference of 196 versus 615 kg ha–1, respectively, between the horseweed-present and horseweed-absent subblocks. This finding indicates the legume cover crop species were able to suppress horseweed, lowering its impact on soybean yield.
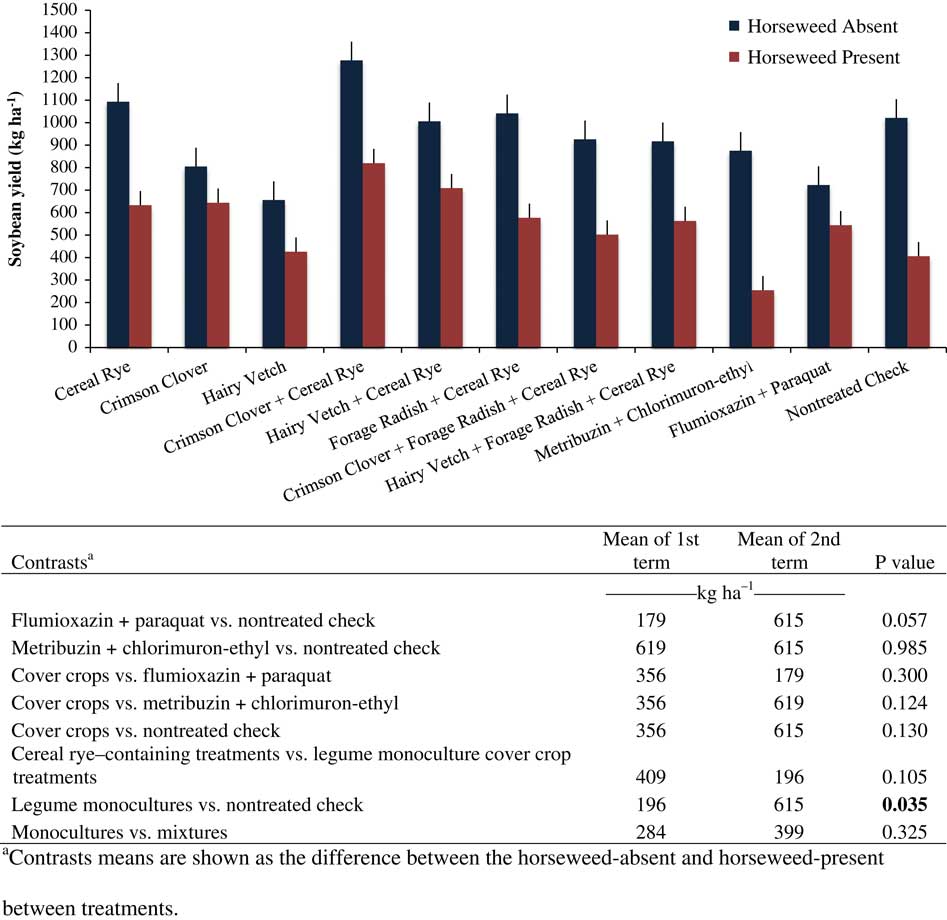
Figure 5. Difference in soybean yield between horseweed-absent and horseweed-present subblocks in Blacksburg and Blackstone, VA, in 2016 and 2017 shown graphically above with contrast statements below. Significant differences (P<0.05) between means are shown in bold.
Other research has reported that horseweed can cause losses in yield. Steckel and Gwathmey (Reference Steckel and Gwathmey2009) reported 46% yield losses in cotton with 20 to 25 horseweed plants m–2, and Trezzi et al. (Reference Trezzi, Balbinot, Benin, Debastiani, Patel and Miotto2013) reported 25% yield loss in soybeans with 13 plants m–2 of Conyza bonariensis (L.) Cronq., a species closely related to horseweed. In this experiment, corn and soybean yields were typically less between horseweed-absent and horseweed-present subblocks, with the exception of one treatment in corn (Figures 4 and 5). The contrast statements in corn also support this finding––especially the contrast between cover crops treatments and the nontreated check (Figure 4).
Some differences in horseweed suppression detected by other parameters were not reflected in soybean yield, as the only significant contrast was between legume cover crops and the nontreated check. This contrast could be due to the critical weed-free period in soybean falling later into the season as compared to the critical weed-free period for corn (Gantoli et al. Reference Gantoli, Ayala and Gerhards2013; Van Acker et al. Reference Van Acker, Swanton and Weise1993). This period occurred past when cover crops will provide the most effective weed suppression.
Research Implications
All cover crop treatments provided horseweed suppression, with the exception of forage radish alone, although that suppression did not persist throughout the cash crop growing season. At all points in which data were taken, no differences in horseweed suppression could be detected between cereal rye–containing cover crops and legume monocultures or between monocultures and mixtures, with the exception of horseweed biomass at harvest and corn yield in 2015–2016, showing that any cover crop species that develops a good stand in the fall and persists through the winter will have a suppressive effect on horseweed. This finding presents an opportunity for growers to select cover crop species based on additional ecosystem benefits, namely nitrogen fixation, rather than solely relying on a monoculture of cereal rye to suppress horseweed.
Forage radish in monoculture winterkilled and did not suppress horseweed at any point in which data were taken in this experiment. This cover crop species planted alone at the timing in this study would not provide adequate suppression of horseweed in areas where this species would winterkill. Based on these data, forage radish can be planted as part of a mixture to gain any soil or environmental benefits of the species while relying on the other species in the mixture to suppress horseweed.
The cover crops in this experiment performed as well as or better than the fall-applied herbicides at suppressing horseweed. Flumioxazin+paraquat provided control in 2015–2016 but did not perform well in 2016–2017, whereas metribuzin+chlorimuron-ethyl did not suppress horseweed in either year. Inclusion of a cover crop into an integrated weed management plan can be a tactic to suppress horseweed, including herbicide-resistant populations.
Acknowledgments
This work was supported by the Virginia Agricultural Experiment Station, the Virginia Corn Board, the United States Department of Agriculture (USDA) National Institute of Food and Agriculture, and the USDA Natural Resources Conservation Service Virginia Conservation Innovation Grant 69-33A7-16-1160. The authors would like to thank Kevin Bamber, Steven Haring, Ranjeet Randhawa, and Shawn Beam for assistance in planting and terminating cover crops and collecting data. No conflicts of interest have been declared.


