


Introduction
Regular surveillance for herbicide-resistant (HR) weeds across an agroecoregion is critical to determine the nature, distribution, and abundance of HR populations in space and time. That information creates awareness of the extent of the problem to growers and industry professionals, which, in turn, helps direct research and development as well as informing management. Random field surveys before crop harvest are necessary for accurate determination of the extent of herbicide resistance in weeds that are escaping in-crop weed control. In contrast, testing suspected HR weed seed samples submitted by growers often detects new biotypes before they are discovered in surveys, which only cover a small proportion of cultivated land. Together, random surveys and laboratory testing of submission samples provide an accurate picture of the resistance status of weed species in a jurisdiction or agroecoregion.
The Northern Great Plains of Canada (prairies) account for 87% of national crop area and also 87% of herbicide use (Statistics Canada 2017). Agronomic crops are grown on 28 million ha across the prairies. Weed-resistance monitoring in this agroecoregion has been conducted routinely since the mid-1990s. However, baseline surveys of HR weeds in randomly selected fields were first conducted across the three prairie provinces (i.e., Alberta, Saskatchewan, and Manitoba) during 2001 to 2003 (n = 800 fields) (Beckie et al. Reference Beckie, Leeson, Thomas, Brenzil, Hall, Holzgang, Lozinski and Shirriff2008). In addition, that report summarized the resistance status of nearly 1,300 weed seed samples (each sample from one field) submitted for testing by western Canadian growers or industry between 1996 and 2006.
The second round of HR weed surveys, using the same methodology as the baseline surveys, was conducted in Alberta in 2007, Manitoba in 2008, and Saskatchewan in 2009, totaling 1,000 randomly selected annually cropped fields; in addition, 1,091 weed seed samples submitted by growers or industry between 2007 and 2011 were screened for resistance (Beckie et al. Reference Beckie, Lozinski, Shirriff and Brenzil2013). Of 677 fields where wild oat seed samples were collected, 298 (44%) had an HR biotype. Acetyl CoA carboxylase (ACCase) inhibitor (WSSA Group 1-HR wild oat was confirmed in 275 fields (41%), up from 15% in the previous baseline surveys (2001 to 2003). Group 2 or acetolactate synthase (ALS) inhibitor–resistant wild oat was found in 12% of fields (vs. 8% in 2001 to 2003). Group 8 (triallate, difenzoquat)-HR wild oat was identified in only 8% of fields (not tested in 2001 to 2003); the frequency of occurrence of Group 1+2-HR wild oat was similar to that of Group 8-HR wild oat (8% vs. 3% in 2001 to 2003). Group 1-HR green foxtail was found in 27% of 209 fields sampled for the weed (vs. 6% in 2001 to 2003).
Of various broadleaf weed species tested, several Group 2–resistant biotypes were identified. Group 2-HR spiny sowthistle [Sonchus asper (L.) Hill] was confirmed in all Alberta fields sampled (vs. 67% in 2001); common chickweed [Stellaria media (L.) Vill.] was found mainly in Alberta in 40% of fields (vs. 17% in 2001). Group 2-HR weed biotypes not previously detected in the baseline surveys included cleavers, mainly in Alberta (17% of fields) and Saskatchewan (21%), Powell amaranth (Amaranthus powellii S. Watson) in Manitoba (16% of fields), wild mustard (Sinapis arvensis L; three populations in Saskatchewan and Manitoba), and wild buckwheat [Fallopia convolvulus (L.) Á. Löve] (one population in Alberta). No sampled weed populations across the prairies were resistant to herbicides from Group 4 (synthetic auxins), Group 9 (glyphosate), or Group 10 (glufosinate). On the basis of the proportion of total field area at each site infested with HR weeds, it was estimated that 7.7 million ha (29% of annually cropped land) were infested with HR weeds (an eight-fold increase from 2001 to 2003), in a total field area of 9.9 million ha (37%)—more than a two-fold increase.
Of 816 cases of HR wild oat identified from submitted samples from 2007 to 2011, 69% were Group 1 HR, 15%were Group 2 HR, and 16% were Group 1+2 HR. In addition, there were 10 populations of Group 1-HR green foxtail in Saskatchewan or Manitoba, and six populations of Group 1-HR Persian darnel (Lolium persicum Boiss. & Hohen. ex. Boiss) in southern Alberta and Saskatchewan. Various Group 2-HR broadleaf weeds were identified, including 17 wild mustard populations. mainly from Saskatchewan. and 39 cleavers populations across the three prairie provinces. Herbicide-use data from 2006 to 2010 indicated continued reliance on Group 1 herbicides in cereal crops and Group 2 herbicides in annual legume (pulse) crops.
Five years after completion of the second round of HR-weed surveys in the three prairie provinces, a survey of nearly 800 randomly selected fields was conducted from 2014 to 2017 across the region to determine the change in distribution and abundance of HR weeds. As reported herein, all residual (preharvest) weed species with viable seed were mapped and sampled. Samples were subsequently screened in the greenhouse with various herbicides from Groups 1 or 2 (i.e., tier-1 or high-risk herbicide testing). In addition, more than 1,100 weed seed samples submitted by growers or industry between 2012 and 2016 were screened for resistance to any requested herbicide or herbicide site of action.
Materials and Methods
Survey Sites
A total of 798 fields across the major prairie agricultural ecoregions (area of similar climate, natural vegetation, soils, and land use) (Agriculture and Agri-Food Canada 2003) were surveyed for HR weeds from 2014 to 2017 (Table 1): 400 fields in Saskatchewan in 2014 and 2015, 151 fields in Manitoba in 2016, and 247 fields in Alberta in 2017. Each field was farmed by a different grower. Similar to the general weed survey (Leeson Reference Leeson2016; Leeson et al. Reference Leeson, Gaultier and Grenkow2017, Reference Leeson, Hall, Neeser, Tidemann and Harker2019), a stratified randomized design was used to select fields (Thomas Reference Thomas1985). The proportional allocation of fields among the major crops grown in each ecodistrict (i.e., a geographic area within an ecoregion similar in landform, relief, surficial material, soil, vegetation, and land use) was also the same as that of the general weed survey. Each field comprised 65 ha. The crop allocation in the major agricultural ecoregions of the prairies is shown in Table 1.
Table 1. Fields surveyed across prairie ecoregions, by crop.

a The Mixed Grassland ecoregion includes the Cypress Upland ecoregion.
b The Aspen Parkland ecoregion includes the Southwest Manitoba Uplands ecoregion.
c The Boreal Transition ecoregion includes the Mid-Boreal Uplands ecoregion.
d The Interlake Plain ecoregion includes Lake of the Woods ecoregion.
e The semiarid Grassland region includes the Mixed Grassland, Moist Mixed Grassland, and Fescue Grassland ecoregions; the subhumid Parkland ecoregion includes the remaining ecoregions (Agriculture and Agri-Food Canada 2003).
A slight majority of the fields (52%) was cropped to cereals. This proportion was lower than that of the second-round (2007 to 2009) weed-resistance surveys (60%) (Beckie et al. Reference Beckie, Lozinski, Shirriff and Brenzil2013). Wheat occupied 70% of the 412 survey fields cropped to cereals; barley, 19%; oat, 9%; and corn, 2%. In the second-round surveys, wheat comprised 64% of cereal fields; barley, 24%; oat, 1%; and corn, 1%. Oilseeds comprised 38% of surveyed fields: canola, 77%; flax, 11%; soybean, 10%; mustard, 1%; and sunflower, 1%. The proportion of oilseed fields was slightly greater than that in the second-round surveys (33%). Pulse crops comprised 10% of surveyed fields (vs. 7% in 2007 to 2009), with field pea at 56% and lentil at 44% of pulse-crop area (a similar proportion to that in the second-round surveys).
Field Survey
Fields were surveyed using a W-transect pattern (adapted from Thomas [Reference Thomas1985]) in August or September before crop harvest. Approximately 1,000 mature seeds of a weed species were collected, when available, from plants occurring in a patch (as many as 100 plants, depending on patch area) and placed in an unsealed paper bag (Beckie et al. Reference Beckie, Heap, Smeda and Hall2000). Any patch visible from a transect was sampled. If the weed population was widely disseminated across a field with no visible patchiness (i.e., single plants), at least 100 plants were sampled to obtain an estimate of the frequency of resistance in the weed population. The infestation area of a suspected HR weed species in a field was estimated with a tape measure or calculated with global positioning system coordinates. Samples were air dried and stored at room temperature (approximately 20 C) before conducting resistance tests.
The weed species tested for resistance are listed in Table 2. Sixty percent of the 20 weed species tested for resistance were ranked in the top 20 on the basis of relative abundance (composite index of the field frequency, field uniformity, and density values for a species) in fields surveyed from 2014 to 2017 (Leeson Reference Leeson2016; Leeson et al. Reference Leeson, Gaultier and Grenkow2017, Reference Leeson, Hall, Neeser, Tidemann and Harker2019). Some species whose seeds had been collected were not tested because of limited amount of seed, no known response to herbicides used in screening, or nonviable seed.
Table 2. Weed species tested for resistance.

a Average relative abundance rank of species in 4,132 fields surveyed from 2014 to 2017 (Leeson Reference Leeson2016; Leeson et al. Reference Leeson, Gaultier and Grenkow2017, Reference Leeson, Hall, Neeser, Tidemann and Harker2019). Rank of annual smartweed spp. is that of pale smartweed (Polygonum lapathifolia L.); most cleavers populations in the general weed surveys were identified as false cleavers (G. spurium L.) rather than G. aparine, but species were not delineated in the resistance surveys.
Resistance Tests
Resistance tests were initiated 4 mo after seeds were collected, with the expectation that levels of innate dormancy would be reduced by this storage period. All tests were conducted using whole-plant assays in the greenhouse. Environmental conditions were 21/18 C day/night temperature regime with a 16-h photoperiod supplemented with 230 μmol m−2 s−1 illumination. Weed species were sprayed at early growth stages (usually two to four leaves) to optimize herbicide efficacy. Weed samples were screened for resistance to various herbicides (commercial formulations) belonging to Groups 1 or 2 (tier-1 testing).
Grass weed species were tested for resistance to a maximum of seven Group 1 herbicides: three aryloxyphenoxypropionate (APP) herbicides, three cyclohexanedione (CHD) herbicides, and pinoxaden, a phenylpyrazolin (PPZ) herbicide (Table 3). The three APP herbicides were fenoxaprop-P (without safener), clodinafop, and quizalofop; the three CHD herbicides were sethoxydim, tralkoxydim, and clethodim. Recommended adjuvants were included in the herbicide spray solutions. Grass species were treated with three Group 2 herbicides: imazamethabenz, imazamox, and flucarbazone. Broadleaf weed species were treated with a maximum of five Group 2 herbicides: two imidazolinones (IMIs) (imazethapyr, imazamox), two sulfonylureas (SUs) (metsulfuron, thifensulfuron/tribenuron mixture), and florasulam, a triazolopyrimidine (TP) herbicide.
Table 3. Herbicides for resistance screening (tier 1: Group 1 or 2 herbicides).
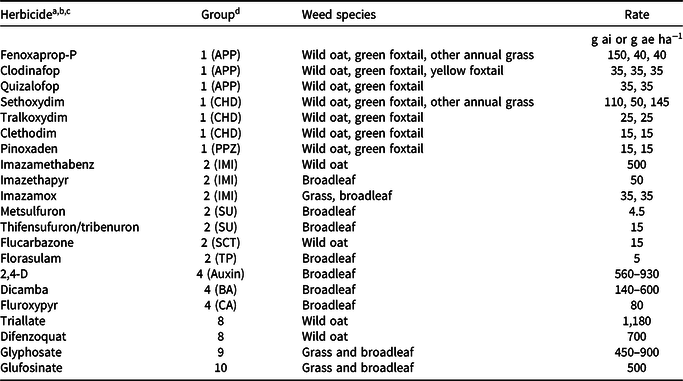
a For each herbicide, only weed species listed on the label as being controlled were screened. Herbicides from the other Groups were used for screening submission samples from growers or industry.
b Manufacturers (trade name in parentheses): Arysta LifeScience Canada, Edmonton, Alberta, Canada: clethodim (Select), flucarbazone (Everest); BASF Canada, Mississauga, Ontario, Canada: dicamba (Banvel II), imazamox (Solo), imazethapyr (Pursuit), sethoxydim (Poast Ultra); Bayer CropScience Canada, Calgary, Alberta, Canada: fenoxaprop-P (Tundra component 1), glufosinate (Liberty 200 SN); Dow AgroSciences Canada, Calgary, Alberta, Canada: florasulam (Frontline), fluroxypyr (Attain XC component A), pyroxsulam (Simplicity), tralkoxydim (Achieve); E. I. duPont Canada, Mississauga, Ontario, Canada: metsulfuron (Ally), quizalofop (Assure II), thifensulfuron:tribenuron (Refine SG); Gowan Canada, Calgary, Alberta, Canada: triallate (Avadex Extra Strength BW); Monsanto Canada, Winnipeg, Manitoba, Canada: glyphosate (Roundup WeatherMax); Nufarm Agriculture, Calgary, Alberta, Canada: 2,4-D Ester 700, imazamethabenz (Assert); Syngenta Crop Protection Canada, Regina, Saskatchewan, Canada: clodinafop (Horizon 240EC), difenzoquat (Avenge 200C), pinoxaden (Axial).
c Adjuvants: Achieve: Turbocharge (oil-based); Ally: Agral 90 (nonionic); Assure: Sure-mix (oil-based); Axial: Adigor (oil-based); Everest: Agral 90; Poast: Merge (oil- based); Pursuit: Agral 90; Select: Amigo (oil-based); Simplicity: Agral 90; Solo: Merge.
d Abbreviations: APP, aryloxyphenoxypropionate; BA, benzoic acid; CA, carboxylic acid; CHD, cyclohexanedione; IMI, imidazolinone; PPZ, phenylpyrazolin; SCT, sulfonylaminocarbonyltriazolinone, SU, sulfonylurea; TP, triazolopyrimidine.
Herbicides were applied using a moving-nozzle cabinet sprayer equipped with a flat-fan spray tip (TeeJet 8002VS; Spraying Systems Co., Wheaton, IL) calibrated to deliver 200 L ha−1 spray solution at 275 kPa in a single pass over the foliage. Thirty-six plants were grown in a flat (each flat was considered a replicate; flats were randomly situated on a greenhouse bench) measuring 52 by 26 by 5 cm that was filled with a commercial potting mixture of soil, peat, vermiculite, and sand (3:2:2:2 by volume) amended with a slow-release fertilizer (15-9-12; 150 g 75 L−1; Scotts Osmocote PLUS, Mississauga, ON). Using a numeric scale, plants were visually assessed as HR (2, some injury but new growth; or 3, no injury) or herbicide susceptible (HS; 0, dead; or 1, nearly dead) at 21 to 28 d after treatment. A minimum of 100 seedlings per sample were screened in each resistance test. Treatments and untreated controls were replicated three times and the tests were repeated. Known HR and HS biotypes were included in all tests (Beckie et al. Reference Beckie, Heap, Smeda and Hall2000). Samples either collected in fields or submitted for testing were assumed to consist of populations potentially containing HS individuals and HR individuals having one or multiple herbicide resistance mechanisms. A population was considered HR when at least one individual in each test replicate scored 2 or 3.
Samples Submitted by Growers: 2012 to 2016
For the 5-yr period, the 2012 to 2016 crop years, 1,108 samples were submitted for resistance testing. This number compares with 1,091 samples submitted during the 5-yr period 2007 to 2011 (Beckie et al. Reference Beckie, Lozinski, Shirriff and Brenzil2013). The majority of samples (54%) originated from Saskatchewan, with 40% of samples from Alberta and 6% of samples from Manitoba. The relatively low number from Manitoba reflects alternative HR-weed testing services in the province. Requested herbicides to be used in testing are included in Table 3. Herbicide application and resistance assessment procedures are the same as those described in the previous section.
Results and Discussion
Grass Weed Resistance
Of the 578 fields where wild oat samples were collected, 398 (69%) had an HR biotype (vs. 44% in the 2007 to 2009 surveys). Group 1-HR wild oat was confirmed in 359 fields (62%) (Table 4; Figure 1). In comparison, 41% and 15% of fields with wild oat in the second-round (2007 to 2009) and baseline (2001 to 2003) surveys, respectively, had a Group 1-HR biotype (Beckie et al. Reference Beckie, Leeson, Thomas, Brenzil, Hall, Holzgang, Lozinski and Shirriff2008, Reference Beckie, Lozinski, Shirriff and Brenzil2013). Overall, 45% of fields surveyed (n = 798) had Group 1-HR wild oat (vs. 28% in second-round surveys and 11% in baseline surveys). Incidence of resistance tended to be proportionally lowest in the northern ecoregions (Boreal Transition, 40%; Peace Lowland, 45%). Therefore, the rate of increase in the incidence of HR wild oat since the previous surveys was lowest in the Boreal Transition and Peace Lowland ecoregions and greatest in the Grassland ecoregions. Across the prairie provinces, Group 1-HR wild oat was found in 58% of fields with wild oat in Alberta, 59% in Saskatchewan, and 78% in Manitoba. The Group 1 cross-resistance pattern of the wild oat populations did not show a significant difference in resistance frequency among the three classes of Group 1 herbicides (data not shown), similar to that found in the last round of surveys.
Table 4. Fields with herbicide-resistant wild oat, by ecoregion.

a Total number of fields where seeds were collected: 578.
b Total number of fields surveyed: 798.
c The Mixed Grassland ecoregion includes the Cypress Upland ecoregion.
d The Aspen Parkland ecoregion includes the Southwest Manitoba Uplands ecoregion.
e The Boreal Transition ecoregion includes the Mid-Boreal Uplands ecoregion.
f The Interlake Plain ecoregion includes Lake of the Woods ecoregion.

Figure 1. Field surveys: Group 1 (acetyl CoA carboxylase inhibitor)–resistant wild oat (white circle) across the prairie provinces, 2014 and 2015 to 2017 (left to right: Alberta, Saskatchewan, Manitoba).
Group 2 resistance was confirmed in 197 wild oat populations (34% of fields where seeds were collected or 25% of all fields surveyed) (Table 4; Figure 2). This frequency of resistance compares with 12% and 8% of fields sampled in the second-round and baseline surveys, respectively (Beckie et al. Reference Beckie, Leeson, Thomas, Brenzil, Hall, Holzgang, Lozinski and Shirriff2008, Reference Beckie, Lozinski, Shirriff and Brenzil2013). This sharp increase in Group 2 resistance since the last round of surveys reflects increased grower reliance on this chemistry to manage Group 1-HR wild oat and the resultant increased selection pressure. In past surveys, most fields with Group 2-HR wild oat were located in the Parkland region, where Group 2 herbicide use has historically been the greatest. However, this geographic distribution was not evident in this latest round of surveys. Frequent cross-resistance was found in HR populations to the Group 2 herbicides tested (imidazolinones and flucarbazone; data not shown), similar to the previous surveys. Similar to the second-round surveys, the incidence of Group 2-HR wild oat was lowest in Saskatchewan (32% of sampled fields), compared with Alberta (40%) and Manitoba (43%).

Figure 2. Field surveys: Group 2 (acetolactate synthase inhibitor)–resistant wild oat (white circle) across the prairie provinces, 2014 and 2015 to 2017 (left to right: Alberta, Saskatchewan, Manitoba).
There were 158 fields with Group 1+2-HR wild oat populations (27% of fields sampled) (Table 4; Figure 3), compared with 8% and 3% of fields in the second-round and baseline surveys, respectively (Beckie et al. Reference Beckie, Leeson, Thomas, Brenzil, Hall, Holzgang, Lozinski and Shirriff2008, Reference Beckie, Lozinski, Shirriff and Brenzil2013). Resistance was proportionally greatest in the Fescue Grassland and Interlake Plain ecoregions, although the sample size from these areas is relatively small. Past research has indicated that resistance in intergroup-HR wild oat populations is primarily target-site (i.e., ACCase inhibitor) or metabolism-based (i.e., ALS inhibitor) (Beckie et al. Reference Beckie, Warwick and Sauder2012a). There are no POST herbicide options for multiple–HR (ACCase plus ALS inhibitor) wild oat in wheat or barley; PRE options include triallate or trifluralin plus triallate (suppression by trifluralin or pyroxasulfone) (Anonymous 2019). The only options in field pea are PRE trifluralin or triallate; in lentil, the only option is PRE-applied trifluralin. Consequently, growers often include glyphosate- or glufosinate-resistant canola (also HR soybean or corn in southern Manitoba) in their rotation to effectively manage this HR biotype.

Figure 3. Field surveys: Group 1 (acetyl CoA carboxylase inhibitor) plus Group 2 (acetolactate synthase inhibitor)–resistant wild oat (white circle) across the prairie provinces, 2014 and 2015 to 2017 (left to right: Alberta, Saskatchewan, Manitoba).
Herbicide resistance in wild oat has been reported in 16 other countries (Heap Reference Heap2019). All of those countries reported Group 1 HR biotypes; seven reported Group 2 HR biotypes, and five reported multiple HR biotypes: Australia, Germany, Poland, South Africa, and the United States. In the U.S. Northern Great Plains states of Montana, North Dakota, South Dakota, and Minnesota, wild oat populations resistant to Groups 1 and 2 herbicides have been reported (Heap Reference Heap2019). In a 2005 survey in Western Australia, 71% of 150 Avena spp. populations were Group 1 HR, but no population was Group 2 HR (Owen and Powles Reference Owen and Powles2009). Five years later, the frequency of resistance in populations remained stable – 48% of 128 populations were Group 1-HR, two populations were Group 2-HR, and nine populations were multiple-HR (Owen and Powles Reference Owen and Powles2016). A 2007 survey in New South Wales, Australia, found 38% of 113 Avena spp. populations resistant to Group 1 herbicides but not to Group 2 herbicides (Broster et al. Reference Broster, Koetz and Wu2011). In a 2009 survey in Greece, 89% of 104 sterile wild oat (A. sterilis L.) populations were Group 1 HR, but only 3% were Group 2 HR (Travlos et al. Reference Travlos, Giannopolitis and Economou2011). Overall, herbicide cross- or multiple resistance in this species is significantly more extensive in Canada than other countries.
Group 1-HR green foxtail was found in 25% of 187 fields where seeds were collected (Table 5; Figure 4). This incidence of resistance is similar to that found in the second-round surveys (Beckie et al. Reference Beckie, Lozinski, Shirriff and Brenzil2013). By province, Group 1-HR green foxtail occurred in 21% of Alberta fields sampled, 17% of Saskatchewan fields, and 44% of Manitoba fields. Resistance was proportionally greatest in the Boreal Transition and Lake Manitoba Plain ecoregions. Similar to wild oat, incidence of Group 2 resistance in this weed increased sharply since the last survey round, during which it was not detected. Overall, 11% of sampled fields had a Group 2–resistant biotype (Table 5; Figure 5). Group 2-HR green foxtail was found in 6% of Alberta or Manitoba fields, and 15% in Saskatchewan fields, with highest proportional incidence in the Boreal Transition ecoregion. Group 1+2–resistant populations were confirmed in Manitoba (one field in the Aspen Parkland ecoregion) and Saskatchewan (two fields in the Aspen Parkland and Boreal Transition ecoregions). Therefore, increased Group 2 herbicide selection pressure is resulting in increased frequency of HR biotypes of wild oat and green foxtail. The Group 1-HR biotype of this species has only been reported in Montana; the Group 2-HR biotype has been reported only in Wisconsin and France; reported HR populations originated primarily in cereal fields (Heap Reference Heap2019).
Table 5. Fields with herbicide-resistant green foxtail, by ecoregion.

a Total number of fields where seeds were collected: 187.
b Total number of fields surveyed: 798.
c The Mixed Grassland ecoregion includes the Cypress Upland ecoregion.
d The Aspen Parkland ecoregion includes the Southwest Manitoba Uplands ecoregion.
e The Boreal Transition ecoregion includes the Mid-Boreal Uplands ecoregion.
f The Interlake Plain ecoregion includes Lake of the Woods ecoregion.

Figure 4. Field surveys: Group 1 (acetyl CoA carboxylase inhibitor)–resistant green foxtail (white circle) across the prairie provinces, 2014 and 2015 to 2017 (left to right: Alberta, Saskatchewan, Manitoba).

Figure 5. Field surveys: Group 2 (acetolactate synthase inhibitor)–resistant green foxtail (white circle) across the prairie provinces, 2014 and 2015 to 2017 (left to right: Alberta, Saskatchewan, Manitoba).
Of 60 fields in Manitoba where yellow foxtail was sampled, 25 (42%) had an HR population. Resistance in this weed has not been reported previously in Canada. Group 1-HR yellow foxtail was found in 19 fields (32%) where the weed was sampled (Table 6; Figure 6), mainly in the Aspen Parkland and Lake Manitoba Plain ecoregions. Group 2-HR yellow foxtail was found in 10 fields (17%) (Table 6; Figure 6) in the Aspen Parkland, Lake Manitoba Plain, or Interlake Plain ecoregions. Four fields (Aspen Parkland, Lake Manitoba Plain, Interlake Plain ecoregions) had Group 1+2-HR yellow foxtail. The rapid evolution of this high incidence of Group 1 or Group 2 resistance in this weed is concerning and may help explain why the species has increased in relative abundance in Manitoba from 32nd place in 2002 to sixth place in 2016 (Leeson et al. Reference Leeson, Gaultier and Grenkow2017) due to suboptimal control. Conversely, a greater selection pressure for resistance is enabled by greater population abundance.
Table 6. Manitoba fields with herbicide-resistant yellow foxtail, by ecoregion.

a Total number of fields where seeds were collected, 60.
b Total number of fields surveyed, 151.
c The Interlake Plain ecoregion includes Lake of the Woods ecoregion.

Figure 6. Field surveys (left to right): Group 1 (acetyl CoA carboxylase inhibitor)–resistant yellow foxtail (white circle); and Group 2 (acetolactate synthase inhibitor)–resistant yellow foxtail in Manitoba.
Although Group 1 resistance was not detected, Group 2-HR barnyardgrass (Echinochloa spp.) was found in three of 11 fields sampled (27%) in Manitoba (Aspen Parkland and Boreal Transition ecoregions; data not shown). At least one population was western barnyardgrass [E. muricata (P. Beauv.) Fernald var. microstachya Wiegand], not E. crus-galli (L.) P. Beauv. Because these HR biotypes have not been reported in Canada previously, close monitoring of their occurrence in the future is warranted.
Broadleaf Weed Resistance
Group 2-HR common chickweed was confirmed in nine of 30 fields sampled (30%), mainly in the Aspen Parkland region of Alberta and Saskatchewan (Table 7). The frequency of occurrence of this biotype in Alberta has remained the same since the last survey round (40%), but increased in Saskatchewan (20%), where it was not previously documented. Group 2-HR cleavers was found in 31 of 119 fields sampled (26%), mainly in the Parkland region (Table 7; Figure 7). In Alberta, incidence of this biotype has increased from 17% in the second-round survey to 44% in this survey round, whereas incidence has remained the same over this period in Saskatchewan (20%) and Manitoba (11%). Herbicide options to control this biotype in field pea are limited to bentazon (Group 6) (Anonymous 2019). Group 2 resistance in catchweed bedstraw (Galium aparine L.) has only been reported in wheat fields in China, Iran, and Turkey (Heap Reference Heap2019). However, most Canadian HR populations are G. spurium L. (Beckie et al. Reference Beckie, Warwick, Sauder, Kelln and Lozinski2012b).
Table 7. Fields with Group 2-resistant broadleaf weeds, by ecoregion.

a The Mixed Grassland ecoregion includes the Cypress Upland ecoregion.
b The Aspen Parkland ecoregion includes the Southwest Manitoba Uplands ecoregion.
c The Boreal Transition ecoregion includes the Mid-Boreal Uplands ecoregion.
d The Interlake Plain ecoregion includes Lake of the Woods ecoregion.
e The semiarid Grassland region includes the Mixed Grassland, Moist Mixed Grassland, and Fescue Grassland ecoregions; the subhumid Parkland ecoregion includes the remaining ecoregions (Agriculture and Agri-Food Canada 2003).

Figure 7. Field surveys (left to right): Group 2 (acetolactate synthase inhibitor)–resistant cleavers (white circle) in Alberta and Saskatchewan (Manitoba map not shown).
Group 2-HR common lambsquarters (Chenopodium album L.) was documented in one of 34 fields sampled in Alberta (Table 7)—the first confirmed case in the province, to our knowledge. Other Group 2-HR biotypes exclusive to Alberta included narrowleaf hawksbeard (Crepis tectorum L.) (two of seven fields [29%] in the Aspen Parkland ecoregion) and smartweed (Polygonum spp.) (five of eight fields [62%] in the Aspen Parkland ecoregion), which were not detected in previous surveys, and spiny sowthistle (four of 11 fields [36%]) (Table 7). Group 2-HR field pennycress was confirmed in 12 of 79 fields (15%) in Alberta and Saskatchewan; this biotype was not detected in previous surveys. Group 2-HR redroot pigweed (Amaranthus retroflexus L.) was found in three of 43 (7%) fields sampled in Saskatchewan (not detected previously) and Manitoba (one case in previous surveys). Group 2-HR shepherd’s purse [Capsella bursa-pastoris (L.) Medik.] was found in nine of 43 fields (21%) across the three prairie provinces; this biotype was not found in previous surveys. Group 2-HR wild mustard was found in nine of 36 fields (25%) in Saskatchewan and Manitoba (Table 7); similar results were found in the previous survey round. Herbicide options to control this biotype in lentil (Lens spp.) is limited to metribuzin (Anonymous 2019).
Kochia and Russian thistle were not included in these preharvest surveys, but they were surveyed separately after harvest (Alberta in 2017, Manitoba in 2018, Saskatchewan in 2019) because of late-maturing seed. The stratified randomized survey conducted in Alberta in 2017 showed all 305 populations were Group 2 HR, with glyphosate and dicamba resistance confirmed in 50% and 18% of populations, respectively; 10% of populations exhibited resistance to all three site-of-action herbicides (Beckie et al. Reference Beckie, Hall, Shirriff, Martin and Leeson2019a). The previous baseline survey in Alberta in 2012 indicated only 5% of kochia populations were glyphosate resistant (Hall et al. Reference Hall, Beckie, Low, Shirriff, Blackshaw, Kimmel and Neeser2014). The same survey found 31 of 45 Russian thistle populations (62%) were Group 2 HR but not resistant to glyphosate or dicamba (Beckie et al. Reference Beckie, Hall, Shirriff, Martin and Leeson2019b). The rapid increase in resistance occurrence in these tumbleweed species is largely attributed to efficient and widespread HR-gene dispersal by seed.
An important indicator of the possible impact of HR weeds is their densities in crop (occurrence fields) after all herbicide treatments have been applied (i.e., preharvest). Based on the past three general weed surveys in each province (Leeson Reference Leeson2016; Leeson et al. Reference Leeson, Gaultier and Grenkow2017, Reference Leeson, Hall, Neeser, Tidemann and Harker2019), densities of green foxtail and wild mustard in Saskatchewan have consistently increased over 20 yr (by 58% and 218%, respectively); in Manitoba, yellow foxtail has increased 360% over 19 yr since 1997 (data not shown). Widespread occurrence of herbicide resistance in these species in these jurisdictions is likely a contributing factor for the increasing level of weed escapes from herbicidal control.
Land Area Affected by HR Weeds
When the frequency of fields with weed resistance in this random survey of 798 fields is extrapolated to the total annually cropped land in the prairies, it is estimated that 9.6 million ha (35%) are infested with HR weeds in a total field area of 16.2 million ha (59%) (Table 8). In comparison, it was estimated that 7.7 million ha (29%) were infested with HR weeds in a total field area of 9.9 million ha (37%) in the second-round surveys, and 1.0 and 4.4 million ha, respectively, in the baseline surveys (Beckie et al. Reference Beckie, Leeson, Thomas, Brenzil, Hall, Holzgang, Lozinski and Shirriff2008, Reference Beckie, Lozinski, Shirriff and Brenzil2013). Therefore, the actual area infested with HR weeds has increased by six percentage points, whereas the total field area affected has increased by 22 percentage points. Thus, the majority of prairie growers are having to manage HR weeds on their farms.
Table 8. Estimated annually cropped land area across the prairies affected by herbicide-resistant weeds: 2014 to 2017.

a Abbreviation: HR, herbicide resistant.
b Actual area occupied by HR weeds.
c Entire field area with an HR weed infestation.
d Total area was adjusted downward because some fields contain more than one HR biotype.
The perceived cost of weed resistance to prairie growers averaged $33 ha−1, based on 404 responses to the management questionnaire that accompanied the provincial surveys (data not shown). This additional expense for growers to manage HR weeds includes herbicide costs and estimated decreased crop yield or quality. If this mean cost is extrapolated to the estimated field area affected by weed resistance, the total cost of HR weeds to prairie growers is estimated at $530 million annually.
Sample Submissions
Most (87%) of the submitted weed samples (n = 1,108) were wild oat (n = 965). Of these wild oat submissions, 793 (82%) were resistant to Group 1 or Group 2 herbicides (vs. 816 cases from 1,091 wild oat samples (83%) submitted during 2007 and 2011) (Beckie et al. Reference Beckie, Lozinski, Shirriff and Brenzil2013). A substantial number of seed samples (n = 111 [12%]) were not viable. When those samples are excluded, most submitted wild oat samples were confirmed as HR. Of these, 550 (69%) were Group 1 HR (vs. 563 cases from 2007 to 2011), 108 (14%) were Group 2 HR (vs. 121 cases from 2007 to 2011), and 135 (17%) were Group 1+2 HR (vs. 132 cases from 2007-2011). The greatest number of cases of HR wild oat originated from Saskatchewan (n = 395), followed by Alberta (n = 343), then Manitoba (n = 55).
The greatest number of Group 1-HR samples originated from Saskatchewan (n = 343; vs. 287 from 2007 to 2011), followed by Alberta (n = 195; vs. 224 from 2007 to 2011), then Manitoba (n = 12; vs. 52 from 2007 to 2011) (Figure 8, top). The greatest number of Group 2-HR samples were from Alberta (n = 50 samples), followed by Manitoba (n = 33) and Saskatchewan (n = 25) (Figure 8, middle). A similar trend was observed from 2007 to 2011 (Beckie et al. Reference Beckie, Lozinski, Shirriff and Brenzil2013). The greatest number of Group 1+2-HR wild oat samples originated from Alberta (n = 98), followed distantly by Saskatchewan (n = 27) and Manitoba (n = 10) (Figure 8, bottom). Only five samples were confirmed as Group 8 (triallate or difenzoquat) HR (vs. eight samples from 2007 to 2011). The top five cross-resistance patterns were the following: (1) APP plus CHD (PPZ not tested); APP (CHD or PPZ not tested); PPZ (APP or CHD not tested); (4) APP plus CHD plus PPZ; and (5) TP (IMI or SCT not tested).

Figure 8. Submitted samples (top to bottom): Group 1 (acetyl CoA carboxylase inhibitor)–resistant wild oat across the prairie provinces (left to right: Alberta, Saskatchewan, Manitoba); Group 2 (acetolactate synthase)–resistant wild oat; and Group 1+2-resistant wild oat.
The number of cases of Group 1-HR green foxtail (n = 10) was the same as that found in the previous reporting period. Three cases of Group 1-HR Persian darnel were confirmed in southern Saskatchewan and southern Alberta (vs. six cases in that region from 2007 to 2011). Group 2-HR cleavers was confirmed in 54 populations: 31 from Saskatchewan, 22 from Alberta, and one from Manitoba (Figure 9). This incidence compares with 39 populations in the previous reporting period (Beckie et al. Reference Beckie, Lozinski, Shirriff and Brenzil2013). Populations were resistant to herbicides from the IMI or TP classes. Group 2-HR wild mustard was identified in nine cases, all from Saskatchewan (vs. 17 in the previous reporting period that included one case from Alberta). Group 2-HR field pennycress was found in seven populations: six from Saskatchewan and one from Alberta (vs. four from Saskatchewan during 2007–2011). Group 2-HR shepherd’s purse was identified in five populations, all from Saskatchewan (vs. four cases in the previous period). Group 2-HR chickweed was documented in only one population from Saskatchewan (vs. three populations in the previous period); Group 2-HR common hempnettle (Galeopsis tetrahit L.) in one population from Alberta (vs. no cases in the previous period); Group 2-HR redroot pigweed was found in one population from Saskatchewan (vs. no cases in the previous period), and Group 2-HR smartweed was found in in three populations from Alberta (vs. no cases in the previous period). Glyphosate resistance in kochia was confirmed in two populations from Alberta in 2015 and one population from Saskatchewan in 2016. Overall, the distribution and relative abundance of HR weed biotypes determined from submission-sample testing reflected the findings from the field surveys.
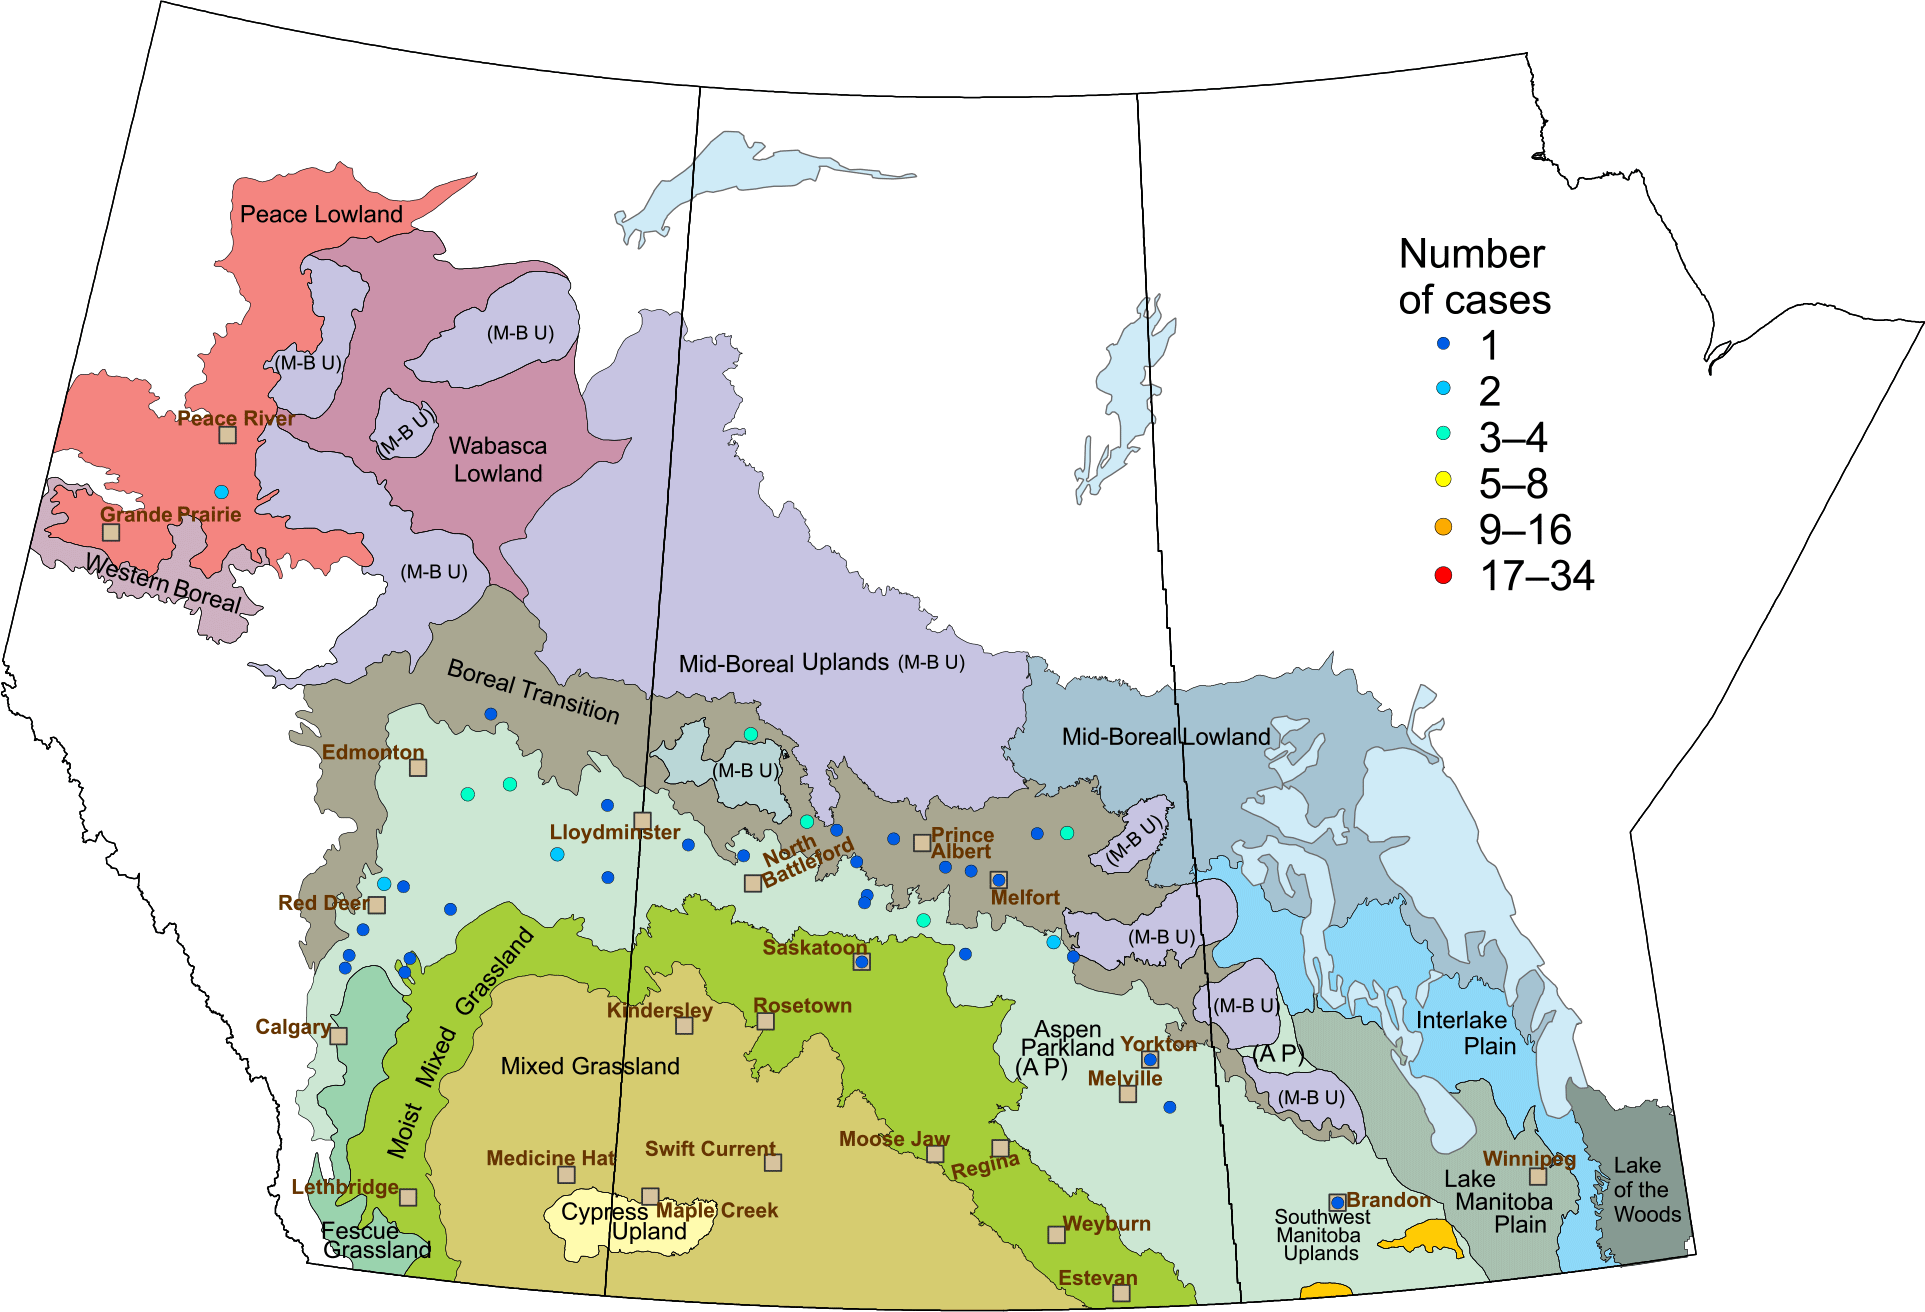
Figure 9. Submitted samples: Group 2 (acetolactate synthase)–resistant cleavers across the prairie provinces (left to right: Alberta, Saskatchewan, Manitoba).
On the basis of the prairie weed survey questionnaire data, some practices were preferentially used by growers with suspected or known HR weeds in one or more provinces versus those without resistance (G test P = 0.05) (McDonald Reference McDonald2014). These practices were the following: (1) crop rotation, (2) herbicide Group rotation, (3) tank-mixing herbicides, (4) use of PRE herbicides, (5) scouting before or after herbicide application, (6) tillage (spring or fall), (7) growing weed-competitive crops, (8) increasing crop seeding rates, and (9) managing weed patches (i.e., sanitation) (data not shown). These targeted practices are consistent with best management practices recommended to manage weed resistance (Beckie and Harker Reference Beckie and Harker2017; Norsworthy et al. Reference Norsworthy, Ward, Shaw, Llewellyn, Nichols, Webster, Bradley, Frisvold, Powles, Burgos, Witt and Barrett2012). A future report will detail agronomic practices used by growers whose fields were surveyed for resistance, as reported herein, and identify any differences in practices used by those with and without HR weeds in their surveyed field.
Acknowledgments
Financial support for the Saskatchewan survey was provided by Saskatchewan Ministry of Agriculture and the Canada-Saskatchewan Growing Forward 2 (GF2) bilateral agreement, Western Grains Research Foundation, and Saskatchewan Pulse Growers. Financial support for the Manitoba survey was provided by Manitoba Agri-Research and Development Fund (GF2), Western Grains Research Foundation, Manitoba Pulse & Soybean Growers, Manitoba Wheat & Barley Growers Association, Manitoba Canola Growers, Manitoba Oat Growers Association, Manitoba Corn Growers Association, Manitoba Seed Growers Association, Manitoba Flax Growers Association, and National Sunflower Association of Canada. Financial support for the Alberta survey was provided by Western Grains Research Foundation, Alberta Wheat Commission, Alberta Pulse Growers Commission, and the Alberta Canola Producers Commission. We sincerely thank Keith Topinka, University of Alberta, and Jennifer Zuidhof, AAFC Lacombe, for their assistance in surveying Alberta fields. We acknowledge the contributions of Dr. Cecilia Peluola, Margaret Bruce, Kristen Gray, Mackenzie Hladun, Jaclyne Shiplack, Tracey Sliva, Tony Stoppa, and Carla Weitzel from the Crop Protection Laboratory, Saskatchewan Ministry of Agriculture. We thank David Giffen, AAFC Saskatoon, for producing the maps. Special thanks are extended to the farmers who participated in the surveys. No conflicts of interest have been declared.


