Off-target movement of herbicides occurs with every herbicide application. Van den Berg et al. (Reference Van den Berg, Kubiak, Benjey, Majewski, Yates, Reeves, Smelt and Van der Linden1999) estimated that up to 50% of the herbicide applied could be lost into the environment when applications are made in poor conditions. Herbicide drift from agricultural applications is a source of environmental contamination that has potential adverse human health impacts and can cause damage to nontarget plants, animals, and other natural resources. Herbicide use in the United States between 1996 and 2011 increased by an estimated 9% or 240 million kilograms (Benbrook Reference Benbrook2012). At the same time, awareness and concern about agricultural herbicide use has prompted efforts to mitigate off-target movement of herbicides and to re-evaluate weed control and herbicide application practices.
Agricultural nozzles generally produce droplets ranging in diameter from <10 to >1,000 μm (Creech et al. Reference Creech, Henry, Fritz and Kruger2015a). The diameter of a spray droplet is significant for transport and fate. For example, a 100 μm diameter droplet can travel 7.5 times farther off-target than a 500 μm droplet in 5 kph wind speed when released from a typical boom height of 0.5 m (Bode Reference Bode1987). Creech et al. (Reference Creech, Henry, Fritz and Kruger2015a) evaluated application variables that impact spray droplet size and concluded that nozzle type, operating pressure, herbicide solution, nozzle orifice size, and carrier volume, in order of greatest impact to least, all impact droplet size. In addition to the factors evaluated by Creech et al. (Reference Creech, Henry, Fritz and Kruger2015a), other application and environmental factors, such as temperature and relative humidity, could also impact droplet size (Matthews Reference Matthews1992).
Herbicide application is a complex process involving a series of stages beginning at the nozzle with droplet formation, followed by travel to the plant surface, droplet impact and retention on the leaf surface, deposit formation, plant uptake, and biological response (Brazee et al. Reference Brazee, Reichard, Bukovac and Fox1991; Ebert and Downer Reference Ebert and Downer2008; Merritt et al. Reference Merritt, Graham, Dar and Javed1989; Reichard Reference Reichard1988). A change that occurs at any one stage interacts with the other application factors and, as many stages are interrelated, subsequent stages and spray performance are affected.
In an attempt to reduce herbicide drift, efforts have been made to implement drift reduction technologies (DRTs). These technologies aim to mitigate off-target spray deposition through methods such as reducing the proportion of small droplets in sprays through the use of innovative nozzle designs, chemical formulations, and other application technologies (Lund et al. Reference Lund, Cross, Gilbert, Glass, Taylor, Walklate and Western2000; Nordby and Skuterud Reference Nordby and Skuterud1974; Wolf et al. Reference Wolf, Grover, Wallace, Shewchuk and Maybank1993; Yates et al. Reference Yates, Akesson and Bayer1976). Because spray drift is a complex research topic that includes both environmental and equipment variables in addition to the many application parameters, it is difficult to test all possible interactions. While many factors that impact herbicide drift have become better understood, the full effect of DRTs on the delivery of the herbicide to the target and ultimate performance have not been fully investigated and are not as easily quantified.
Air induction nozzles are effective at reducing herbicide drift by limiting the number of fine droplets, over a wide range of spray pressures, that could potentially move off-target (Etheridge et al. Reference Etheridge, Womac and Mueller1999). These nozzles vary in design, but usually consist of a pre-orifice, one or two air-induction ports, a mixing chamber, and an exit orifice that is larger than the pre-orifice. The air-induction ports permit air to enter the chamber and reduce the pressure of the liquid. The pre-orifice insert determines the flow rate of the liquid before it exits through larger orifice, thus reducing spray velocity and producing larger droplets. While increasing the spray droplet size of an herbicide application may be effective in mitigating off-target movement (Bode Reference Bode1987), increasing the spray droplet size of an application can impact herbicide efficacy (Knoche Reference Knoche1994). It is generally assumed that contact herbicides may be more adversely affected than systemic herbicides by increasing spray droplet size. Knoche (Reference Knoche1994) observed an increase in contact herbicide efficacy as droplet size decreased in 58% of the studies he reviewed. Conversely, glyphosate, a systemic herbicide, has increased adsorption and translocation when applied using larger droplets (Feng et al. Reference Feng, Chiu, Sammons and Ryerse2003; Liu et al. Reference Liu, Campbell, Studens and Wagner1996). The effect of droplet size on herbicide efficacy is herbicide and species dependent, and results can be highly variable (Creech et al. Reference Creech, Moraes, Henry, Luck and Kruger2015c).
Another method used to reduce off-target herbicide movement is the use of drift control adjuvants. These adjuvants are often classified as spray modifiers in that they may increase the viscosity of the spray to reduce the number of small droplets (Monaco et al. Reference Monaco, Weller and Ashton2002). Other drift control adjuvants function more as an invert suspension or emulsifier to improve the sheet breakup mechanism and thus reduce fines. For this reason, many applicators will include a drift control adjuvant in the herbicide tank-mixture to attempt to reduce off-target movements near sensitive areas (VanGessel and Johnson Reference VanGessel and Johnson2005). Spray drift control adjuvants are not believed to directly affect herbicide efficacy, but rather make the herbicide application process more efficient by reducing losses through drift (McMullan Reference McMullan2009). Although these adjuvants have been reported by manufacturers as being effective at increasing spray deposition, it is not understood if this would impact spray penetration into a crop canopy. Spray deposition refers to the act or process of spray droplets being deposited and adhering to a surface, whereas spray coverage refers to the percentage of surface area to which spray droplets have adhered. Coverage is influenced by the ability of the spray to penetrate the canopy, droplet size, number of droplets, and surface tension of the droplets.
Research on herbicide efficacy is typically conducted in ideal situations that limit interference from other variables. For example, a researcher would prefer to avoid a situation where a spray application must pass through a crop canopy to reach the target weed species. Growers have readily adopted herbicide-resistant crops, thereby increasing herbicide and application timing options across a growing number of hectares. For example, the adoption of glyphosate-resistant soybeans increased from 17% of U.S. soybean hectares in 1997 to 68% in 2001 and 93% in 2010 (Fernandez-Cornejo et al. Reference Fernandez-Cornejo, Wechsler and Livingston2014).
A crop canopy can intercept the spray, reducing the effective dosage on target plants and increasing deposition variability within and among weeds (Wolf et al. 1996). The primary reason applicators use DRTs is to reduce off-target movement of herbicides during application. The objective of this research was to evaluate the impacts of air-induction nozzles and a drift control adjuvant on canopy penetration and deposition of a glyphosate application in corn and soybean. The secondary objective was to determine if glyphosate efficacy was impacted by reduced deposition when applied to target plants in corn.
Materials and Methods
This experiment was conducted near Big Springs and North Platte, Nebraska, in irrigated corn and soybean fields at each location in 2014. The Big Springs site (41.16°N, 102.02°W) was located on a Kuma loam soil (fine-silty, mixed, superactive, mesic Pachic Argiustolls) located approximately 16 km north-northeast of Big Springs, Nebraska. The North Platte site was located at the West Central Research and Extension Center near North Platte, Nebraska (41.09°N, 100.77°W), on a Cozad silt loam soil (coarse-silty, mixed, mesic, Typic Haplustolls). The Big Springs field sites have historically been managed as a no-till corn–soybean rotation. The North Platte corn site was managed as continuous no-till corn, and the soybean site was managed as a no-till corn–soybean rotation. Corn and soybean were sown in adjacent fields at each location.
The corn hybrid was 106 day ‘Pioneer® 35K09AM1’ sown at 76,000 seeds ha−1 in early May. The soybean cultivar, ‘Pioneer® 92Y70’, with a 2.7 maturity, was sown at 475,000 seeds ha−1 in mid-May. Both corn and soybean used in this experiment were glyphosate-resistant and planted in 76-cm rows. Common fertility rates and practices typical for the area were used such that no nutrient deficiency was apparent in the corn or soybean at the time of the experiment. Supplemental irrigation was provided at the Big Springs location using center-pivot irrigation systems for both corn and soybean. Supplemental irrigation was provided through a subirrigation system and lateral move irrigation system for corn and soybean, respectively, in North Platte. Common cultural methods were employed to maintain the experiment areas free of pests, which resulted in very little insect, weed, or disease pressure.
Treatments were applied when corn was near the V10 growth stage and soybeans were near the R3 stage. Applications were made at this crop stage because the crop canopy was nearly closed and treatment differences were more likely to be observed. Detailed measurements were made of canopy structure within the central portion each plot. This included plant height, plant density, canopy width, and leaf area. Corn height measurements were 1.0 to 1.2 m and soybean heights averaged 0.75 m. The corn and soybean canopies had mean respective average canopy widths of 1 m and 75 cm. The leaf area indices for corn plots at the Big Springs and North Platte locations ranged from 6.6 to 12 and 4.6 to 9.9, respectively. The leaf area indices for the soybean at Big Springs and North Platte ranged from 2.7 to 4.9 and 3.7 to 5.3, respectively.
Glyphosate (Roundup PowerMAX®, Monsanto Company, St. Louis, MO 63167) was applied at 1.26 kg ae ha−1 with liquid ammonium sulfate (Bronc®, Wilbur-Ellis Company, Fresno, CA 93755) at 5% (v/v). In addition, a rhodamine dye (intracid rhodamine WT, Cole Palmer Instrument Company, Vernon Hills, IL 60061) was added at 0.025% (v/v) as a tracer. The treatment factors were carrier volume, drift control adjuvant, and nozzle type. The desired application volume rates were 94 and 187 L ha−1. Apart from changing the glyphosate concentration in the tank-mixture when changing carrier volume from 94 to 187 L ha−1, all other application variables remained the same, except for the application speed which decreased from 16 to 8 km h−1. This was done to ensure droplet size was not a confounding factor in the trial. The nozzle types evaluated in this experiment were the AIXR11005, AITTJ11005, TTI11005, and XR11005 nozzles (Spraying Systems, Wheaton, IL 60189) with 110° spray angles and 1.9 L/min exit orifices (rated for this flow rate at the reference and operational pressure of 276 kPa). The final treatment variable was a drift reduction adjuvant (In-Place®, Wilbur-Ellis Company, Fresno, CA 93755) applied at a rate of one part adjuvant to four parts herbicide.
The experimental design used was a split-plot design with four replications. The whole plot factor for both experiments was the area treated with the spray mixture. The subplot factor for both experiments was the nozzle type. At the Big Springs location, treatments were applied using a John Deere 4830 self-propelled sprayer (John Deere, Moline, IL 61265) with a stainless steel tank and 30-m stainless steel boom. The North Platte treatments were applied using a three-point, tractor-mounted 18-m sprayer (Schaben Industries, Columbus, NE 68601). Applications were made 60 cm above the crop canopy with nozzles spaced 76 cm apart and were centered between each crop row. Each spray boom was divided into five equal sections (subplots) with each section having one type of nozzle. The fifth section on the spray boom was capped and therefore did not spray. This section served as the untreated control for the experiment. The corn experiments were conducted on July 1 and July 11 in North Platte and Big Springs, respectively. Air temperature, relative humidity, and wind speed were on average 18 C, 64%, 12 km h−1, and 21 C, 75%, and 14 km h−1 for North Platte and Big Springs, respectively. The soybean experiments were conducted on August 1 and August 9 in North Platte and Big Springs, respectively. Air temperature, relative humidity, and wind speed were on average 21 C, 60%, 6 km h−1, and 23 C, 75%, and 8 km h−1 for North Platte and Big Springs, respectively.
Canopy penetration and deposition of the spray was measured using Mylar cards that were 10 cm by 10 cm (Grafix Plastics, Cleveland, OH 44137). Five Mylar cards were centered at 0, 19, 38, 57, and 76 cm distances across a board. The board was then positioned within the designated area of the crop near the center of a nozzle section so that the Mylar cards at 0 and 76 cm were positioned in the crop rows (Figure 1). The Mylar card at 38 cm was then in the middle between the two rows of the crop (Figure 1). In both the corn and soybeans within each nozzle section, a board with five cards was placed at the top of the canopy. The board was positioned high enough to ensure that none of the crop canopy would impede the spray from deposition on the cards. The board was held in position by a fiberglass fence post, one end of which was driven into the ground and the other end was inserted into a hole drilled in the underside of the board. In the corn, an additional board with Mylar cards was positioned within each nozzle section in the middle of the canopy approximately 45 cm above the ground using a shorter fence post (Figure 1). Both corn and soybean then had a board with Mylar cards placed on the ground. The different levels of collection stations were separated by at least 3 m to avoid interference in collecting spray deposition. For the soybean experiment, each nozzle type on the spray boom had a set of Mylar cards below the canopy on the ground and above the canopy for a total of 10 cards per nozzle or 50 cards per whole plot. The corn had the same 10 cards plus an additional five cards in the middle of the canopy, for 75 cards per whole plot (Figure 1). With the additional set of cards in the corn, the position of the cards in the canopy, low versus middle, was considered the sub-subplot in the experimental design for the corn.
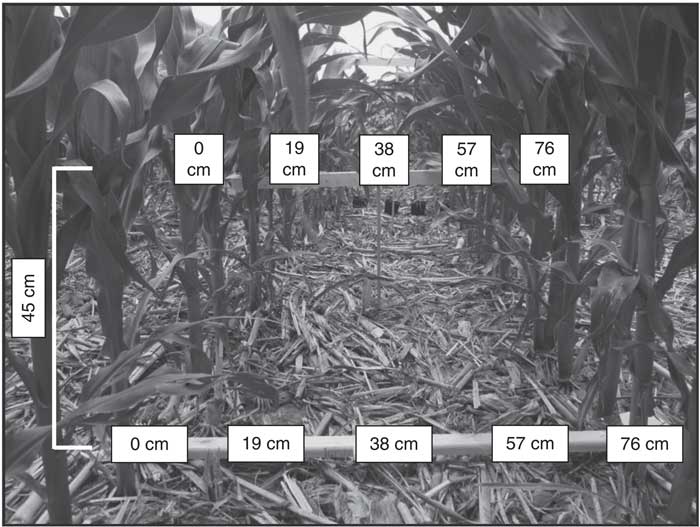
Figure 1 Position of middle and bottom Mylar card collectors in 76-cm corn rows. The collectors were fastened to boards and the middle collectors were positioned on a single fiberglass fence post approximately 45 cm above the bottom collectors. The Mylar card collectors above the canopy (not shown) had the same spacing and were also aligned with the crop rows. Also visible further down the rows are the black pots containing soybeans used as biological indicator plants, which were spaced in the same way as the Mylar cards.
After the plots were sprayed, Mylar cards were collected within 10 min. The cards were placed individually into prelabeled clean plastic reclosable bags. The cards were immediately placed into a dark container following bagging to prevent photodegradation of the dye. After spraying a plot, the sprayer operator would switch the nozzle sections on the spray boom so every replication had a different randomization of the nozzle type within a subplot.
The Mylar cards were taken to the Pesticide Application Technology Laboratory (PAT Lab) in North Platte, Nebraska, to extract and analyze dye concentration using fluorometry techniques. Each bag containing a Mylar card had 40 ml of distilled water added using a bottle top dispenser (Model 60000-BTR, LabSciences, Inc., Reno, NV 89510). The bag was then resealed and the Mylar card and bag was rubbed and agitated to release any dye into the liquid in the bag. After the dye was suspended in the liquid, a 2 ml sample was drawn with a pipette to fill a glass cuvette. The cuvette was placed in a rhodamine/phycoerythrin module inside a fluorometer (Trilogy Laboratory Fluorometer, Turner Designs, Sunnyvale, CA 94085) and fluorescence data were collected at 24 C. Some samples were further diluted using additional distilled water to bring the raw fluorescence unit readings within the required range for known response of the calibrated fluorometry system.
Soybean plants were grown and used in the corn experiment as biological indicators to evaluate herbicide efficacy from penetration to the bottom of the canopy. No biological indicator plants were used in the soybean experiment because the density of the soybean canopy was high. The biological indicator plants were glyphosate-susceptible Asgrow® A3253 soybeans grown in 10 by 10 by 10 cm pots filled with Professional Growers Mix (Ball Horticulture Company, West Chicago, IL 60185) grown in a greenhouse at the PAT Lab. Plants were seeded approximately 1 mo prior to conducting each corn experiment at both field locations and were watered as needed. Plants received supplemental nutrition (Scotts Miracle-Gro® LiquaFeed® All Purpose, The Scotts Company, Marysville, OH 43041) once per week. Supplemental lighting (NeoSolTM DS 300W, Illumitex, Austin, TX 78735) was provided to ensure 14 h photoperiods. Plants were 15 to 20 cm tall when treated in the field. On the day the experiment was conducted, five plants were placed on the ground within each nozzle type between two rows, spaced as the Mylar cards were at 0, 19, 38, 57, and 76 cm. After the experiment had been completed, the plants were transported back to the greenhouse. Visual estimations of injury were recorded at 7, 14, 21, and 28 d after treatment using a scale of 0 to 100, where 0 indicates no control and 100 indicates plant death. At 28 days after treatment, plants were destructively sampled by clipping the plants at the soil surface and recording the fresh weights. These samples were then dried at 40 C for 7 d, after which dry weights were recorded.
The spray droplet size spectrum for each treatment combination was evaluated in 2014 using the low-speed wind tunnel at the PAT Lab. The system and process used to collect the spray droplet data has been described extensively by Creech et al. (Reference Creech, Henry, Werle, Sandell, Hewitt and Kruger2015b). The particle size measurement system and software output allow for classification of the spray droplet size spectrum using the American Society of Agricultural and Biological Engineers (ASABE) standard S572 (ASABE 2009). The treatments in this experiment were compared using the Dv0.1, Dv0.5, and Dv0.9 parameters, which represent the droplet size such that 10%, 50%, and 90% of the spray volume is contained in droplets of equal or smaller values, respectively. The use of reference nozzles and curves allow for comparison of data obtained from other laboratories or methods (Fritz et al. Reference Fritz, Hoffmann, Bagley, Kruger, Czaczyk and Henry2014).
Statistical Analysis
Because of differences in application timing and sampling methods, corn and soybean results were analyzed separately. The deposition rates were calculated as a percent of the applied rate as determined from the amount of spray deposited on the Mylar cards above the canopy. The Mylar cards from the nozzle section on the spray boom that was capped did not show any tracer dye (data not shown). This indicated minimal movement of spray between nozzle sections and therefore the results from the capped section were not used in the final data analysis. Deposition data from the field studies were compared using a generalized linear mixed model analysis of variance in the GLIMMIX procedure of SAS version 9.3 (SAS Institute, Cary, NC 27513). Data from the field locations were combined and analyzed together with replication nested within location and considered a random effect, as suggested by Carmer et al. (Reference Carmer, Nyquist and Walker1989), as no significant effect for either the corn or soybean studies existed. Least squares means were compared for significant fixed effects at α=0.05.
For the soybean plants that were used as biological indicator plants of herbicide efficacy in the greenhouse experiment, the analysis of visual injury data was performed using repeated measures, which allowed for pooling of means across rating intervals. Akaike’s information criterion with a correction for finite sample sizes (AICc) was used, as suggested by Burnham and Anderson (Reference Burnham and Anderson2002), to select the appropriate covariance model to use in the repeated measure analysis. The AICc indicated the default covariance model used by GLIMMIX best fitted the data, so this was used for repeated measure analysis. In addition, the Kenward-Rogers degree-of-freedom approximation procedure was used to account for instances of missing data from plants that were damaged during transport to and from the field sites. The analysis for the estimations of visual injury had replication nested within location designated as a random effect in the model. Percent biomass reduction for treated experimental units was calculated using both the fresh and dry weights relative to the average biomass of the nontreated control plants in the experiment:
 $${\rm Percent}\,{\rm biomass}\,{\rm reduction}\,{\equals}\,\left( {\left( {\bar{C}{\minus}{B \mathord{\left/ {\vphantom {B {\bar{C}}}} \right. \kern-\nulldelimiterspace} {\bar{C}}}} \right)} \right)100,$$
where
 $\bar{C}$
is the mean biomass of the nontreated control replicates and B is the biomass of an individual experimental unit after being treated. Values for injury ratings and biomass reduction were compared using GLIMMIX in SAS (Littell et al. Reference Littell, Milliken, Stroup, Wolfinger and Schabenberger2006). Least squares means were compared for significant fixed effects at α=0.05.
$\bar{C}$
is the mean biomass of the nontreated control replicates and B is the biomass of an individual experimental unit after being treated. Values for injury ratings and biomass reduction were compared using GLIMMIX in SAS (Littell et al. Reference Littell, Milliken, Stroup, Wolfinger and Schabenberger2006). Least squares means were compared for significant fixed effects at α=0.05.
Results and Discussion
Spray Droplet Size
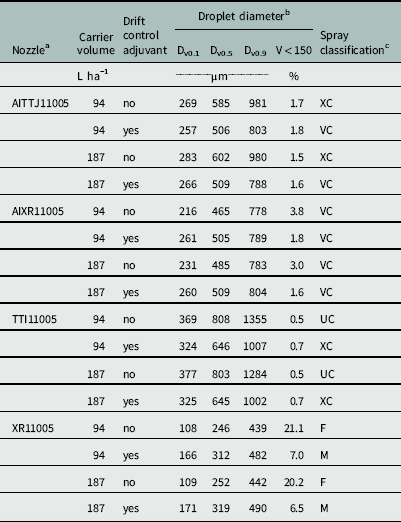
The droplet size spectra of each treatment are presented in Table 1. The XR nozzle had the smallest Dv0.5 values. Without the DRT, the XR nozzle had a fine (F) spray, and nearly 20% of the spray volume was contained in droplets less than 150 μm (Table 1). With the addition of the DRT, the XR nozzle had a medium (M) spray, and less than 7% of the spray volume was contained in droplets less than 150 μm (Table 1). A similar reduction in spray volume less than 150 μm occurred with the AIXR nozzle with a mean decrease from 3.4 to <1.7% (Table 1). The four treatments with the AIXR nozzle remained a very coarse (VC) spray, although the Dv0.5 value increased (Table 1). Without the DRT, the AITTJ produced larger spray droplets than the AIXR, and had an extremely coarse (XC) spray. The TTI nozzle had the largest spray droplets, with an average Dv0.5 value of 726 μm and spray volume less than 150 μm below 1% (Table 1). However, the addition of the DRT to the AITTJ and the TTI reduced the nozzle’s spray from XC to VC and from ultra coarse (UC) to XC, respectively. Creech et al. (Reference Creech, Henry, Fritz and Kruger2015a) reported the TTI nozzle was often highly variable for droplet size spectra and did not always produce the same trends established by other nozzles as application parameters changed. The AIXR, AITTJ, and TTI nozzles utilize venturi technology, whereas the XR nozzle is a standard hydraulic nozzle. The likely cause of the difference in spray droplet size when using the DRT is the incorporation of a turbulence chamber in the AITTJ and TTI nozzle designs. This chamber mixes air with the spray liquid causing a turbulence that can render some DRTs ineffective.
Table 1 Droplet size spectra for glyphosate sprays applied with different nozzle types at two carrier volumes with and without a drift control adjuvant.

a Teejet Technologies, Spraying Systems Co., Wheaton, IL 62703.
b Dv0.X represents droplet diameter below which 0.x of the spray volume is contained in droplet sizes smaller than the given value. V<150 represents the percentage of the spray volume contained in droplets with diameter below 150 µm.
c Spray classification categories were derived from reference curves generated at the Pesticide Application Technology Laboratory based on the ASABE S572.1 standard: F, fine; M, medium; C, coarse; VC, very coarse; XC, extremely coarse.
Another unique characteristic of the AITTJ and TTI nozzles is the angle of the spray leaving the nozzle orifice. The spray from XR and AIXR nozzles exits the orifice perpendicular to the ground, whereas the spray from a TTI nozzle exits forward 15° offset from vertical, and the AITTJ has two exit orifices with one spraying 30° forward and the other 30° backward of perpendicular. While the spray angle should not be the cause of the decrease in droplet size when using the AITTJ or TTI nozzles with a DRT, an angled spray could increase deposition (Richardson Reference Richardson1987) or herbicide efficacy (Jensen Reference Jensen2007). These differences in droplet size due to nozzle type and response to DRT adjuvant in addition to considering the potential implications of spray angles will add clarity to the deposition and efficacy results.
Spray Deposition in Corn
The height of the collector position in the corn canopy had an effect (P=0.0029) on the amount of spray deposition collected. The Mylar cards positioned 45 cm above the ground collected nearly 50% of the total applied rate (Figure 2). The corn leaves above these Mylar cards accounted for 75% of the total leaf area of the entire corn plant, on average (data not shown). The collectors positioned near the ground collected nearly 42% of the total applied rate, which was less than the middle collectors collected (Figure 2). Similarly, Zhu et al. (Reference Zhu, Dorner, Rowland, Derksen and Ozkan2004) reported a dramatic decrease in spray deposition in peanut canopies from top to bottom. Although the middle collectors were positioned near the center of the corn plant, the majority of the corn leaf area is toward the top of the plant competing for light.

Figure 2 Spray deposition on Mylar cards as influenced by collector height in a corn canopy. Mylar cards were positioned on the ground and 45 cm above the ground. Letters indicate significant differences (α=0.05) across collector position height in the corn canopy. Values are expressed as a percentage of the collection at the top of the canopy.
The distance of the Mylar cards between the corn rows also had an effect (P<0.001) on the amount of spray deposition collected. The cards positioned in between the two rows, centered 38 cm from each row, had the greatest spray deposition (59%) (Figure 3). Mylar cards 19 cm from either row had 50% deposition and Mylar cards positioned within the corn row had deposition of 36% (Figure 3). The decrease in deposition closer to the corn row was also manifested in the decrease in efficacy observed with the biological indicator plants. Visual ratings of the indicator plants placed in the corn rows had on average 7% less injury than plants placed toward the center of the rows (P<0.0001) (Figure 4).

Figure 3 Spray deposition on Mylar cards as influenced by collector position across a corn row. Mylar cards were positioned on the ground and 45 cm above the ground at 0, 19, 38, 57, and 76 cm with the 0 and 76 cm Mylar cards positioned directly in the corn rows. Letters indicate significant differences (α=0.05) across collector position across the corn row. Values are expressed as a percentage of the collection at the top of the canopy.

Figure 4 Estimation of visual injury on soybean used as a biological indicator plant as influenced by position across the corn row when placed on the ground. Plants were spaced at 0, 19, 38, 57, and 76 cm across the row with the 0 and 76 cm positioned directly in the corn rows. Letters indicate significant differences (α=0.05) across collector position across the corn row.
A significant interaction (P=0.0036) between spray mixture and nozzle type impacting deposition rates at different heights in the canopy was observed. The AITTJ, AIXR, and XR nozzles all had greater spray deposition when DRT was used in the 94 L ha−1 spray mixture (Figure 5). When the DRT was used at 187 L ha−1 with those same nozzles, the deposition decreased compared to the spray mixture at the same carrier volume with no DRT (Figure 5). Our results indicate that the use of a DRT with air-induction nozzles with turbulence chambers may not always perform as expected, producing smaller sized droplets (Table 1) and in the case of the TTI nozzle, did not improve spray deposition (Figure 5). Because the spray droplet size of the AITTJ nozzle decreased with the addition of the DRT to the spray solution, it produced a spray quality nearly identical to that of the AIXR nozzle with the DRT (Table 1). The AITTJ did not increase deposition compared to the AIXR nozzle when using the DRT (Figure 5). The AITTJ with its dual fans is marketed as a nozzle to provide good coverage and penetration (Anonymous 2011). Coverage and deposition are mutually exclusive. If the aim of the herbicide application is to target weeds below a crop canopy, having a good level of coverage on the crop canopy will not necessarily provide deposition on weed targets below the canopy. The injury ratings of the biological indicator plants had an interaction (P=0.021) between spray mixture and nozzle. The results did not correlate well with the spray deposition results in Figure 5. The 187 L ha−1 treatment without the DRT is a good example (Figure 6). The XR nozzle, which had the greatest proportion of small spray droplets among the nozzles evaluated and a vertical spray fan, had greater deposition at the bottom of the canopy (Figure 5). Using a greater carrier volume generally did not increase the percent of spray deposition recovered across the different treatments (Figure 5). This indicated that doubling the carrier volume essentially increased the amount of spray deposition proportionally while keeping the percentage the same (Figure 5). Although the 187 L ha−1 with DRT application had a low spray deposition (Figure 5), the efficacy was greater than that of most other treatments (Figure 6).
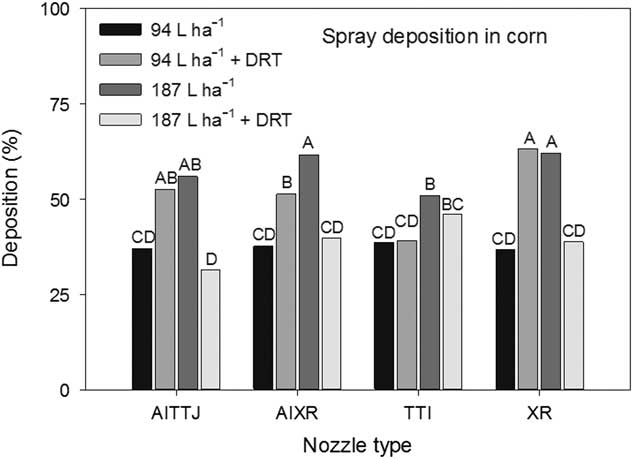
Figure 5 The interaction of spray mixture and nozzle type on spray deposition into a corn canopy. The spray mixture included two carrier volumes with and without a drift reduction adjuvant (DRT). Letters indicate significant differences (α=0.05) across nozzle type and spray mixture.
Figure 6 Estimation of visual injury of soybean used as a biological indicator plants as influenced by the interaction of spray mixture and nozzle type in a corn canopy. The spray mixture included two carrier volumes with and without a drift reduction adjuvant (DRT). Letters indicate significant differences (α=0.05) across nozzle type and spray mixture. Plants were evaluated on a scale of 0 to 100, in which 0 was no observed injury and 100 was complete plant death.
The wet and dry weight reductions of the biological indicator plants both had a spray mixture main effect (P=0.004 and P<0.001, respectively) (Figure 7). Greater wet weight reductions were observed when using 94 L ha−1 without DRT and 187 L ha−1 with DRT (Figure 7). Dry weight reductions were greatest using 94 L ha−1 without DRT and 187 L ha−1 with DRT, though not different than 187 L ha−1 without DRT (Figure 7). At 35%, dry weight reductions at 94 L ha−1 with DRT was the smallest. These results generally conform to the injury ratings presented in Figure 6. There was a nozzle main effect for wet weight reduction (P=0.0306) and the AIXR had a wet weight reduction (69%) that was greater than that of the AITTJ nozzle (62%) (Figure 8). On average, the AIXR nozzle had 48% spray deposition compared to 44% for the AITTJ, and this was reflected in the wet weight reductions of the indicator plants.
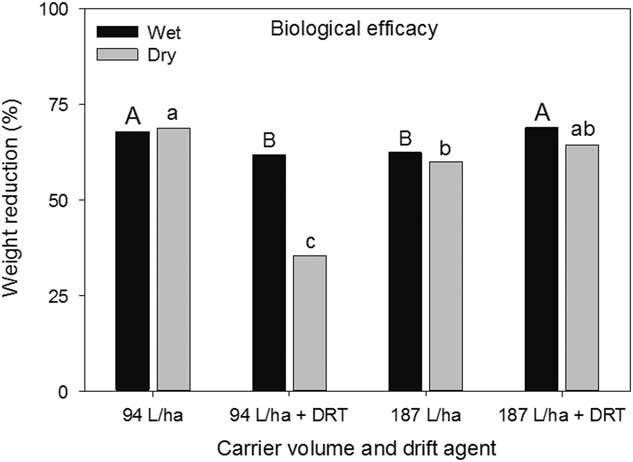
Figure 7 Wet and dry weight reductions of soybean used as a biological indicator plant as influenced by spray mixture in a corn canopy. The spray mixture included two carrier volumes with and without a drift reduction adjuvant (DRT). Letters indicate significant differences (α=0.05) across spray mixtures and within wet or dry weight reductions.
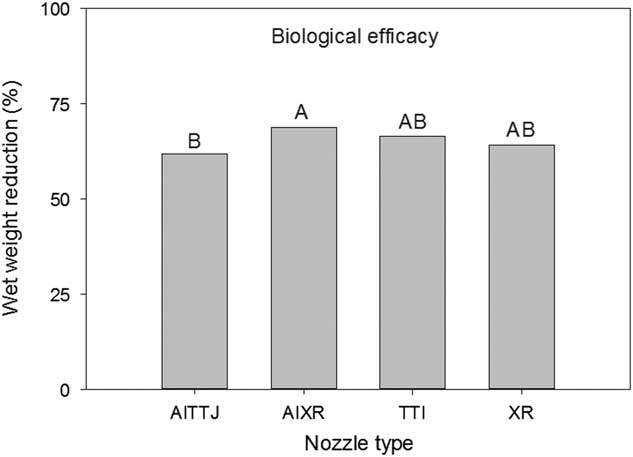
Figure 8 Wet weight reduction of soybean used as a biological indicator plant as influenced by nozzle type in a corn canopy. The spray mixture included two carrier volumes with and without a drift reduction adjuvant (DRT). Letters indicate significant differences (α=0.05) across nozzle type.
Spray Deposition in Soybean
There was an interaction between the distance of the Mylar cards between soybean rows and nozzle type (P<0.001) on the amount of spray deposition collected. The cards positioned in the middle between the two rows had the greatest spray deposition at 56%, 45%, 41%, and 36% when compared to other collector positions closer to the soybean row for the TTI, XR, AIXR, and AITTJ nozzles, respectively (Figure 9). At the time of application, the soybean canopies were nearly closed. Thus, if a target weed was growing near the center in between the two rows, it would receive about 50% of the intended application on average or half the rate. Mylar cards positioned within the soybean rows collected 8% of the applied herbicide rate (Figure 9). In most instances, the TTI nozzle had the greatest spray deposition, followed by the XR, AIXR, and AITTJ nozzles. Similar to the results observed in the spray deposition into the corn canopy, the AITTJ, with its dual angled sprays, did not increase deposition in the bottom of the soybean canopy. It is likely that the AITTJ had greater coverage on the upper portion of the soybean canopy, which limited the amount of spray deposited at the ground level. Richardson (Reference Richardson1987) concluded that droplet trajectories that are not vertical were more effectively captured in plant canopies because of the increase in the quantity of foliage in their path. This would explain why a nozzle with an angled spray similar to the TTI or AITTJ might have less deposition in the lower levels of a fully developed plant canopy.
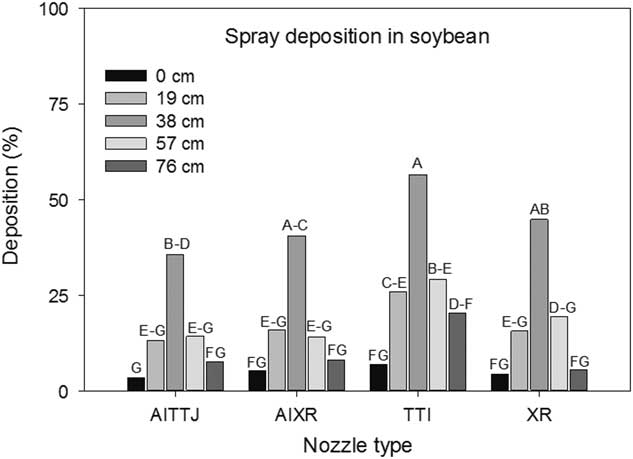
Figure 9 The interaction of collector position across a soybean row and nozzle type on spray deposition into a soybean canopy. Mylar card collectors were spaced at 0, 19, 38, 57, and 76 cm across the soybean row with the 0 and 76 cm positioned directly in the soybean rows. Letters indicate significant differences (α=0.05) across collector position and nozzle type.
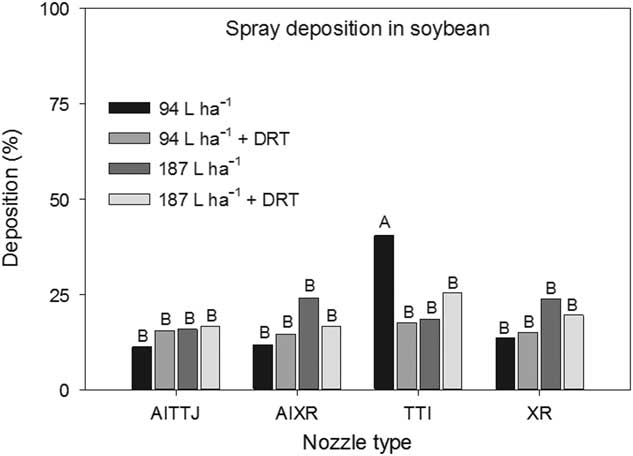
There was a spray mixture and nozzle type interaction (P=0.004) (Figure 10). The TTI nozzle at 94 L ha−1 had the greatest deposition rate at 40%, and no other differences existed. There was a general trend in deposition increasing as carrier volume increased and when DRT was used. Differences across nozzle types were not observed. Zhu et al. (Reference Zhu, Dorner, Rowland, Derksen and Ozkan2004) reported less spray deposition in peanut canopies when using an XR nozzle and observed higher deposition using a twin-jet nozzle compared to a hollow-cone nozzle. When a droplet impacts a plant surface, it will either be retained through adhesion, bounce, shatter, or roll off. Droplets that are not retained can continue through the canopy and may be retained on a lower leaf or may impact the ground (Schou et al. 2012).

Figure 10 The interaction of spray mixture and nozzle type on spray deposition into a soybean canopy. The spray mixture included two carrier volumes with and without a drift reduction adjuvant (DRT). Letters indicate significant differences (α=0.05) across nozzle type and spray mixture.
Additional research is needed to evaluate the growth stage of crops on spray penetration to evaluate if application technology recommendations need to change during the growing season. The link between spray deposition and biological efficacy needs to be explored further with crop/weed interplant competition taken into consideration. Research is also needed to evaluate contact herbicides to determine if the trends in spray deposition and biological efficacy for systemic herbicides are similar. This research clearly shows the complexity of spray applications and the need for tailoring nozzle selection, adjuvants, active ingredients, and application rates for every pesticide application.
The applications made into both corn and soybean canopies were conducted with robust canopies to maximize differences in treatment factors. Such an application would represent a worst case scenario for canopy penetration of an herbicide application and would also be similar to a late-season rescue application aimed at controlling weed escapes. The goals of an herbicide application and the location of the target pests should dictate the method of the application. Our results demonstrated the negative impact turbulence chambers in nozzle designs can have on the droplet size when using certain DRTs to try to increase spray droplet size. Spray deposition in corn was greatest when using the XR, AIXR, and TTI nozzles that had single-fan patterns. The TTI nozzle had the greatest spray deposition in soybean. The AITTJ nozzle consistently had low spray deposition when compared to the other nozzles, because more spray was captured in the upper portion of the crop canopy. Differences in the amount of spray deposition collected across the row were also present.
Acknowledgments
The authors express their appreciation for the support received from members of Dr. Kruger’s lab in conducting this research. Partial funding for this work was generously provided by the Nebraska Soybean Board.