


Introduction
A geographic information system (GIS) is defined as a computer system used for capturing, storing, analyzing, and managing data and associated attributes that are spatially referenced to the earth. A GIS consists of five components: (1) software (tools used to complete visualization and analysis of the data) (Steiniger and Weibel Reference Steiniger and Weibel2009), (2) hardware (i.e., computer in which the software is installed), (3) methods and procedures (i.e., designed plans), (4) data (i.e., geographic features and their attributes), and (5) people (i.e., users). Key functions of these systems include (1) data visualization and exploration, (2) data creation, (3) data editing, (4) data storage, (5) data conflation, (6) data queries, (7) data analysis, (8) data transformation, and (9) creation of maps (Steiniger and Hunter Reference Steiniger and Hunter2013). GIS has shown promise as a decision support tool in scientific investigations, resource management, asset management, environmental impact assessment, urban planning, cartography, criminology, history, sales, marketing, and route planning. Furthermore, GIS programs serve as the basis for variable-rate applications in precision agriculture encompassing irrigating, spraying, cultivating, planting, fertilizing, and tilling (Usery et al. Reference Usery, Pocknee and Boydell1995; Wilson Reference Wilson1999; Clay Reference Clay2011; Clay and Shanahan Reference Clay and Shanahan2011).
GIS software products are available as free software and commercial software. The former is further subdivided into free and open-source software (FOSS), meaning the source code is published under a free-software license agreement with end users’ right (i.e., freedom) to run the program for any purpose, to study how the program works, to adapt it, and to redistribute copies including modifications (Stallman Reference Stallman1985; Neteler et al. Reference Neteler, Bowman, Landa and Metz2012; Steiniger and Hunter Reference Steiniger and Hunter2013). Additionally, the user does not have to pay for FOSS. Commercial software products do not allow the user the privileges described above. The robustness of FOSS is on the same level as commercial software, because the algorithms undergo quality peer review and facilitation of customization, and they have good and fast support via email lists and Web forums (Cagnacci and Urbano Reference Cagnacci and Urbano2008; Steiniger and Hay Reference Steiniger and Hay2009). The abbreviation FOSS4G is currently being used for free and open-source GIS software. Steiniger and Hunter (Reference Steiniger and Hunter2013) provide a detailed overview of the origins of free software and distinct differences between free and commercial software.
Commercial GIS software has played an important role in weed surveys (Dille et al. Reference Dille, Vogel, Rider and Wolf2011; Fox and Pullar Reference Fox and Pullar2011; Gumz and Weller Reference Gumz and Weller2011; Reitsma and Clay Reference Reitsma and Clay2011). Nevertheless, their costs have often been an issue in implementing GIS into agriculture. Commercial GIS software costs range from several hundred dollars to several thousand dollars. Final cost depends on additional features included with the software package. As indicated earlier, commercial software packages are closed source, meaning the user does not have access to the source code. Additional fees are charged for extra licenses. Thus, interest is growing in the research community to evaluate FOSS4G for research applications (Chen et al. Reference Chen, Shams, Carmona-Moreno and Leone2010). FOSS4G has more options for tailoring the software to meet the analysts’ needs and may be practical for weed management. FOSS4G has been used successfully to manage water resources (Luijten et al. Reference Luijten, Knapp, Sanz and Jones2003; Andreas Reference Andreas2007; Yagoub and Engel Reference Yagoub and Engel2009).
Precision weed management is described as placing the right amount of an input on the target weed growing at a specific location in the field of interest. Researchers and practitioners need to know whether precision weed management limited to an individual field or is useful on a larger scale, for example, country, state (province), or county level. For example, if one country, area, or farm used a specific protocol to control a weed, and another country, adjoining area, or farm used a different tactic, is that considered precision weed management? Different states within a country or farms within a country may treat and control weeds differently. Counties within a state may use different strategies to control specific weeds. Weed control is based on an individual farmer and consultant experience. If an herbicide-resistant weed is found within a county, then the weed management practice that is best to control the weed or stop it from spreading is implemented. Based on those scenarios, precision weed management can be applied at various scales, country, state, county, or field. Furthermore, map data provided by government agencies’ highest spatial detail is often at the county level. Therefore, many believe that establishing a GIS database of weeds at a county level within states may be ideal for implementing weed management strategies and best takes advantage of other free geospatial data.
Palmer amaranth, redroot pigweed, and tall waterhemp are pigweed species that impact corn (Zea mays L.), cotton (Gossypium hirsutum L.), and soybean [Glycine max (L.) Merr.] production systems in the southeastern United States (Johnson et al. Reference Johnson, Davis, Kruger and Weller2009; Webster and Nichols Reference Webster and Nichols2012; Nandula et al. Reference Nandula, Ray, Ribeiro, Pan and Reddy2013; Norsworthy et al. Reference Norsworthy, Griffith, Griffin, Bagavathiannan and Gbur2014; Heap Reference Heap2015). Additionally, these weed species affect rights-of-way and commercial and home vegetable gardens. These plants produce numerous seeds whether they are in competition with crops or growing alone. Chemical and mechanical means are used to control these pigweeds; however, Palmer amaranth, redroot pigweed, and tall waterhemp have exhibited resistance to multiple herbicide sites of action: (1) acetolactate synthase inhibitors, (2) 5-enolpyruvylshikimate-3-phosphate synthase inhibitor, (3) microtubule inhibitors, (4) photosystem II inhibitors, (5) 4-hydroxyphenylpyruvate dioxygenase inhibitors, (6) protoporphyrinogen oxidase inhibitors, and (7) synthetic auxin herbicides (Webster and Nichols Reference Webster and Nichols2012; Nandula et al. Reference Nandula, Ray, Ribeiro, Pan and Reddy2013; Chahal et al. Reference Chahal, Aulakh, Jugulam and Jhala2015; Heap Reference Heap2015). To implement management strategies, agriculturalists need information on areas affected by these pigweeds. The objective of this study was to demonstrate the application of free and open-source GIS software to derive maps showing the locations of Palmer amaranth, redroot pigweed, and tall waterhemp at the county level for the southeastern United States. The objective specifically focused on using QGIS software to develop maps, on showing the presence or absence of each weed on derived maps, on showing the distribution of glyphosate resistance (GR) for each weed, and on showing pigweed distribution related to cultivation.
Materials and Methods
The study area was the southeastern United States (Figure 1). It consisted of 12 states and 1,025 counties (Figure 1).
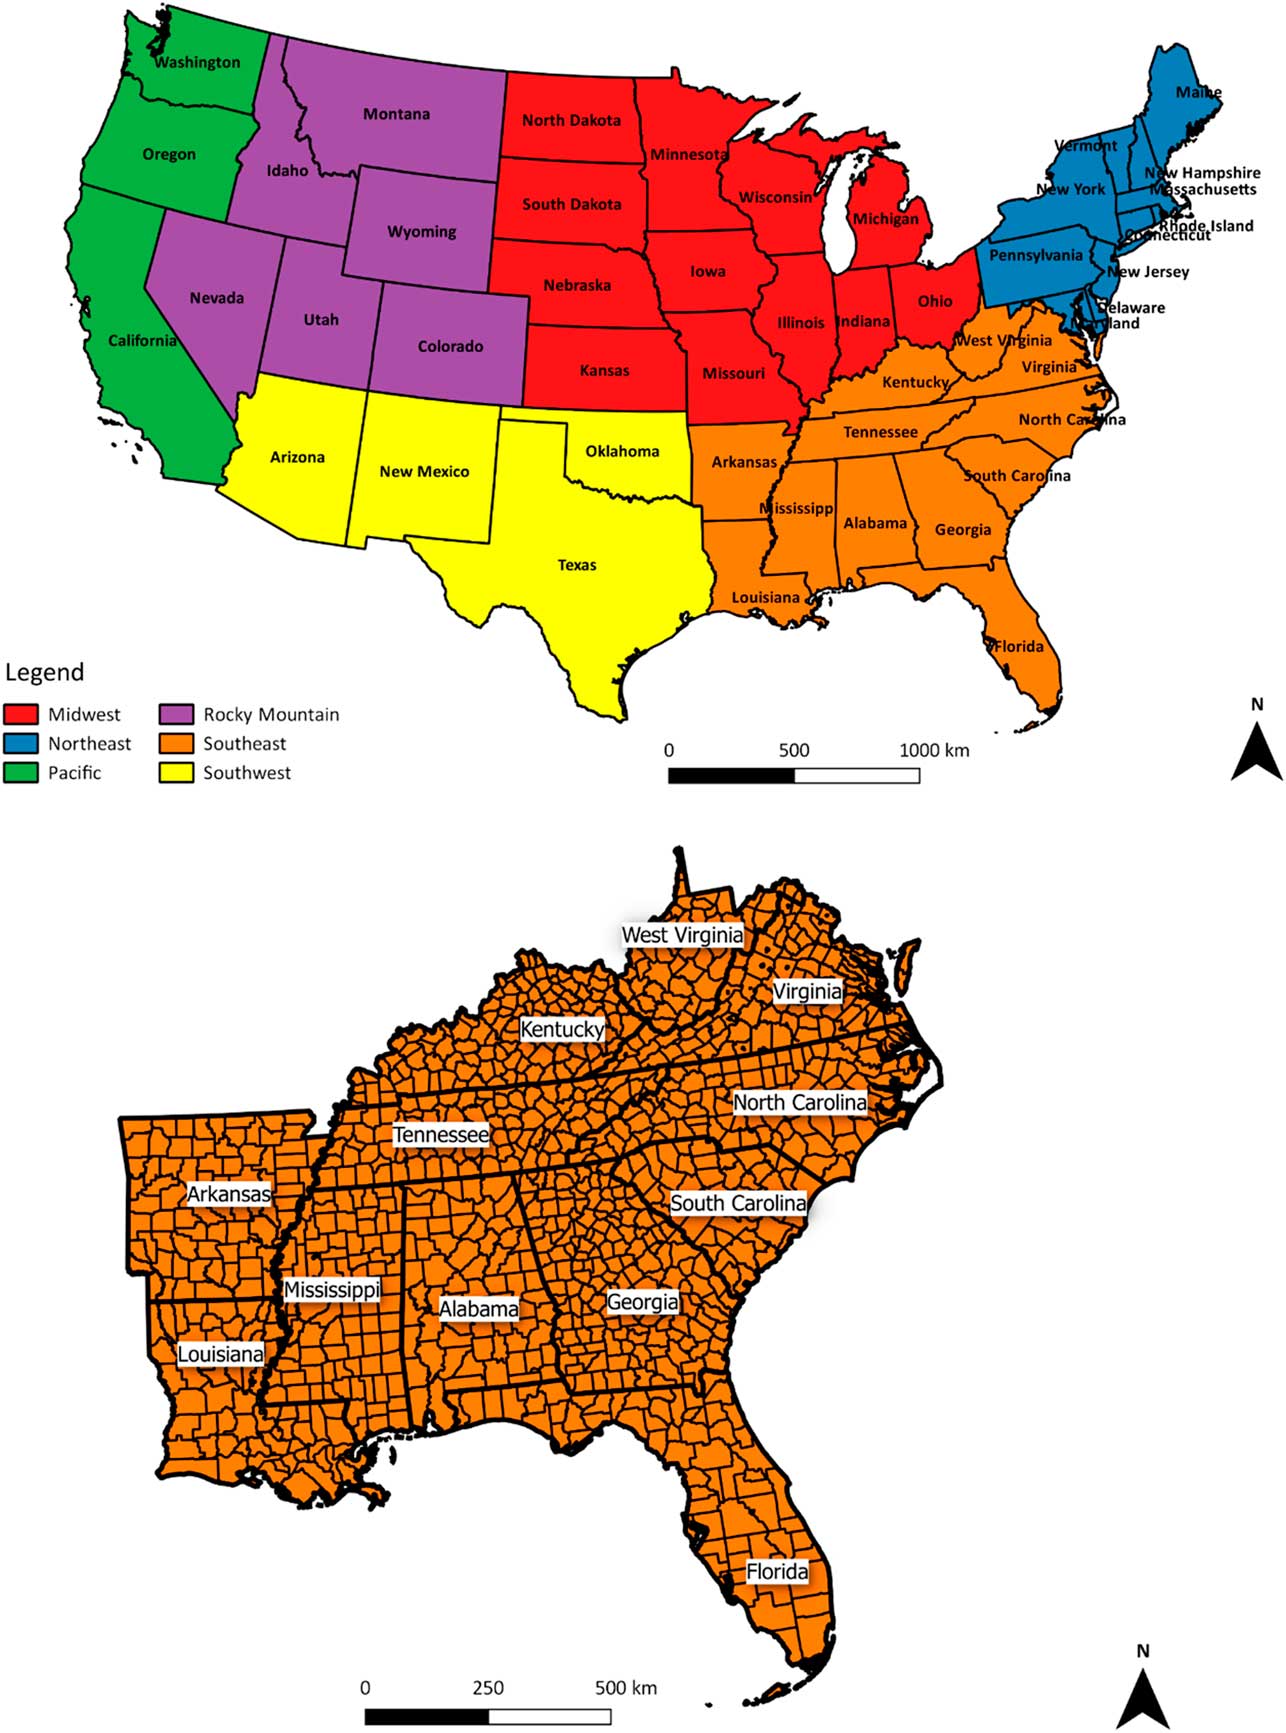
Figure 1 (Top) Geographic regions of the contiguous United States. (Bottom) Close-up showing counties within the southeastern United States. Number of counties = 1,025.
QGIS (2.18 Las Palmas, Windows version), a free and open-source geographic information system software, was used to develop the maps. It was downloaded from the QGIS website (http://www.qgis.org/en/site/) and is licensed under GNU General Public License (Free Software Foundation 2016). The software has its own geoalgorithms for processing data and has access to and integrates well with other free and open-source products’ geoalgorithms (Chen et al. Reference Chen, Shams, Carmona-Moreno and Leone2010), increasing the number of techniques users have at their disposal for analyzing geographic data (Figure 2). The software is compatible with Linux, Apple, and Windows operating systems. An international community supports the software.
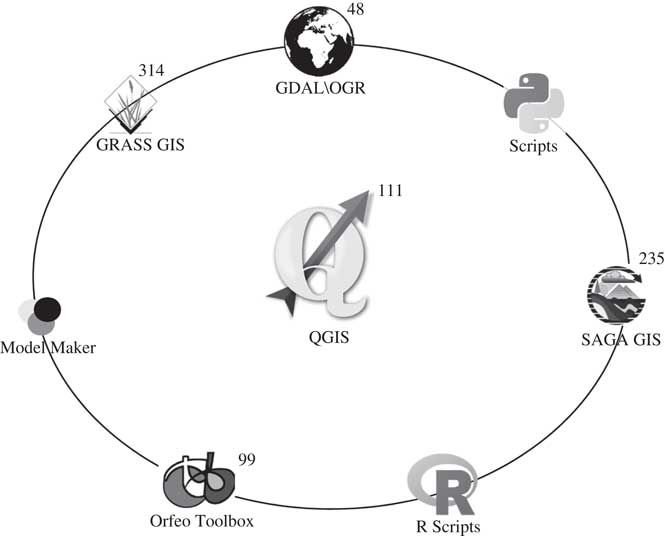
Figure 2 Number of QGIS geoalgorithms and other software processing tools integrated into the software.
2016 Tiger\Line shapefiles composed of state and county boundary data were downloaded from the US Census Bureau website (https://www.census.gov/data.html). A project containing the state and county boundary data was established in QGIS. Before further analysis, the data were re-projected from the North American Datum 83 projection to the Lambert Conformal Conic projection with QGIS. This projection is good for large regions located at mid-latitudes (approximately 20° to 60° North and South), such as the United States, and it preserves the shape of features. Lambert Conformal Conic projection was the base coordinate system used for the remainder of the study.
The southeastern states were extracted from the contiguous US map by selecting the states on-screen and then copying and pasting them as a new vector layer in the project file. Then, the southeastern states’ boundaries were used to extract the counties from the county database for the states of interest (Figure 1).
An attribute table (i.e., similar to spreadsheet with information in columns and rows) accompanied the southeastern state and county boundaries map layers. Palmer amaranth, redroot pigweed, and tall waterhemp columns were added to the southeastern United States county map attribute table for inputting data pertaining to the pigweeds. The following information was added to the pigweed columns for each county: (1) glyphosate resistant (GR), (2) present and no GR data, and (3) absent\unreported. GR indicates that GR populations have been identified and reported in that county. Present and no GR data category indicates that the weed has been reported in the county, but no GR information has been reported. Absent\unreported category indicates that no reports have been submitted on the presence of the weed in the county of interest.
Data pertaining to the pigweeds were obtained from the US Department of Agriculture (USDA) plant database (https://plants.usda.gov/java/), Biota of North America Program database (http://www.bonap.org/), Pollen Library (http://www.pollenlibrary.com/), International Survey of Herbicide Resistant Weeds (http://www.weedscience.org/), Take Action (http://iwilltakeaction.com/), university websites (University of Georgia 2012; Weed Science Group 2015; EDDMaps 2016; Keener et al. Reference Keener, Diamond, Davenport, Davison, Ginzbarg, Hansen, Major, Spaulding, Triplett and Woods2017; Stephenson et al. Reference Stephenson, Miller and Copes2016), and published literature (Nichols et al. Reference Nichols, Bond, Culpepper, Dodds, Nandula, Main, Marshall, Mueller, Norsworthy, Price, Patterson, Scott, Smith, Steckel, Stephenson, Wright and York2009; Hollis Reference Hollis2011; Poirier et al. Reference Poirier, York, Jordan, Chandi, Everman and Whitaker2014). The websites and literature indicated the pigweed data were obtained from rights-of-way, abandoned areas, public areas, and agricultural fields. After compiling the information into the database, database queries were used to extract information related to each category, and then maps were created to show distribution of pigweed by category.
The 2015 cultivated data layer of the United States was downloaded from the National Agricultural Statistics Service (NASS) website (https://www.nass.usda.gov/). It contained cultivated and noncultivated land cover of the continental United States, derived from land cover information obtained from 2011 through 2015 USDA, NASS Cropland Data Layers. The cultivated layer is defined as agricultural land prepared for crop cultivation, as fallow agricultural land, or as idle cropland. A pixel in the data layer was labeled as cultivated if the following criteria were met in the Cropland Data Layer: (1) if the area was labeled as cultivated in at least 2 out of the 5 years (i.e., 2011 thru 2015) or (2) if the pixels were labeled as cultivated in the most recent year. According to NASS, “the cropland data layer is a raster, geo-referenced, crop-specific land cover data layer created annually for the continental United States using moderate resolution satellite imagery and extensive agricultural ground truth.” Furthermore, the cultivated data layer was a geo-referenced raster data layer with a ground resolution of 30 m. A more detailed description of the cultivated data layer may be found in Boryan et al. (Reference Boryan, Yang and Di2012). The cultivated data layer was transferred to the QGIS software and re-projected to the Lambert Conformal Conic projection. It was used to view weed and cultivated distribution simultaneously for the counties.
Results
For Palmer amaranth, 275, 146, and 604 counties were grouped into GR, present–no GR data, and absent\no data available categories, respectively (Figure 3). GR Palmer amaranth distribution occurred in counties clustered in southern Georgia and Alabama, in the eastern and central portions of South Carolina, North Carolina, Arkansas, and Louisiana, and in the western sections of Kentucky, Tennessee, and Mississippi. Counties grouped into present and no GR class were observed in isolated clusters and in clusters adjacent to GR counties.
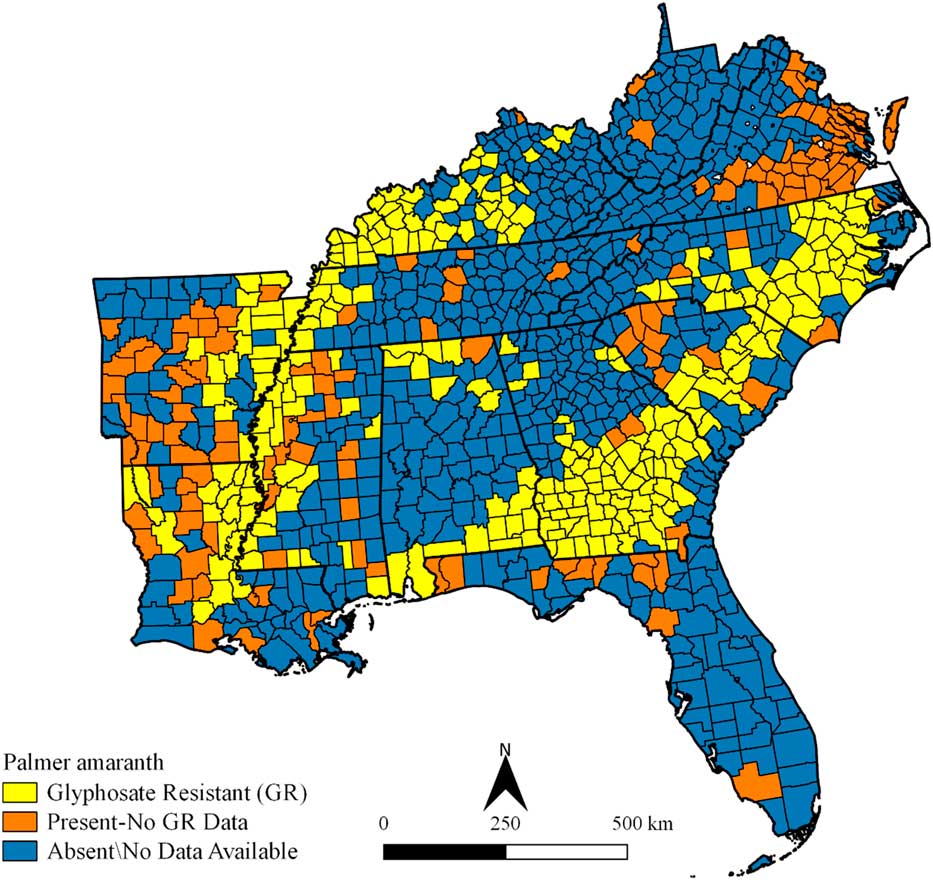
Figure 3 Palmer amaranth glyphosate-resistance status and distribution in the southeastern United States. Refer to Figure 1 for state names.
Redroot pigweed has been documented in 197 of the 1,025 counties (Figure 4). Most of the counties were located in Mississippi, Arkansas, and Louisiana. A few counties in Kentucky, Virginia, West Virginia, North Carolina, South Carolina, and Florida have reported the presence of redroot pigweed. No information was found on GR redroot pigweed within the study area.
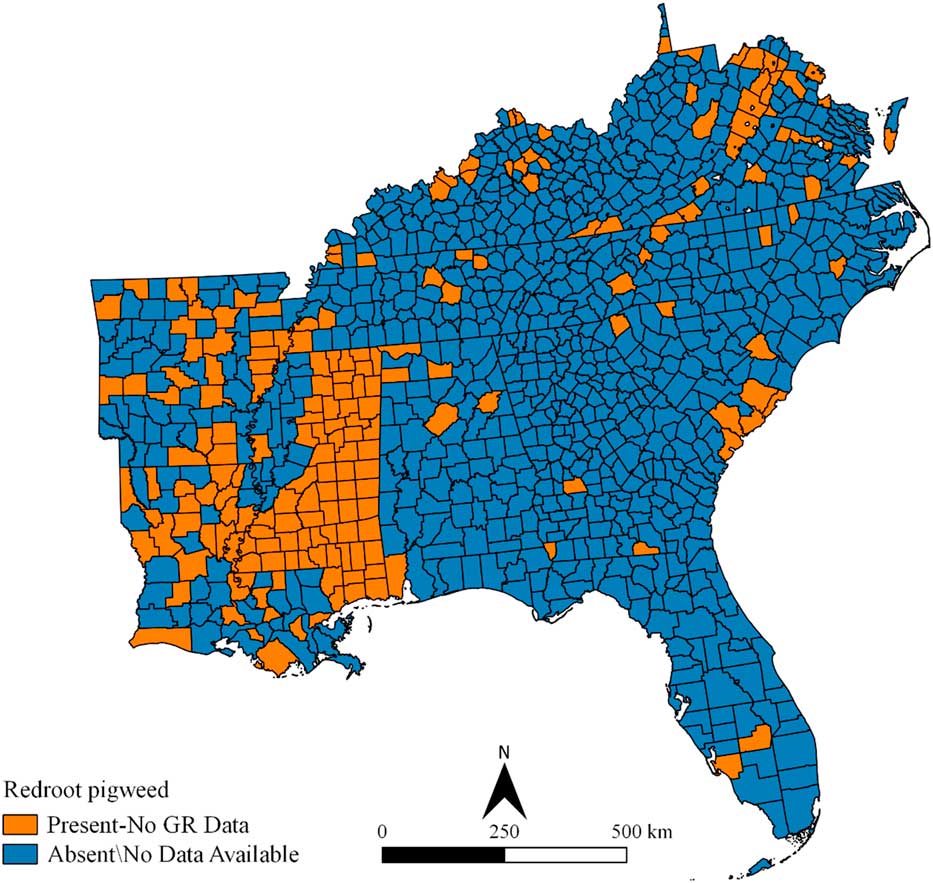
Figure 4 Redroot pigweed distribution in the southeastern United States. Refer to Figure 1 for state names.
For tall waterhemp, GR, present–no GR data, and absent\no data available categories occurred in 22, 156, and 847 counties, respectively (Figure 5). GR tall waterhemp has been documented mainly in western Kentucky and a few counties scattered throughout Kentucky, Mississippi, and Louisiana (Figure 5). Counties grouped into the present–no GR data class were prevalent in Arkansas and Louisiana and scattered in small clusters and single counties within Alabama, Georgia, Mississippi, North Carolina, South Carolina, Tennessee, and West Virginia.
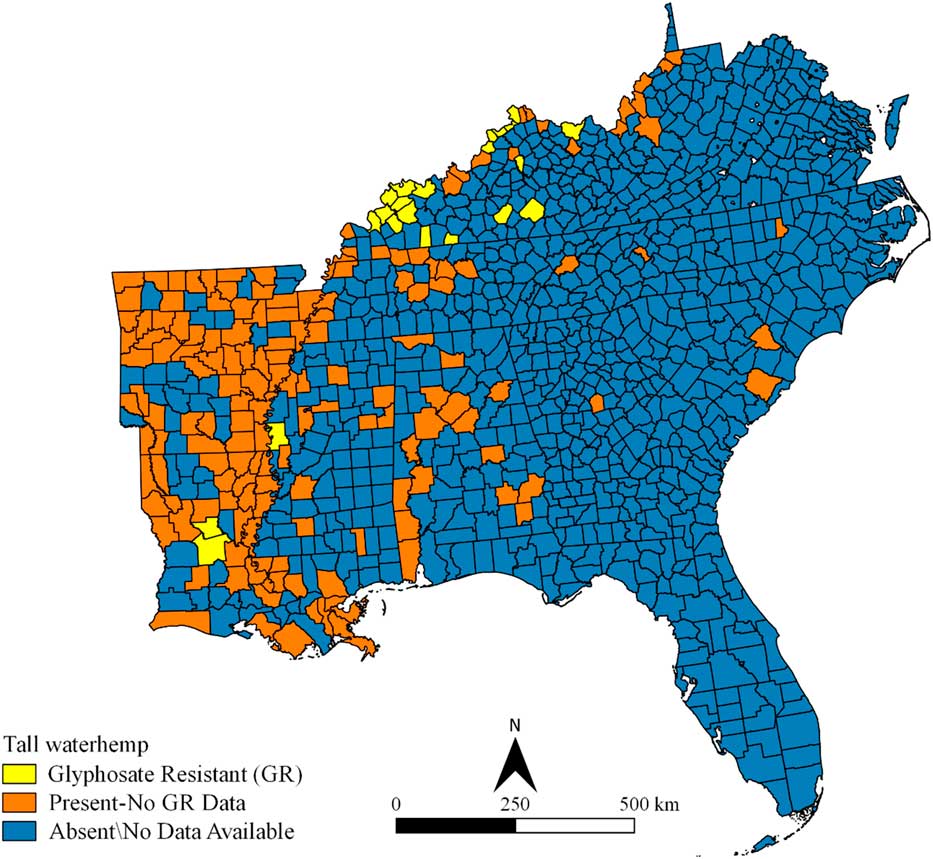
Figure 5 Tall waterhemp glyphosate-resistance status and distribution in the southeastern United States. Refer to Figure 1 for state names.
Figure 6 shows GR Palmer amaranth counties overlaid onto cultivated areas. It was obvious that the GR Palmer amaranth county distribution coincided with the cultivated areas. These results provide a good example of how data from different map layers can be integrated to qualitatively view agriculture and weed relations.
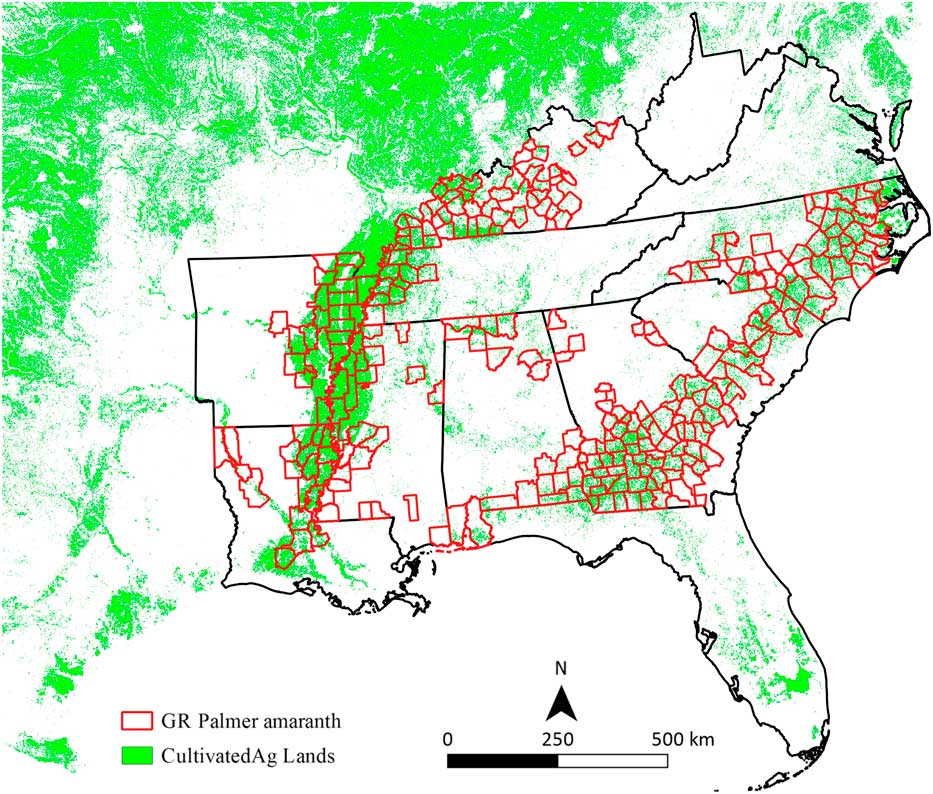
Figure 6 Glyphosate-resistant (GR) Palmer amaranth distribution in the southeastern United States in relation to cultivated agriculture lands. Refer to Figure 1 for state names.
Discussion
Free and open-source GIS software, coupled with freely available data provided by federal, state, and local government agencies and published literature, can be a powerful tool in helping establish distribution maps of pigweeds (Figures 3–6), supporting geographic information databases as decision support tools. To effectively use GIS software for weed survey and management, the user must decide which spatial resolution is appropriate for the survey: country, state, county, or individual-field level. The county level was chosen for this study (Figures 3–6). Fletcher (Reference Fletcher2009) also demonstrated the power of using freely available government data at the county level in GIS for citriculture.
In most cases, once a weed has been identified or labeled as resistant to herbicide, the whole county is put on alert. Henceforward, management programs are developed to control the weed for that county and surrounding areas. The overall results of this study concurred with others, in that GIS technology is a valuable tool for assessing and managing agricultural resources (Richardson et al. Reference Richardson, Wiegand, Anderson and Gerbermann1996; Boonyanuphap et al. Reference Boonyanuphap, Wattanachaiyingcharoen and Sakurai2004; Mandal and Sharma Reference Mandal and Sharma2006; Fletcher Reference Fletcher2009; Dille et al. Reference Dille, Vogel, Rider and Wolf2011; Fox and Pullar Reference Fox and Pullar2011; Gumz and Weller Reference Gumz and Weller2011; Clay Reference Clay2011; Clay and Shanahan Reference Clay and Shanahan2011; Reitsma and Clay Reference Reitsma and Clay2011). One benefit of this study was no cost associated with downloading and using the software. The user also has freedom to modify or cater the software to meet the needs of weed scientists and has the ability to freely distribute and collaborate on software development (Steiniger and Bocher Reference Steiniger and Bocher2009; Steiniger and Hay Reference Steiniger and Hay2009).
The GIS consist of five components: (1) software, (2) hardware, (3) methods and procedures, (4) people, and (5) data. For it to work effectively, all components must be in sync. The geographic database created in this study shows information available from web searches and the literature (Figures 3–6). Nevertheless, additional data may exist that has not been reported, demonstrating a breakdown in the people component of the GIS. With that said, entities that have data need to make it readily accessible to others. Additionally, information shared with the public should be collected by trained personnel or verified by someone with expertise in weed identification, especially if corrective actions are going to be implemented based on information retrieved from plant or weed databases. Mistakes lead to a waste of time, money, and labor, and can result in more harm than good when the wrong management practice is implemented.
Data employed in this study were in an electronic form, but they were not in a form readily distributed to a database table, which is a major component of GIS files used for querying databases. Therefore, it is suggested that analysts insert their data in an electronic and tabular form and then place it on the company or university website for download. If the database table consists of a state and county column, then the information can be easily transferred to another database using database join and transfer procedures.
Free and open-source GIS software is an alternative to commercial software to establish weed distribution maps. For this study, QGIS, a free and open-source software, was used to develop a geographic information database and pigweed distribution maps at the county level for the southeastern United States. The database has good potential as a decision support tool and for pinpointing surrounding counties that may be at risk from a weed invasion. The techniques and findings of the study should appeal to agriculturalists in the United States and abroad who are seeking inexpensive tools to design weed maps.
Acknowledgments
The authors thank Milton Gaston, Jr. for assistance in compiling the data. Mention of trade names or commercial products in this document is solely for the purpose of providing specific information and does not imply recommendation or endorsement by the USDA.


