


Introduction
Cover crops (CCs) provide many ecosystem benefits, including nematode and weed suppression, increased crop yields, and improved soil health and water quality (Price and Norsworthy Reference Price and Norsworthy2013). Multiple studies have reported increased weed control using CCs. Malik et al. (Reference Malik, Norsworthy, Culpepper, Riley and Bridges2008) reported that total weed density was reduced 35% and 50% without herbicides at 4 wk after planting by wild radish (Raphanus raphanistrum L.) CC in Blackville, SC, and cereal rye (Secale cereale L.) CC in Tifton, GA. In Missouri, winter annual weed emergence was reduced 23% to 72% by various CC species compared to the nontreated control (Cornelius and Bradley Reference Cornelius and Bradley2017). A study conducted by Baraibar et al. (Reference Baraibar, Hunter, Schipanski, Hamilton and Mortensen2018) in Pennsylvania found that CC mixtures (grasses, cereals, and brassicas) and grass monocultures provided better weed control than the brassicaceous and legume monocultures.
Cover crops can reduce weed emergence during the growing season by competing with weeds for nutrients, water, and light (Price and Norsworthy Reference Price and Norsworthy2013). Weed populations were reduced after CC termination during the following cash crop season. Weed reduction by CCs can be attributed to physical interference of CC residues affecting weed germination and release of allelopathic compounds from CC residues after soil incorporation (Malik et al. Reference Malik, Norsworthy, Culpepper, Riley and Bridges2008). Cover crop residues on the soil surface affect the light availability, soil moisture levels, and temperature, modifying the soil microenvironment and reducing weed seed germination (Creamer et al. Reference Creamer, Bennett, Stinner, Cardina and Regnier1996; Masiunas et al. Reference Masiunas, Weston and Weller1995). Presence of crop residues on the soil surface can increase water infiltration and reduce evaporation losses, resulting in saturated soil conditions that limit weed seed germination and growth (Teasdale Reference Teasdale1996). However, soil moisture conservation during a droughty season can also increase weed seed emergence (Teasdale and Mohler Reference Teasdale and Mohler1993). Teasdale and Mohler (Reference Teasdale and Mohler1993) found that transmittance of photosynthetic photon flux density through CC residue declined exponentially with time, and that transmittance through cereal rye residue was less than hairy vetch because of slower decomposition of cereal rye residue. Cover crop residue also reduces maximum soil temperature and daily soil temperature amplitudes (Teasdale and Mohler Reference Teasdale and Mohler1993).
Cover crops release allelochemicals through various processes, such as root exudation, volatilization, and leaching (Weir et al. Reference Weir, Park and Vivanco2004). Wild radish can produce an allelopathic response to prickly sida (Sida spinosa L.), pitted morningglory (Ipomoea lacunosa L.), and sicklepod (Senna obtusifolia L.) (Norsworthy Reference Norsworthy2003). Malik et al. (Reference Malik, Norsworthy, Culpepper, Riley and Bridges2008) identified 10 potential allelopathic glucosinolate compounds released by wild radish: glucoiberin, progoitrin, glucoraphanin, glucoraphenin, glucosinalbin, gluconapin, glucotropaeolin, glucoerucin, glucobrassicin, and gluconasturtiin. Many researchers have reported that residues from winter annual CCs did not provide full-season weed control but only early-season weed control that increased with increasing residue biomass (Hodgdon et al. Reference Hodgdon, Warren, Smith and Sideman2016; Olsen et al., Reference Olsen, Kristensen, Weiner and Griepentrog2005; Teasdale Reference Teasdale1996). Cover crop residues adversely affect the small-seeded annual weed species that have a high light requirement for germination (Teasdale Reference Teasdale1996). In addition, the C:N ratio of CC biomass also determines the degradation and decomposition of CCs, which ultimately affect weed suppression. Cereal grains usually have a higher C:N ratio than legume CCs, which results in slower degradation and higher plant residue persistence of cereal grains CCs as compared to legume CCs (Bowman et al. Reference Bowman, Shirley and Cramer2000). The early-season weed control provided by CCs may reduce the application rates of herbicides needed for effective control. However, Cornelius and Bradley (Reference Cornelius and Bradley2017) concluded that CCs were unable to provide the same level of winter and summer annual weed suppression that was provided by soil-applied residual herbicides.
Multiple studies have reported weed suppression with cereal rye or a mixture of cereal rye with legumes such as hairy vetch (Hayden et al. Reference Hayden, Brainard, Henshaw and Ngouajio2012; Teasdale and Mohler Reference Teasdale and Mohler1993; Teasdale et al. Reference Teasdale, Brandsaeter, Calegari, Neto, Upadhyaya, Blackshaw, Upadhyaya and Blackshaw2007). In Michigan, hairy vetch and cereal rye reduced total weed biomass by 71% to 91% and 95% to 98%, respectively, when compared to a no-CC control (Hayden et al. Reference Hayden, Brainard, Henshaw and Ngouajio2012). Hairy vetch and hairy vetch + cereal rye reduced 73% to 99% of weed biomass in spring compared to the weedy-fallow control treatment in New Hampshire (Hodgdon et al. Reference Hodgdon, Warren, Smith and Sideman2016). All of these studies were small-plot research experiments. There is limited information available on the effects of CCs on weed suppression at the field and large-watershed scales. Weed communities at field or watershed scales are influenced by many variables, such as cropping systems, soil fertility, tillage practices, topographic positions, and water availability (Albrecht and Pilgram Reference Albrecht and Pilgram1997; Forster Reference Forster2005; Kelton et al. Reference Kelton, Price, van Santen, Balkcom, Arriaga and Shaw2011). Kelton et al. (Reference Kelton, Price, van Santen, Balkcom, Arriaga and Shaw2011) reported that weed species richness was influenced by topographic position in conventional tillage and no-tillage systems, with higher weed species richness in drainage ways and lower on the side slope. Similarly, Forster (Reference Forster2005) reported that weed seedlings were more numerous on lower topographic positions, with 36 plants m–2, whereas mid- and upper topographic positions had 9 to 16 plants m–2. Weed densities could be expected to be greater on lower topographic positions as a result of relatively greater water availability on these positions compared to side slopes (Forster Reference Forster2005; Manning et al, Reference Manning, Fuller, Flaten and Eilers2001). Soil water and nutrient dynamics are affected by the topographic positions in a watershed, which results in differences in CC biomass, crop yields, soil properties, and water quality (Singh Reference Singh2018; Singh et al. Reference Singh, Williard and Schoonover2016, Reference Singh, Schoonover and Williard2018a, Reference Singh, Schoonover, Williard, Kaur and Crim2018b, Reference Singh, Williard, Schoonover, Nelson and Kaur2019). It is possible that weed suppression by CCs could vary by topographic positions within a watershed. Therefore, the objective of this study was to evaluate the effects of CCs and topographic positions on weed suppression at a watershed scale.
Materials and Methods
Site Description and Experimental Layout
The research site was established in 2015 at the Southern Illinois University Research farm (37.709°N, 89.268°W) on a Hosmer silt loam (Fine-silty, mixed, active, mesic Oxyaquic Fragiudalfs) and Bonnie silt loam (Fine-silty, mixed, active, acid, mesic Typic Fluvaquents). The 20-yr average annual rainfall was 1,067 mm, and the research site was classified as hot-summer humid continental climate according to the Köppen-Geiger climate classification (Peel et al. Reference Peel, Finlayson and McMahon2007).
Twelve watersheds were delineated using a hydrology toolbox in ArcMap (Version 10.4.1, ESRI Redlands, CA, USA). A digital elevation model having a raster resolution of 1.219 by 1.219 m obtained from the Illinois Geospatial Clearinghouse was used for identifying the watershed areas (Illinois Geospatial Data Clearinghouse 2019). The experimental layout consisted of 6 watersheds selected randomly from a set of 12 watersheds (Figure 1). Each watershed in a replication had a similar area and was randomly assigned to a CC or no-CC treatment. Areas of watersheds ranged between 1.2 and 4.8 ha. Watersheds were further divided into three topographic positions (shoulder, backslope, and footslope) using a topographic position index model in ArcMap (Evans et al. Reference Evans, Williard and Schoonover2016). Details of topographic-position classifications are given in Singh et al. (Reference Singh, Williard, Schoonover, Nelson and Kaur2019). At each topographic position, three sampling locations were randomly selected for collecting CC and weed biomass. There were 18 sampling locations in replication of watersheds (2 watersheds in a replication × 3 topographic positions per watershed × 3 sampling locations per topographic position).
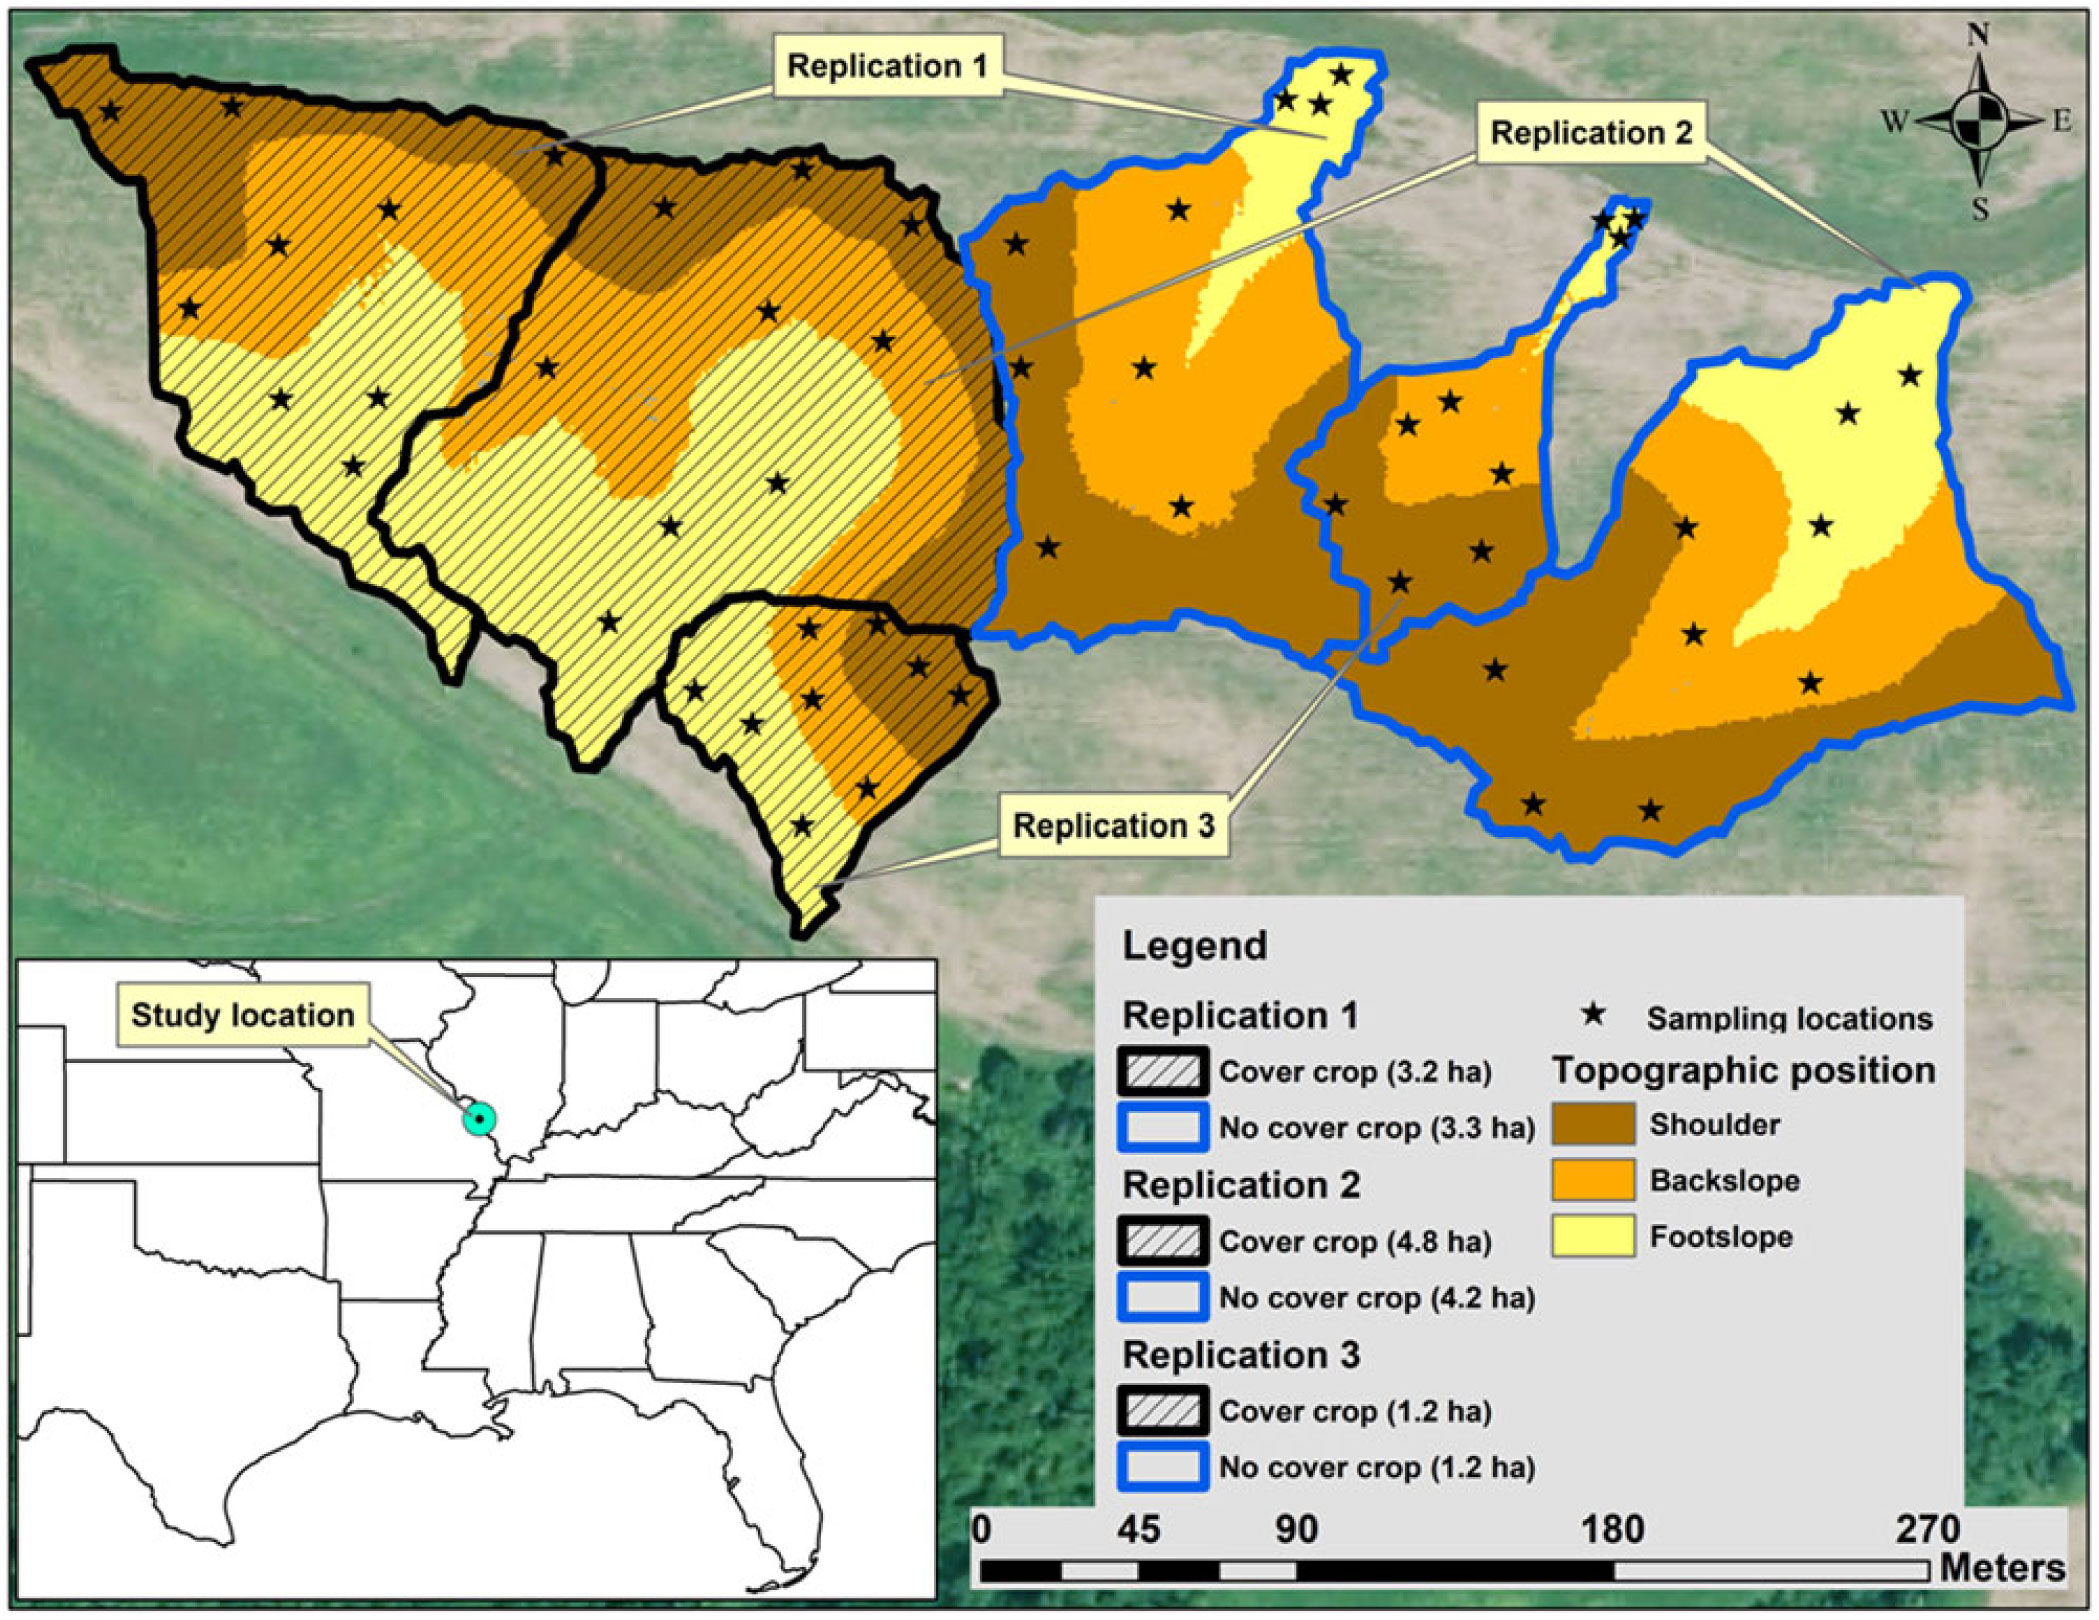
Figure 1. Research site near Carbondale, IL, showing watersheds planted with (hatched areas) and without cover crops at three landscape positions.
Crop Management
The watersheds had been under no-tillage treatment since 2006 with a 2-yr crop rotation of corn–soybean. After corn harvest in the fall of 2015 and 2017, the watersheds assigned to CC treatments were drill-seeded using a John Deere Great Plains Seed Drill (Moline, IL) with cereal rye at 88 kg ha–1 in 19-cm row spacing, whereas after soybean harvest in fall 2016 the CC treatment watersheds were drill-seeded with hairy vetch at 28 kg ha–1 (Table 1). The crop rotation for the CC-treatment watersheds was corn–cereal rye–soybean–hairy vetch, and for the no-CC watersheds was corn–winter fallow–soybean–winter fallow. Average N fertilizer application was 222 kg N ha–1 as anhydrous ammonia, which was applied on April 30, 2015 and May 3, 2017 before termination of CC or annual weeds in the watersheds, which was prior to planting corn. Diammonium phosphate (34 kg P ha–1) fertilizer was also applied prior to termination of cover crops (Table 1).
Table 1. Dates of field operations and data collection.

a Cover crop prior to planting corn was terminated using glyphosate at 1.27 kg a.e. ha–1 plus 2,4-D at 4.21 kg a.e. ha–1 plus diammonium sulfate at 2% v/v. Cover crop prior to planting soybean was terminated using glyphosate at 0.95 kg a.e. ha–1 plus saflufenacil at 0.04 kg a.i. ha–1 plus methylated seed oil at 1% v/v plus diammonium sulfate at 1.5% v/v.
Data Collection and Analysis
Aboveground CC biomass in the CC-treatment watersheds and winter annual weed biomass in the no-CC treatment watersheds was collected at each sampling location using a 0.4-m2 polyvinyl chloride quadrat before termination of the CC (Table 1). In watersheds with CCs, winter annual weeds were separated from the collected CC biomass. Winter annual weeds were identified at each topographic position as common chickweed [Stellaria media (L.) Vill.], butterweed [Packera glabella (Poir.) C. Jeffrey], and henbit (Lamium amplexicaule L.), which were present at all three topographic positions, whereas shepherd’s purse [Capsella bursa-pastoris (L.) Medik.] was present only at the footslope topographic position (visual observations). Because of the cost of running a watershed-scale (large-field scale) experiment, the weed biomass for individual weed species was not analyzed separately. All of the aboveground CC and weed biomass was combined and dried at 60 C until constant weight. Biomass values were recorded and scaled to a kg ha–1 basis. Dried weed biomass samples were ground in a Wiley mill (1-mm sieve) and then analyzed for total C and N on a C:N soil–plant analyzer (Flash 2000, organic elemental analyzer; Thermo Fisher Scientific, Waltham, MA). Percent N from the C:N analyzer was multiplied by the biomass to determine N uptake by the weeds.
Statistical and Spatial Analysis
Regression analysis between CC and weed biomass combined over 3 yr (2016 to 2018) and three topographic positions from the watersheds planted with CCs was conducted using the Reg procedure in SAS (SAS Institute 2014). To study the effect of weed suppression at individual topographic positions, the CC and weed biomass was split on the basis of topographic positions and was analyzed with the Reg procedure. Each weed biomass sampling point in watersheds with and without CCs was georeferenced, allowing for the spatial analysis of the biomass. ArcMap (Version 10.4.1; ESRI Redlands, CA) software was used to develop kriging interpolation of weed biomass in the watersheds. The model used in kriging interpolation was spherical, which was set to 12 lags. A trend analysis was conducted in ArcMap before spatial interpolation for the predicted variable (i.e., biomass of weeds). Experimental variograms were computed and modeled to describe the spatial variation. If the shape of the experimental variogram suggested that a regional trend was present, then a low-order polynomial was fitted on the coordinates of the predicted variable.
The Glimmix procedure in SAS (SAS Institute 2014) was used to analyze weed biomass data combined over 3 yr as well as separated based on year of collection (2016, 2017, and 2018). The dependent variables were biomass, N uptake, C, N, and C:N ratio of the weed biomass, and independent variables were treatments, topography, year, and their interaction when 3 yr were combined. The three-way interaction between treatments, topography, and year was not significant; therefore, data were split between years and analyzed for treatment, topography, and their interaction. The watershed treatment replications and sampling location within a topographic position were treated as a random factor. T-grouping of least-square means was used for a comparison of means at P < 0.1. Probability values associated with dependent variables are reported in Tables 2, 3, and 4.
Table 2. Probability (P) values and numerator degrees of freedom (df) associated with the sources of variation in the statistical analysis of weed biomass moisture (g kg–1), biomass (kg ha–1), N uptake (kg ha–1), aboveground biomass C (g kg–1), aboveground biomass N (g kg–1), and C:N ratio of three-way interaction of treatment, topography, and year (P < 0.1).

Table 3. Comparison of mean biomass and N uptake of the weed biomass collected from three topographic positions in the watersheds planted with and without cover crops in spring 2016, 2017, 2018, and all 3 yr combined (2016–2018).a, b

a Abbreviations: CC, cover crop; No CC, no cover crop.
b Within a column, a given factor or a combination of factors having the same letter are not significantly different at P < 0.1.
c P value from type III tests of fixed effects.
Table 4. Comparison of mean biomass and N uptake of the weed biomass collected from three topographic positions in the watersheds planted with and without cover crops in spring 2016, 2017, 2018, and all 3 yr combined (2016–2018).a, b

a Abbreviations: CC, cover crop; No CC, no cover crop.
b Within a column, a given factor or a combination of factors having the same letter are not significantly different at P < 0.1.
c P value from type III tests of fixed effects.
Results and Discussion
Cover Crop Biomass and Weed Suppression
Overall regression analysis R2 between CC and weed biomass combined over the topographic positions and biomass collection during 3 yr was 0.47 (P < 0.0001, Figure 2). The R2 values for regression analysis between weed biomass and CC biomass at the shoulder, backslope, and footslope were 0.40, 0.48, and 0.50, respectively (Figure 3). Weed biomass showed a logarithmic decrease with an increase in CC biomass. Cover crop biomass at the shoulder landscape position ranged between 223 and 7,079 kg ha–1, whereas weed biomass ranged between 56 and 1,370 kg ha–1. At the backslope topographic position, CC biomass ranged between 67 and 7,045 kg ha–1 and weed biomass ranged between 39 and 1,756 kg ha–1. At the footslope topographic position, CC biomass was less than the shoulder and backslope positions and ranged between 59 and 4,416 kg ha–1, whereas weed biomass was generally higher and ranged between 39 and 2,721 kg ha–1. The hatched area in Figure 2 indicates that a CC biomass threshold value of >1,450 kg ha–1 was generally needed to reduce weed biomass to <940 kg ha–1 at the watershed scale. Similar to our results, Hodgdon et al. (Reference Hodgdon, Warren, Smith and Sideman2016) reported a regression relation of 0.59 between spring CC and weed biomass. Biomass produced by CCs in the spring can be an important factor explaining the abundance of weeds present in the spring. Spatial interpolation of weed biomass collected in all 3 yr from the watersheds is given in Figure 4. The green color in the figure indicates lower weed biomass, and watersheds planted with CCs had lower weed biomass than the watersheds without CC. The green color of the spatial interpolation maps in Figure 4 indicates lower weed biomass, whereas red indicates higher weed biomass. In 2016, when CCs were not well established, the weed biomass was higher in CC watersheds, possibly as a result of soil disturbance with the drill establishment of the CC. However, CCs were well established in 2017 and 2018, and the weed biomass was low in the watersheds with CCs compared those with no CCs (Figure 4). Multiple studies have shown a reduction in weed biomass with the use of CCs (Hodgdon et al. Reference Hodgdon, Warren, Smith and Sideman2016; Olsen et al., Reference Olsen, Kristensen, Weiner and Griepentrog2005; Teasdale Reference Teasdale1996; Teasdale et al. Reference Teasdale, Brandsaeter, Calegari, Neto, Upadhyaya, Blackshaw, Upadhyaya and Blackshaw2007). Mohler and Teasdale (Reference Mohler and Teasdale1993) found that increasing CC residue decreased weed biomass by reducing the number of weed seedlings and delaying weed seed emergence.
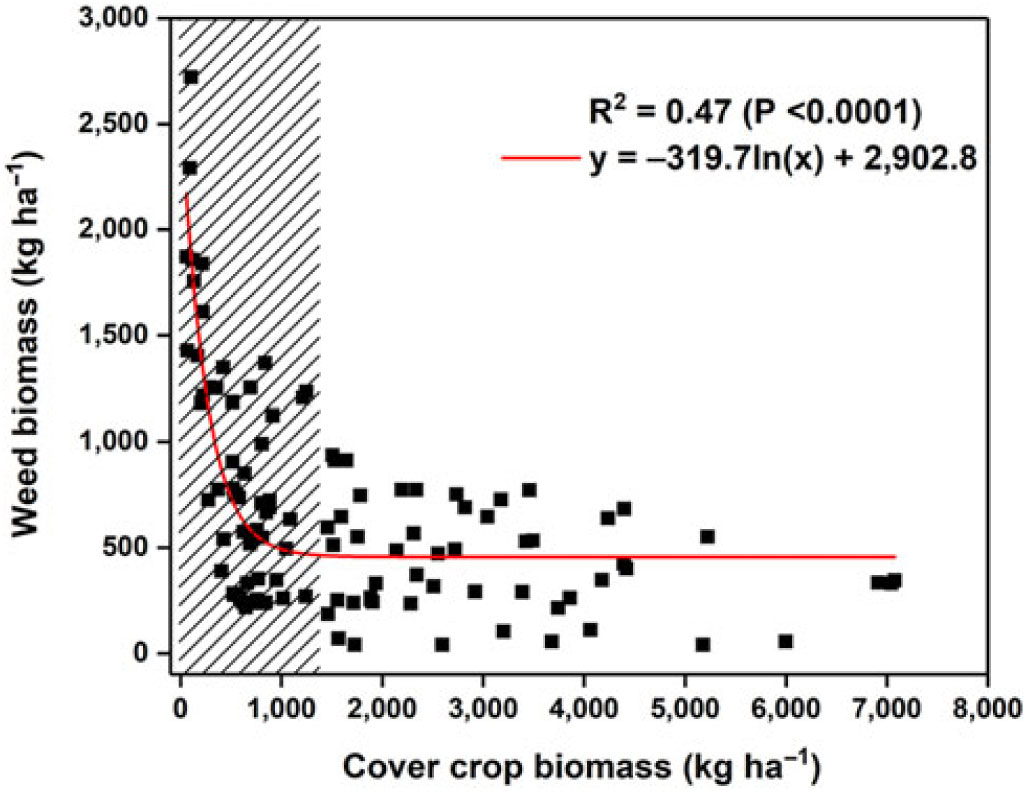
Figure 2. Regression of weed biomass and cover crop (CC) biomass in the watersheds planted with CCs for all topographic positions combined over 3 yr. The hatched area indicates the CC biomass threshold value of >1,450 kg ha–1 that was needed to reduce weed biomass to <940 kg ha–1 at the watershed scale.

Figure 3. Regression between weed biomass and cover crop (CC) biomass in the watersheds planted with CCs and split on basis of topographic positions. Data were combined over years (2016–2018).

Figure 4. Kriging interpolation of weed biomass in watersheds with (green outline) and without (black outline) cover crops.
Weed Biomass
Biomass of weeds in all years was significantly affected by the interaction between CC treatment and topographic positions (Table 3). In 2016, the weed biomass values in the CC watershed were 56% (373 kg ha–1) and 63% (403 kg ha–1) higher at footslope position compared to shoulder and backslope positions, respectively. In the no-CC watershed, weed biomass values in 2016 at the footslope position were 48% (624 kg ha–1) and 163% (1,196 kg ha–1) greater than at the shoulder and backslope positions, respectively. Weed biomass was not different between the shoulder and footslope positions for the CC treatment in 2016. However, weed biomass was 78% (572 kg ha–1) greater at the shoulder compared to the backslope position in the no-CC treatment watershed in 2016. Inclusion of CCs reduced weed biomass at the shoulder and footslope positions compared to no CC by 49% and 46% in 2016, 72% and 62% in 2017, and 59% and 85% in 2018, respectively. No significant differences were found for weed biomass between the CC and no-CC watersheds at the backslope position in 2016 and 2017. However, weed biomass in 2018 was 52% (330 kg ha–1) lower at the backslope position in the CC watershed than in the no-CC watershed. When data were combined over 3 yr, the presence of CCs reduced weed biomass at shoulder, backslope, and footslope positions 60% (775 kg ha–1), 37% (266 kg ha–1), and 61% (978 kg ha–1) compared to no CC, respectively. Reduction in weed biomass in a CC watershed compared to no CC was potentially due to higher biomass production by CCs and competition with the weeds for space, light, nutrients, and water (Colquhoun Reference Colquhoun2006; Blanco-Canqui et al. Reference Blanco-Canqui, Shaver, Lindquist, Shapiro, Elmore, Francis and Hergert2015).
The CC used in 2016 and 2018 was cereal rye, whereas the CC was hairy vetch in 2017. Previous studies have reported that grasses suppressed weeds more effectively than legumes because of their fast-growing characteristics, rapid emergence and growth, soil coverage, and persistence for a longer period on the soil surface after termination (Baraibar et al. Reference Baraibar, Hunter, Schipanski, Hamilton and Mortensen2018). Weather, soil water availability, and planting date can also have a strong influence on interannual variability in biomass of CCs and weeds (Baraibar et al. Reference Baraibar, Hunter, Schipanski, Hamilton and Mortensen2018; Dorn et al. Reference Dorn, Jossi and Van der Heijden2015). Cereal rye also produces allelopathic compounds that reduce weed growth or interferes with microbial communities that benefit weed species (Reberg-Horton et al. Reference Reberg-Horton, Burton, Danehower, Ma, Monks, Murphy, Ranells, Williamson and Creamer2005; Weston Reference Weston1996). Cereal rye exudes phytotoxic allelopathic benzoxazinone compounds, specifically dihydroxy-1,4(2H)-benzoxazin-3-one and its breakdown product 2(3H)-benzoxazolinone (Barnes et al. Reference Barnes, Putnam, Burke and Aasen1987). In Illinois, use of cereal rye and hairy vetch CCs reduced waterhemp (Amaranthus tuberculatus Moq.) populations by 62% to 100% compared to no-CC treatments in 2 out of 3 yr (Davis Reference Davis2010). Cereal rye and mixture of cereal rye and hairy vetch reduced winter annual weed density 68% to 72% compared to other CCs used in the study including winter pea (Pisum sativum L.), hairy vetch, crimson clover (Trifolium incarnatum L.), wild radish, oat (Avena sativa L.), annual ryegrass (Lolium multiflorum Guss. ex Arcang.), and wheat (Triticum aestivum L.) (Cornelius and Bradley Reference Cornelius and Bradley2017). However, faster decomposition of hairy vetch residues can result in greater weed emergence and poor weed control later in the season (Mohler and Teasdale Reference Mohler and Teasdale1993).
Weed biomass and N uptake were affected by topography. Topography influences plant biomass production by affecting upslope and downslope soil properties such as organic matter, soil nutrients, and water availability as a result of both vertical and horizontal redistribution of water (Kravchenko and Bullock Reference Kravchenko and Bullock2000; McVay et al. Reference McVay, Budde, Fabrizzi, Mikha, Rice, Schlegel, Peterson, Sweeney and Thompson2006). Spatial variability caused by topography in a watershed can affect the growth of CCs and their performance in suppressing weeds. In general, the shoulder position had better drainage compared to the footslope position as a result of efficient surface water runoff and lower chances of soil waterlogging, which resulted in better growing conditions for weeds and CCs at the shoulder position. Footslope positions may experience soil waterlogging conditions because of excessive precipitation or water movement from upper topographic positions. Soil waterlogging at the footslope position creates anaerobic conditions in the soil that adversely affect plant growth. However, comparatively higher soil moisture at the footslope position than other topographic positions might result in better CC and weed growth in years with low precipitation, especially during establishment. Weed densities were reported to be higher on lower topographic positions because of relatively higher water availability on these positions compared to side slopes (Forster Reference Forster2005; Manning et al, Reference Manning, Fuller, Flaten and Eilers2001). In drought years, the shoulder topographic position suffers higher moisture loss, resulting in lower plant biomass production at that position. Low weed biomass production and N uptake at the backslope position might have resulted from lower nutrient content and fertility, as this position undergoes high degradation due to soil erosion (Singh et al. Reference Singh, Williard, Schoonover, Nelson and Kaur2019).
N Uptake
No significant differences were found for N uptake by weeds due to topographic positions in the CC treatment watershed in 2016 and 2018 (Table 3). In 2017, N uptake by weeds was 150% (6 kg ha–1) greater at the footslope position than the shoulder position in the CC watershed. The N uptake by weeds was greater in the no-CC watershed than the CC watershed at all topographic positions from 2016 to 2018, except the backslope position in 2016. Weed N uptakes were 82% (9 kg ha–1) and 100% (11 kg ha–1) greater at the shoulder and footslope positions than at the backslope position in the no-CC watershed, respectively, when data were averaged over the 3 yr. When data were combined over 3 yr, N uptakes by weeds were 233% (14 kg ha–1), 83% (5 kg ha–1), and 175% (14 kg ha–1) greater at the shoulder, backslope, and footslope position, respectively, in the no-CC watershed compared to the CC watershed. Nitrogen uptake is a product of N content in the weed biomass and total biomass produced. Therefore, greater biomass of weeds in the no-CC treatments resulted in greater N uptake compared to the CC treatments. In addition, CCs competed with weeds for N content in soil for uptake in the CC treatment, which consequently reduced N availability in soil for uptake by weeds. Therefore, the N content of weed biomass was lower in the CC treatment than in no-CC treatment. This indicates that winter annual weeds can provide ground cover and N immobilization.
Carbon, Nitrogen, and C:N Ratio of Weed Biomass
The C content in the weed biomass was not affected by the treatment, topography, and their interaction in 2016 and 2018 (Table 4). The presence of CCs in the watershed reduced kg–1 C content in the weed biomass 8 to 22 g compared to no-CC watershed in 2017 and when data were averaged over 3 yr. The two-way interaction between treatment and year for biomass C was significant (P = 0.0742, Table 2), and the no-CC watershed in 2017 had 400 g kg–1 C, which was 16 to 22 g ka–1 higher than all other treatment-by-year interactions.
The N content in weed dry biomass was significantly affected by the interaction of treatment and topography in all 3 yr of the study. In the CC watershed, N content in weed dry biomass was 1 g kg–1 greater at the backslope position than the shoulder and footslope positions in 2016. However, the N content in weed biomass was 1 g kg–1 greater at the shoulder position than backslope and footslope positions in the no-CC watershed in 2016. In 2017, the shoulder had at least 3 g kg–1 lower N content in weed biomass than the backslope and footslope positions in the CC watershed, whereas the no-CC watershed shoulder and backslope positions had at least 3 g kg–1 greater N content in weed dry biomass than the footslope position. In 2018, the shoulder topographic position had 2 g kg–1 greater N concentration than backslope and footslope CC watersheds, whereas footslope position of the no-CC watershed had 3 g kg–1 lower N concentration than the backslope position. The N concentration in weed dry biomass was greater in the no-CC watershed than the CC watershed at all topographic positions in 2016, shoulder position in 2017 and 2018, and shoulder and backslope positions when data were averaged over all 3 yr.
The C:N ratio was 4 and 7 units greater at the shoulder position than the backslope position in the CC watershed in 2016 and 2017, respectively. In the no-CC watershed, the C:N ratio of weed biomass was 2 units lower at the shoulder position than the backslope and footslope positions in 2016. However, the C:N ratio at the footslope position in the no-CC watershed was 6 to 7 units greater than the shoulder and backslope positions in 2017. The C:N ratio of weed dry biomass was greater in the CC watershed than in the no-CC watershed at the shoulder and footslope positions in 2016 by 5 to 8 units as well as at the shoulder position in 2017 by 6 units. In 2018, shoulder and backslope positions for the CC treatment watershed had at least 5 units higher C:N ratio than shoulder and backslope positions of no-CC watersheds. When data were averaged over all years, the C:N ratio of weed biomass was 8 and 3 units greater in the CC watershed compared to the no-CC watershed at the shoulder and backslope positions, respectively. The higher C:N ratio in the CC treatments compared to the no-CC treatment was due to higher C and lower N content in the CC treatment. This indicated that competition between weeds and CCs resulted in less N available for weeds. Additionally, it is also possible that CC would have immobilized most of the available N in soil into their biomass (Singh et al. Reference Singh, Williard, Schoonover, Nelson and Kaur2019). Higher C:N ratio of the CCs can affect the availability of immobilized N to the cash crop, which can affect crop yields (Tonitto et al. Reference Tonitto, David and Drinkwater2006). Therefore, the CC or CC mixture that has a lower C:N ratio and greater weed suppression should be identified.
In our study, CCs reduced biomass of weeds from 37% to 61% compared to no-CC treatment when combined over the years. The C:N ratio of weed biomass in CC treatment watersheds was higher compared to watersheds without CCs. Biomass produced by CCs in the spring at different topographic positions can be an important factor explaining the abundance of weeds present in the spring. From a weed management point of view, growers can expect higher weed emergence on the footslope positions where CC residue is limited. Higher weed biomass could decrease the availability of nutrients and water for the subsequent cash crop in the years where soil water would be a limiting factor. Therefore, the role of CCs in controlling weed densities on topographically variable landscape should be considered in an integrated weed management strategy. Additionally, precision management systems should consider variations created by the topographic positions and their impact on weed biomass. Pre-plant, PRE, and POST herbicide application should be planned based on relative weed densities considering the higher potential of weed to germinate on the shoulder and footslope positions. Herbicide application rates should be adjusted according to the cropping systems and topographic positions through including weed density spatial variability maps. Whereas increasing CC biomass can decrease the weed biomass, increased CC biomass can also generate management issues for cash crops; that is, a high C:N ratio of CCs can immobilize N, high CC residue reduces soil temperature and affects cash crop germination and yields, and high CC biomass during dry springs can reduce soil moisture and can host overwintering insects and pests. The success of CCs in weed management will depend on finding a balance between net positive and negative effects of CCs. Therefore, variables like minimum-threshold CC biomass, topography, soil moisture conditions, soil fertility, and weed populations should be considered in developing decision tools or models for growers that they can use for making decisions on when and how to terminate CCs so that the benefits of CCs can be maximized.
Acknowledgments
We would like to acknowledge Randy Lange, Southern Illinois University farm workers/staff, and all the undergraduate workers who provided the essential assistance needed for this project. The funding for this project was provided by Illinois Nutrient Research and Education Council, Award No. 2017-11-002, McIntire-Stennis Cooperative Forest Research Program (USDA-NIFA), and the Agronomy Science Foundation. The authors declare no conflicts of interest.


