Introduction
Waterhemp is a small-seeded, dioecious, summer annual broadleaf species native to the midwestern United States (Sauer Reference Sauer1955). This competitive weed species reduced soybean [Glycine max (L.) Merr.] seed yield more than 40% when not controlled for 10 wk (Hager et al. Reference Hager, Wax, Stoller and Bollero2002) and decreased corn yield 74% with season-long interference (Steckel and Sprague Reference Steckel and Sprague2004). Individual female waterhemp plants can produce in excess of one million seeds (Hartzler et al. Reference Hartzler, Battles and Nordby2004), which can remain dormant in the soil for years (Burnside et al. Reference Burnside, Wilson, Weisberg and Hubbard1996; Hartzler et al. Reference Hartzler, Buhler and Stoltenberg1999).
Waterhemp populations at different locations have evolved resistances to herbicides from six site-of-action (SOA) groups, including inhibitors of acetolactate synthase (ALS) (Guo et al. Reference Guo, Riggins, Hausman, Hager, Riechers, Davis and Tranel2015), photosystem II (PSII) (Patzoldt et al. Reference Patzoldt, Dixon and Tranel2003), protoporphyrinogen oxidase (PPO) (Shoup et al. Reference Shoup, Al-Khatib and Peterson2003), 4-hydroxyphenylpyruvate dioxygenase (HPPD) (Hausman et al. Reference Hausman, Singh, Tranel, Riechers, Kaundun, Polge, Thomas and Hager2011), 5-enolpyruvylshikimate-3-phosphate synthase (EPSPS) (Zelaya and Owen Reference Zelaya and Owen2005), and synthetic auxins (Bernards et al. Reference Bernards, Crespo, Kruger, Gaussoin and Tranel2012). A survey of 59 Illinois waterhemp populations indicated that 90% contained resistance to ALS inhibitors and 25% were resistant to herbicides from multiple SOA groups (Patzoldt et al. Reference Patzoldt, Tranel and Hager2002).
Growers generally control an herbicide-resistant population by applying herbicides with alternative SOAs. This strategy, however, has the potential to select for the evolution of plants with multiple-herbicide resistances. Previously, a waterhemp population resistant to EPSPS-, PSII-, PPO-, and ALS-inhibiting herbicides was reported (Bell et al. Reference Bell, Hager and Tranel2013), and more recently Shergill et al. (Reference Shergill, Barlow, Bish and Bradley2018) confirmed resistance to herbicides from six site-of-action groups in a Missouri waterhemp population. Populations resistant to multiple-herbicide SOAs often have limited chemical control options (Bell et al. Reference Bell, Tranel and Hager2009; Patzoldt et al. Reference Patzoldt, Tranel and Hager2005). The increase in herbicide-resistant waterhemp populations has contributed to an increased presence of this species in Illinois agronomic fields during the last two decades (Hager et al. Reference Hager, Wax, Simmons and Stoller1997).
Several strategies have been proposed to reduce the likelihood of evolving multiple herbicide–resistant populations. Use of integrated weed management systems, including the use of dissimilar soil-residual herbicides along with foliar-applied herbicides, is essential for waterhemp control (Hager et al. Reference Hager, Wax, Simmons and Stoller1997). Recent research revealed that combining multiple, effective herbicide SOAs in mixtures significantly reduced the selection for glyphosate-resistant waterhemp compared to annual herbicide rotation (Evans et al. Reference Evans, Tranel, Hager, Schutte, Wu, Chatham and Davis2016).
Resistance to 2,4-D or dicamba in waterhemp currently is relatively rare (Heap Reference Heap2018), but commercialization of soybean and cotton (Gossypium hirsutum L.) varieties resistant to these synthetic auxin herbicides probably will increase their use and concomitant selection for resistance. Bernards et al. (Reference Bernards, Crespo, Kruger, Gaussoin and Tranel2012) reported the first occurrence of 2,4-D resistance in a waterhemp population discovered in a warm-season grass production field that had received annual applications of 2,4-D since 1996. Recently, a Missouri waterhemp population with 3-fold resistance to 2,4-D was identified in a field dedicated to continuous soybean production and a history of 2,4-D use prior to soybean planting (Shergill et al. Reference Shergill, Barlow, Bish and Bradley2018). Multiple resistance in waterhemp, including resistance to synthetic auxins and other herbicides that control waterhemp, would reduce the number of effective herbicide combinations.
We present here the characterization of an Illinois waterhemp population exhibiting a novel, five-way combination of herbicide SOA resistances: ALS, HPPD, PPO, and PSII inhibitors, and the synthetic auxin 2,4-D. Our objectives were to: (1) measure the efficacy of corn and soybean herbicides commonly used in Illinois on the study population under field conditions; (2) investigate whether combinations of HPPD and PSII inhibitors could increase control of the population; (3) determine if resistance to ALS, PPO, and PSII inhibitors was conferred by changes in the respective target site proteins; and (4) quantify the degree of resistance to the HPPD inhibitor mesotrione, the PSII inhibitor atrazine, and the synthetic auxin 2,4-D. To address these objectives, we performed a series of field and controlled-environment studies on plants from this population.
Materials and methods
Study population and site description
In 2012 a putative multiple herbicide–resistant waterhemp population (designated CHR) was discovered in a Champaign County, IL, field after it was not controlled by topramezone. The field had an annual rotation of non-GMO corn and glyphosate-resistant soybean. Herbicide use history records indicate that herbicides from various SOA groups (HPPD, PPO, ALS, and PSII inhibitors) had been used. The soil is a Flanagan silt loam (fine, smectitic, mesic Aquic Argiudolls) with a pH of 5.5, cation exchange capacity of 19.5 mEq 100 g−1 soil, and organic matter content of 4.8%.
Response of CHR to herbicides: field experiments
General methods
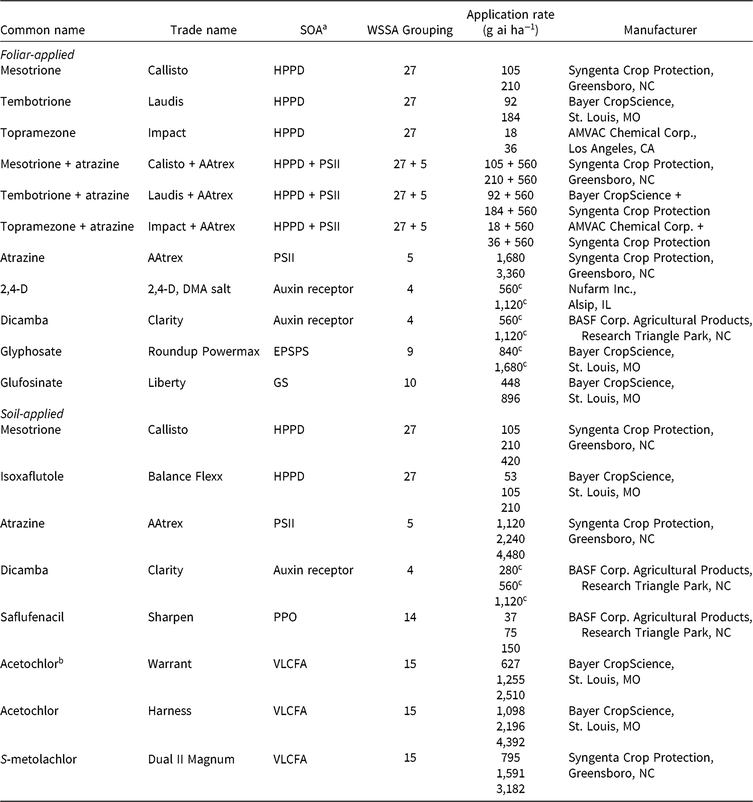
Field experiments were conducted in 2014 and 2015 at the location where CHR was initially identified. Preplant tillage was performed each spring to prepare the seedbed for planting and control any existing vegetation. Experiments were conducted in either corn (DKC62-77RIB) or soybean (Asgrow 3231 RR2), planted in rows spaced 76 cm apart. Planting dates in 2014 were May 7 for corn and May 26 for soybean, and in 2015 May 14 for corn and May 22 for soybean. Treatments were arranged in a randomized complete block design with three replications, and each replication was a 3- by 7.6-m plot that included four crop rows. Herbicides were applied using a pressurized CO2 backpack sprayer equipped with Teejet (TeeJet Technologies, P.O. Box 7900, Wheaton, IL) AI110025 nozzles for soil applications or AIXR110025 nozzles for foliar applications, spaced 51 cm apart on a 3-m boom calibrated to deliver 187 L ha−1 at 276 kPa. Crop planting preceded application of soil-applied herbicides on the same day. An assortment of herbicide active ingredients routinely applied in Illinois corn and soybean crops was selected for evaluation and included those to which CHR was hypothesized to be resistant or sensitive.
Foliar-applied herbicides
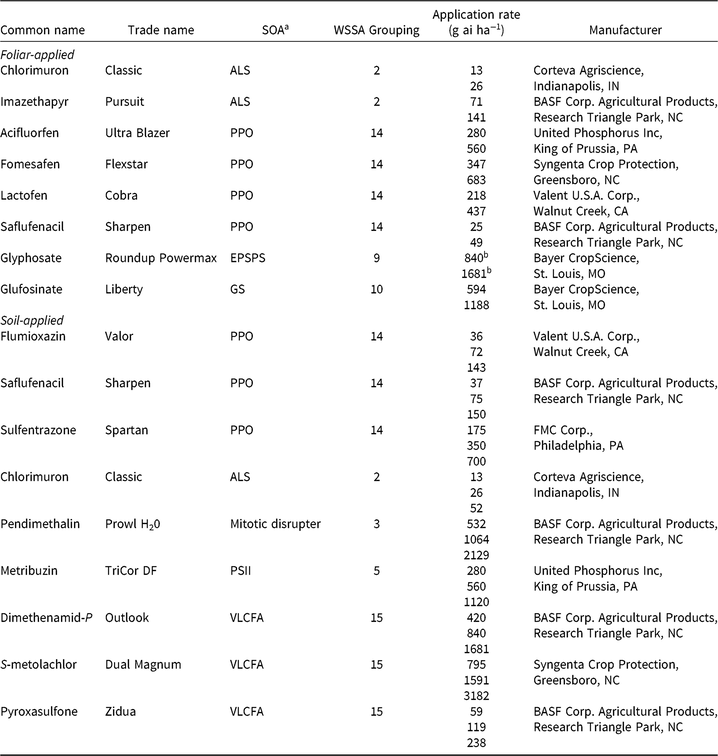
Various foliar-applied corn (Table 1) and soybean (Table 2) herbicide treatments were evaluated. Herbicides were applied when waterhemp plants were 8–10 cm tall at 1× and 2× label-recommended rates (Tables 3 and 4) with label-recommended spray additives. Corn growth stages at the times of application were V4 (2014) and V5 (2015), whereas soybean was at V3 each year.
Table 1. Herbicides evaluated, respective site-of-action (SOA) groups, application rates, and source information for corn (Zea mays) herbicide field experiments, Champaign Co., IL (2014–2015).
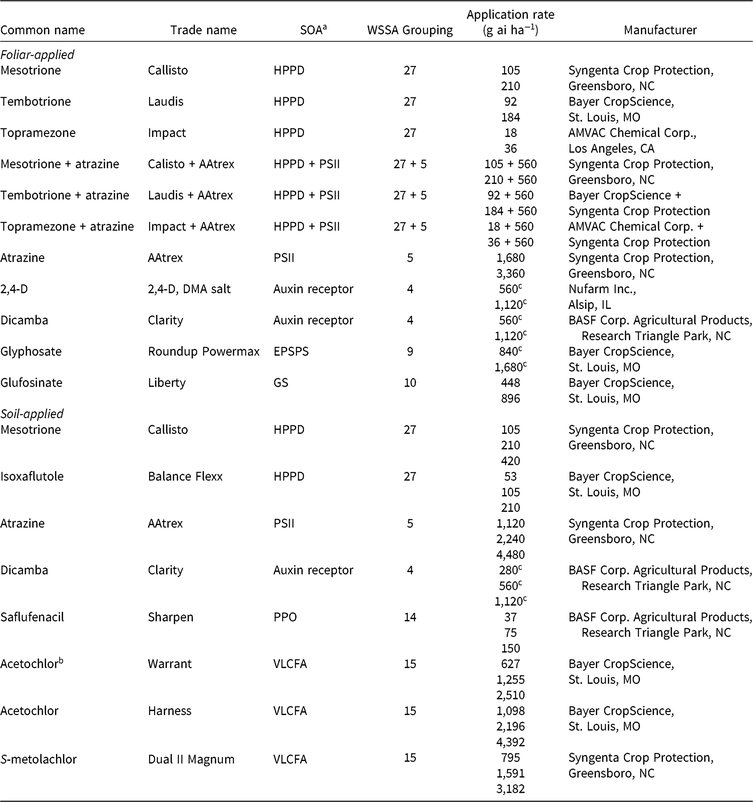
a Abbreviations for SOA: EPSPS, enolpyruvylshikimate-3-phosphate synthase; GS, glutamine synthetase; HPPD, 4-hydrophenylpyruvate dioxygenase; PPO, protoporphyrinogen oxidase; PSII, photosystem II; VLCFA, very-long-chain fatty acid.
b Encapsulated formulation.
c Acid equivalent (g ae ha−1).
Table 2. Herbicides evaluated, respective site-of-action (SOA) groups, application rates, and source information for soybean (Glycine max) herbicide field experiments, Champaign Co., IL (2014–2015).
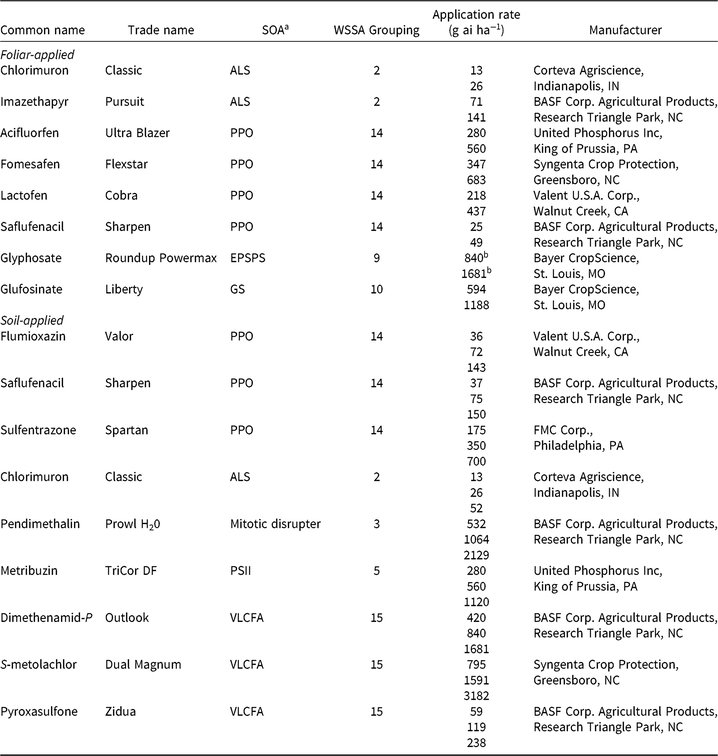
a Abbreviations for SOA: ALS, acetolactate synthase; EPSPS, enolpyruvylshikimate-3-phosphate synthase; GS, glutamine synthetase; HPPD, 4-hydrophenylpyruvate dioxygenase; PPO, protoporphyrinogen oxidase; PSII, photosystem II; VLCFA, very-long-chain fatty acid.
b Acid equivalent (g ae ha−1).
Prior to application, five uniformly sized waterhemp plants per plot (15 per treatment) were marked by placing a wooden garden stake near each plant. These plants were subsequently harvested 21 d after treatment (DAT) to evaluate each treatment’s effect on aboveground biomass. Additionally, 15 plants were harvested from nontreated plots the day of application to determine pretreatment aboveground biomass. Harvested plants were dried at 65 C for 7 d, and dry biomass was recorded. Herbicide efficacy was visibly evaluated and recorded 21 DAT using a scale of 0 (no control) to 100% (complete control). Ratings assessed plant injury, biomass, and stand reduction, and any recovery of treated plants.
Soil-applied herbicides
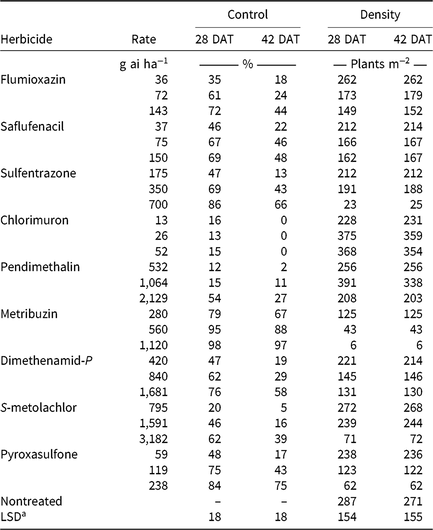
CHR responses to soil-applied corn (Table 6) and soybean (Table 7) herbicide treatments were evaluated. Herbicides were applied at 0.5, 1, and 2× label-recommended rates for soil type and organic matter content. Emerged waterhemp plants per square meter were counted 28 and 42 DAT from a consistent quadrat location in the middle of each plot. Visible estimates of weed control, presented as percent control compared with a nontreated plot, were also recorded 28 and 42 DAT.
Statistical analysis of field experiments
Linear mixed-effects models, with percent control, plant biomass, or plant density as the response variable and herbicide treatment as the independent variable, were used to quantify treatment effectiveness. Herbicide treatment was considered a fixed effect, whereas year and block nested within year were considered random effects. Statistical analysis for all field experiments was performed using PROC GLM in SAS 9.2 (Statistical Analysis Software (SAS) 9.2. SAS Institute, Inc., 100 SAS Campus Drive, Cary, NC). Treatment means for all metrics were separated by LSD utilizing PROC GLM in SAS. Differences between dry biomass of treated plants (harvested 21 DAT) and dry biomass of pretreatment plants were also calculated. Difference values were compared to determine plant recovery and regrowth following treatment.
Greenhouse herbicide dose–response experiments
Waterhemp populations
Inflorescences from 25 female CHR waterhemp plants not controlled with lactofen were collected from the field in August 2013 and dried at room temperature. Seeds were first surface sterilized by a 10-min treatment with 1:1 commercial bleach (Clorox, The Clorox Company, 1221 Broadway, Oakland, CA)–water solution, then washed twice with sterilized deionized water, suspended in 0.15% (w/w) agarose, and stored at 4 C to improve seed germination (Bell et al. Reference Bell, Hager and Tranel2013). Plants grown from collected seed were treated with ALS-, PSII-, and HPPD-inhibiting herbicides, and survivors were crossed to generate multiple accessions. These crosses were performed to reduce variability in all subsequent dose–response experiments similar to crosses described in other research (Hausman et al. Reference Hausman, Tranel, Riechers, Maxwell, Gonzini and Hager2013; Varanasi et al. Reference Varanasi, Brabham and Norsworthy2018). The accession ‘CHR-M6’ was selected from the initial crosses for greenhouse experiments because of its ample seed supply and high percent germination; note that although using the CHR-M6 accession facilitated the quantification of different resistance types occurring within the CHR population, it precluded the determination of the degree to which different resistances overlapped among individuals within the CHR source population. The response of CHR-M6 plants was compared with other sensitive and resistant waterhemp populations (described subsequently) in three separate dose–response experiments.
Greenhouse plant culture
All plants were germinated from seeds sown in 12- by 12-cm flats containing a commercial potting medium (LC1 Sun Gro Horticulture, 15831 N.E. 8th Street, Bellevue, WA). Emerged seedlings (2 cm tall) were transplanted into 7.5-cm-deep plug inserts (one seedling per insert). One week later, plugs were transplanted into 950-cm3 pots containing a 3:1:1:1 mixture of potting mix–soil–peat–sand that included a slow-release fertilizer (Scotts Osmocote Classic 13–13–13, The Scotts Company, 14111 Scottslawn Rd., Marysville, OH). Greenhouse conditions were maintained at 28 C/22 C during the day/night with a 16-h photoperiod. Natural sunlight was supplemented with mercury halide lamps to provide 800 µmol m−2 s−1 photon flux at the plant canopy.
Herbicide application
All herbicides were applied using a moving-nozzle, compressed-air research spray chamber (Generation III Research Sprayer; DeVries Manufacturing, 28081 870th Avenue, Hollandale, MN) with an adjustable platform and equipped with an 80015EVS even flat-spray nozzle (Teejet Technologies, Wheaton, IL). The nozzle was positioned approximately 45 cm above the plant canopy, and the sprayer was calibrated to deliver 185 L ha−1 at 275 kPa. Treatments were applied to all replications in order from lowest to highest dose.
Mesotrione, 2,4-D, and atrazine dose–response experiments
The response of CHR-M6 to foliar-applied mesotrione was compared to another HPPD-resistant population from Illinois (NH40) that is also resistant to ALS- and PSII-inhibiting herbicides (Hausman et al. Reference Hausman, Singh, Tranel, Riechers, Kaundun, Polge, Thomas and Hager2011, Reference Hausman, Tranel, Riechers, Maxwell, Gonzini and Hager2013, Reference Hausman, Tranel, Riechers and Hager2016). Two populations sensitive to HPPD inhibitors (WUS and BCR) were included for comparison. WUS was collected in Brown County, OH, and is not resistant to herbicides, whereas BCR is from Brown County, IL, and is resistant to EPSPS-, ALS-, PPO-, and PSII-inhibiting herbicides (Bell et al. Reference Bell, Hager and Tranel2013). CHR-M6, NH40, and WUS were evaluated in atrazine dose–response experiments, whereas the response of CHR-M6 to 2,4-D was compared to WUS and a Nebraska waterhemp population (designated NE) resistant to 2,4-D (Bernards et al. Reference Bernards, Crespo, Kruger, Gaussoin and Tranel2012).
Uniformly sized plants (10 cm tall) from the respective populations (CHR-M6, NH40, BCR, WUS, and NE) were treated with herbicide at increasing doses equally spaced along a base 3.16 (mesotrione), 2 (2,4-D), or 2.5 (atrazine) logarithmic scale, resulting in 9, 10, and 9 herbicide doses for mesotrione, 2,4-D, and atrazine, respectively, and one nontreated control for each population (Seefeldt et al. Reference Seefeldt, Jensen and Fuerst1995). Mesotrione doses applied to HPPD-sensitive populations (BCR and WUS) ranged from 0.1 to 1,050 g ha−1, whereas the doses applied to CHR-M6 and NH40 ranged from 1 to 10,500 g ha−1. Crop oil concentrate (Herbimax; Loveland Products, Inc., 3005 Rocky Mountain Avenue, Loveland, CO) at 1% (v/v) and ammonium sulfate (AMS) (N-PAK AMS; Winfield Solutions, LLC, P.O. Box 64589, St. Paul, MN) at 2.5% (v/v) were included with all treatments containing mesotrione. Doses of 2,4-D dimethylamine salt applied to the sensitive population (WUS) ranged from 4.37 to 2,240 g ae ha−1, and from 140 to 17,926 g ae ha−1 for CHR-M6 and NE. Nonionic surfactant (Activator 90; Loveland Products, Inc., P.O. Box 1286, Greeley, CO) at 0.25% (v/v) and AMS (2.5% v/v) were included with all treatments containing 2,4-D. Doses of atrazine applied to the sensitive population (WUS) ranged from 11 to 7,002 g ai ha−1, whereas doses applied to CHR-M6 and NE ranged from 72 to 43,759 g ai ha−1. All treatments containing atrazine included crop oil concentrate (1% v/v) and AMS (2.5% v/v).
Immediately after herbicide application, treated plants were placed on greenhouse benches in a randomized complete block design. Each application dose was replicated eight times, and each dose–response experiment was conducted twice. At 21 DAT, all aboveground plant tissue was harvested, dried at 65 C for 7 d, and dry biomass recorded.
Statistical analysis of dose–response experiments
Dry biomass within each dose was averaged and converted to a percentage of the nontreated control. All dry biomass data generated from two runs of the experiment were pooled, as Levene’s test for homogeneity of variance was not significant. Combined data were analyzed using a nonlinear regression model with the ‘drc’ package in R software (Knezevic et al. Reference Knezevic, Streibig and Ritz2007). The dose–response model was constructed using Equation 1:
 $$y = c + \Bigg({{d - c} \over {1 + \exp \{ b[\log (x) - \log (GR50/GR90)]\} }}\Bigg).$$
([1])
The four-parameter, nonlinear logistic model is described as follows: b is the slope of the curve, c is the lower limit, d is the upper limit and GR50/GR90 is 50% or 90% reduction in dry biomass, respectively, compared with nontreated plants.
Laboratory assays of resistance mechanisms
Resistance mechanisms to ALS-, PPO-, and PSII-inhibiting herbicides
To elucidate waterhemp resistance mechanisms to ALS-, PPO-, or PSII-inhibiting herbicides, genomic DNA was extracted from three CHR-M6 plants, two ALS- or PPO-resistant (positive control) populations, and two ALS- or PPO-sensitive (negative control) populations. Polymerase chain reaction (PCR)-based molecular markers were used to detect any polymorphisms in the ALS region encoding amino acid position 574 for each population following previously described methods (Patzoldt and Tranel Reference Patzoldt and Tranel2007). An assay to detect the ΔG210 PPX2 mutation (Lee et al. Reference Lee, Hager and Tranel2008; Thinglum et al. Reference Thinglum, Riggins, Davis, Bradley, Al-Khatib and Tranel2011) was performed utilizing an allele-specific PCR analysis. Detection of resistance mechanisms was investigated by separating the PCR products in a 1.2% agarose gel containing 5 µg ml−1 ethidium bromide, then comparing CHR-M6 products with products generated from the positive and negative controls.Resistance to atrazine, a symmetrical triazine, occurs through target site mutation or enhanced herbicide metabolism (Ma et al. Reference Ma, Kaundun, Tranel, Riggins, McGinness, Hager, Hawkes, McIndoe and Riechers2013; Mengistu et al. Reference Mengistu, Mueller-Warrant, Liston and Barker2000; Patzoldt et al. Reference Patzoldt, Dixon and Tranel2003). The Ser264 to Gly target site mutation confers resistance to both symmetrical and asymmetrical triazines (e.g., metribuzin), whereas resistance patterns resulting from enhanced metabolism are less predictable (Shukla and Devine Reference Shukla, Devine, LeBaron, McFarland and Burnside2008). Observations from field studies indicated soil-applied metribuzin effectively controlled CHR, suggesting a non–target site triazine resistance mechanism. To test this hypothesis, genomic DNA was extracted from three CHR-M6 plants and the entire gene encoding the atrazine target protein (psbA) was sequenced to determine if target site mutations were present (Foes et al. Reference Foes, Tranel, Wax and Stoller1998).
Results and discussion
Response of CHR to herbicides: field experiments
Foliar-applied herbicides
ALS inhibitors (Group 2)
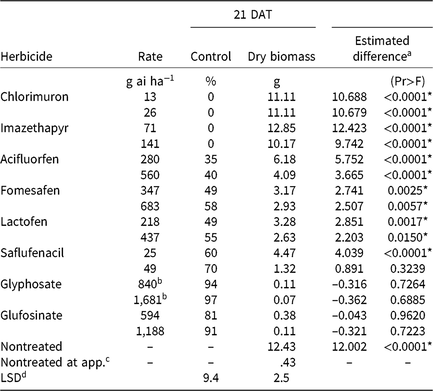
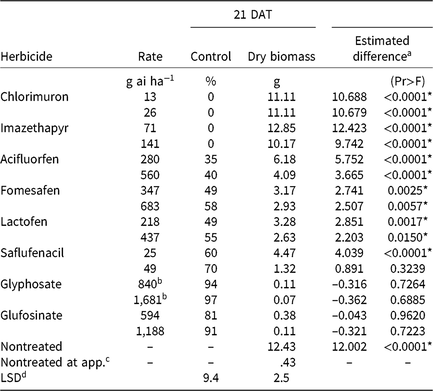
Chlorimuron and imazethapyr did not control CHR 21 DAT regardless of application rate (Table 3). Plants treated with either rate of these herbicides had significant biomass increases 21 DAT compared with pretreatment plants, and biomass values were comparable to nontreated plants harvested 21 DAT. The magnitude of poor control is consistent with target site resistance to ALS-inhibiting herbicides (Patzoldt and Tranel Reference Patzoldt and Tranel2007), which was investigated further as described below.
Table 3. Waterhemp control, dry biomass, and estimated difference between dry biomass of treated plants harvested 21 d after treatment (DAT) and dry biomass of pretreatment plants in foliar-applied soybean herbicide experiments (2014–2015).
a Estimated difference in dry biomass between herbicide-treated plants and pretreatment plants.
* Significant at α = 0.05; treatments with positive differences indicate growth following herbicide application.
b Acid equivalent (g ae ha−1).
4 Plants harvested prior to treatment application to assess biomass accumulation following herbicide application.
d Separated by PROC GLM in SAS, α = 0.05.
Synthetic auxins (Group 4)
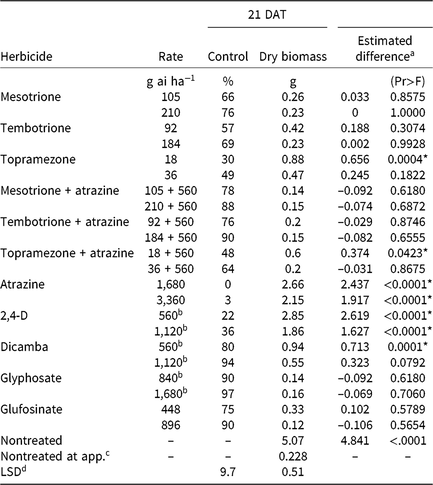
CHR control with two synthetic auxin herbicides differed dramatically. Dicamba controlled CHR 80% to 94% depending on rate, whereas control with 2,4-D did not exceed 36% regardless of rate (Table 4). Plants treated with 2,4-D developed injury symptoms, including minor leaf cupping and epinasty, but rapidly recovered and resumed growth. There were no differences in plant dry biomass between dicamba rates, but the 2× rate of 2,4-D reduced dry biomass more than the 1× rate. Estimated difference values indicate significant dry biomass accumulation 21 DAT with either rate of 2,4-D and the 1× rate of dicamba, but not with the 2× rate of dicamba. Control of CHR with 2,4-D was much less than that reported for a waterhemp population controlled 62% and 94% with 560 and 1,120 g ae ha−1 2,4-D, respectively, 28 DAT (Robinson et al. Reference Robinson, Simpson and Johnson2012). Interestingly, control of CHR with 2,4-D is similar to that reported for MCR (see below) (16% at 14 DAT) (Hausman et al. Reference Hausman, Tranel, Riechers and Hager2016).
Table 4. Waterhemp control, dry biomass, and estimated difference between dry biomass of treated plants harvested 21 d after treatment (DAT) and dry biomass of pretreatment plants in foliar-applied corn herbicide experiments (2014–2015).
a Estimated difference in dry biomass between herbicide-treated plants and pretreatment plants.
* Significant at α = 0.05; treatments with positive differences indicate growth following herbicide application.
b Acid equivalent (g ae ha−1).
c Plants harvested prior to treatment application to assess biomass accumulation following herbicide application.
d Separated by PROC GLM in SAS, α = 0.05.
Atrazine (Group 5)
Atrazine did not control CHR regardless of rate, and treated plants lacked injury symptoms. Estimated difference values indicate significant dry biomass accumulation 21 DAT regardless of atrazine rate. Previous studies reported 8% control of PSII inhibitor-resistant waterhemp 14 DAT (Hausman et al. Reference Hausman, Tranel, Riechers and Hager2016) and 21% control 28 DAT (Anderson et al. Reference Anderson, Roeth and Martin1996).
PPO inhibitors (Group 14)
Plants treated with PPO-inhibiting herbicides rapidly became chlorotic and eventually necrotic, but treated plants began to recover approximately 7 DAT. The PPO inhibitors that generally are applied after crop and weed emergence (acifluorfen, fomesafen, lactofen) controlled CHR 58% or less, regardless of application rate (Table 3). Saflufenacil, most commonly applied prior to soybean emergence, controlled CHR 60% to 70%. Increasing rates did not increase control of CHR with any PPO-inhibiting herbicide except saflufenacil. Additionally, differences in dry biomass were not detected among PPO inhibitors, and dry biomass did not differ by rate except with saflufenacil. Positive estimated difference values for all PPO inhibitor treatments indicate that treated plants had recovered by 21 DAT.
HPPD inhibitors (Group 27)
Control of CHR with HPPD-inhibiting herbicides was variable (Table 4). Control 21 DAT was similar for 1× rates of mesotrione and tembotrione, although control did not exceed 66%. Topramezone did not control CHR more than 49% regardless of rate. Compared with the 1× rate, control increased with the 2× rate of each HPPD inhibitor, but plant dry biomass reductions for each HPPD inhibitor were not different between rates.
Regardless of rate, waterhemp plants developed characteristic foliar whitening or bleaching following application (Mitchell et al. Reference Mitchell, Bartlett, Fraser, Hawkes, Holt, Townson and Wichert2001; Norris et al. Reference Norris, Barrette and DellaPenna1995; van Almsick Reference van Almsick2009). Most treated plants began to recover by 14 DAT. However, estimated difference values of pretreatment dry biomass and dry biomass harvested 21 DAT reveal few significant differences. Only plants treated with 1× topramezone produced more dry biomass 21 DAT compared with pretreatment plants.
Control of CHR with HPPD inhibitors was similar to a different HPPD-resistant waterhemp population, which was controlled less than 60% with labeled rates of three HPPD-inhibiting herbicides (McMullan and Green Reference McMullan and Green2011). Control of CHR with mesotrione, tembotrione, and topramezone, however, generally was greater than control of another HPPD-resistant population from Illinois (designated MCR), for which control with the same HPPD inhibitors applied at similar rates was 27% or less (Hausman et al. Reference Hausman, Singh, Tranel, Riechers, Kaundun, Polge, Thomas and Hager2011, Reference Hausman, Tranel, Riechers and Hager2016).
HPPD inhibitors and atrazine (Groups 27 and 5)
A synergistic interaction between HPPD-inhibiting herbicides and certain PSII inhibitors has been reported but does not always overcome resistance (Hausman et al. Reference Hausman, Singh, Tranel, Riechers, Kaundun, Polge, Thomas and Hager2011; Ma et al. Reference Ma, Kaundun, Tranel, Riggins, McGinness, Hager, Hawkes, McIndoe and Riechers2013; Woodyard et al. Reference Woodyard, Hugie and Riechers2009). Control of CHR increased when 560 g ai ha−1 atrazine was combined with each HPPD inhibitor, but plant dry biomass values were not different. Additionally, estimated differences in dry biomass of pretreatment and treated plants were not significant, with the exception of the 1× rate of topramezone + atrazine (Table 4). The increase in control of CHR with HPPD inhibitors in combination with atrazine is similar to the MCR population for which control with topramazone, tembotrione, and mesotrione was increased by the addition of atrazine, yet complete mortality was not achieved (Hausman et al. Reference Hausman, Singh, Tranel, Riechers, Kaundun, Polge, Thomas and Hager2011, Reference Hausman, Tranel, Riechers and Hager2016).
Other SOAs (Groups 9 and 10)
In both corn and soybean experiments glyphosate controlled CHR at least 90% regardless of rate, whereas a similar level of control with glufosinate required a 2× rate (Tables 3 and 4). Plant dry biomass, however, was similar among all rates of glyphosate and glufosinate. Estimated difference values indicate that significant dry biomass accumulation did not occur following application of glyphosate or glufosinate, suggesting both remain effective for controlling CHR. Control of CHR with glyphosate and glufosinate is similar to other waterhemp populations for which control was 89% to 100% with glyphosate (Hausman et al. Reference Hausman, Tranel, Riechers and Hager2016; Robinson et al. Reference Robinson, Simpson and Johnson2012) and 82% to 95% with glufosinate (Coetzer et al. Reference Coetzer, Al-Khatib and Peterson2002; Sarangi et al. Reference Sarangi, Sandell, Knezevic, Aulakh, Lindquist, Irmak and Jhala2015).
Soil-applied herbicides
Atrazine and metribuzin (Group 5)
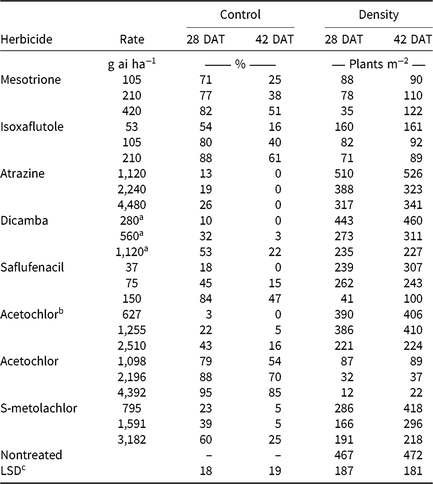
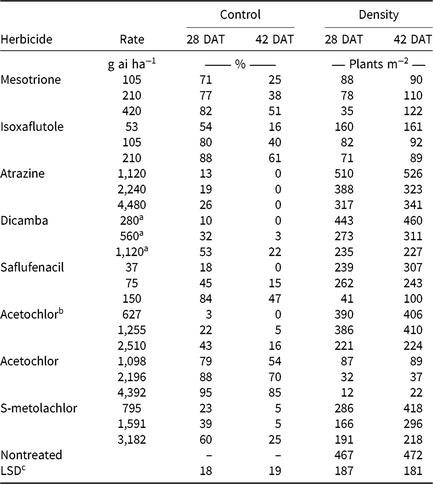
Monthly precipitation recorded at the field location for each season is reported in Table 5. Regardless of rate, control of CHR with atrazine 28 DAT was ≤26%; no control was observed 42 DAT (Table 6). Waterhemp density was not different from nontreated control plots 28 and 42 DAT regardless of atrazine rate. Metribuzin controlled CHR 95% and 88% at 28 and 42 DAT, respectively, at the field-recommended rate (Table 7) and reduced waterhemp density 85% compared with the nontreated 28 and 42 DAT.
Table 5. Monthly precipitation recorded during field experiments (2014–2015) and 30-yr average for the Champaign-Urbana, IL, area (1981–2010).

a Averages retrieved from Angel J (1981–2010). Averages and Records for Champaign-Urbana, Illinois. https://www.isws.illinois.edu/statecli/cuweather/cu-averages.htm.
Table 6. Visible estimates of waterhemp control and stand counts of waterhemp density 28 and 42 d after treatment (DAT) in soil-applied corn herbicide experiments (2014–2015).
a Acid equivalent (g ae ha−1).
b Encapsulated formulation.
c Separated by PROC GLM in SAS, α = 0.05.
Table 7. Visible estimates of waterhemp control and stand counts of waterhemp density 28 and 42 d after treatment (DAT) in soil-applied soybean herbicide experiments (2014–2015).
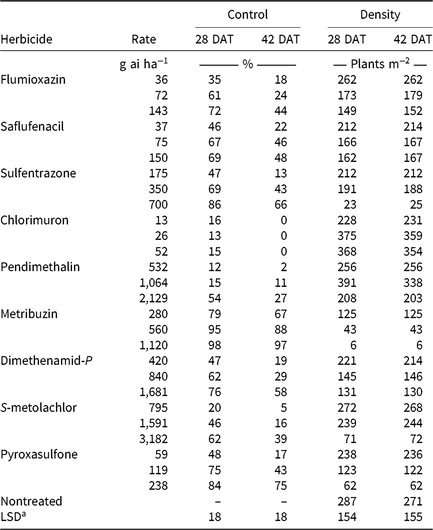
a Separated by PROC GLM in SAS, α = 0.05.
PPO inhibitors (Group 14)
Soil-applied PPO-inhibiting herbicides at 1× rates controlled CHR 61% to 69% 28 DAT, but 46% or less 42 DAT (Table 7). Only sulfentrazone at 2× reduced waterhemp density compared with the nontreated. This contradicts previous research demonstrating that the soil-applied PPO inhibitors flumioxazin and sulfentrazone remained efficacious on PPO-resistant waterhemp, with greater than 80% control at similar evaluation timings (Harder et al. Reference Harder, Nelson and Smeda2012; Shoup and Al-Khatib Reference Shoup and Al-Khatib2004). In corn experiments (Table 6), a 1× rate of saflufenacil provided 45% and 15% control of CHR 28 and 42 DAT, respectively. Population density of saflufenacil-treated plots, however, was less than the nontreated controls.
Very-long-chain fatty acid inhibitors (Group 15)
In corn experiments, control of CHR with nonencapsulated acetochlor was different from S-metolachlor across rates at each evaluation. The 1× rate of nonencapsulated acetochlor controlled CHR 88% and 70% 28 and 42 DAT, respectively, whereas control with 2× S-metolachlor was 60% or less (Table 6). In soybean experiments, control with 2× S-metolachlor was 62% or less (Table 7). The label-recommended rate of S-metolachlor reduced waterhemp density 28 DAT in corn experiments, but not in soybean experiments or at 42 DAT in either. Control of CHR with these herbicides is similar to that previously reported for MCR, where control with 1× acetochlor was 83% but less than 20% with 1× S-metolachlor (Hausman et al. Reference Hausman, Tranel, Riechers, Maxwell, Gonzini and Hager2013).
Control with encapsulated acetochlor did not exceed 32% 28 DAT or 5% 42 DAT, with waterhemp densities not different from the nontreated control (Table 6). In soybean experiments, control with pyroxasulfone and dimethenamid-P applied at 1× ranged from 62% to 75% 28 DAT, but decreased to 29% to 43% 42 DAT (Table 7). The 1× and 2× rates of pyroxasulfone and the 2× rates of dimethenamid-P reduced waterhemp density 28 DAT, whereas only the 2× rate of pyroxasulfone reduced waterhemp density 42 DAT. Control of HPPD-resistant waterhemp with pyroxasulfone has ranged from 48% to 84% (this research), 87% to 89% for MCR (Hausman et al. Reference Hausman, Tranel, Riechers, Maxwell, Gonzini and Hager2013), and 90% to 95% for a Nebraska population 30 DAT (Oliveira et al. Reference Oliveira, Jhala, Gaines, Irmak, Amundsen, Scott and Knezevic2017). Control of CHR with various Group 15 herbicides was similar to that reported in subsequent studies where differential responses to Group 15 herbicides were demonstrated in field and greenhouse experiments (Strom et al. Reference Strom, Gonzini, Mitsdarfer, Davis, Riechers and Hager2017).
HPPD inhibitors (Group 27)
Control across all rates of HPPD-inhibiting herbicides ranged from 54% to 88% at 28 DAT and decreased to 16% to 61% at 42 DAT (Table 6). These values are in contrast with previous reports regarding the efficacy of soil-applied HPPD inhibitors on a sensitive waterhemp population, in which 100% control was achieved 28 d after crop emergence (Vyn et al. Reference Vyn, Swanton, Weaver and Sikkema2006). Each rate of isoxaflutole and mesotrione did, however, reduce waterhemp density compared with the nontreated at each evaluation.
Other SOAs (Groups 2, 3, 4)
Pendimethalin and chlorimuron applied at the label-recommended rate did not control CHR more than 15% 28 DAT and less than 11% 42 DAT (Table 7), with waterhemp densities not different from nontreated plots at either evaluation time. In corn experiments, soil-applied dicamba controlled CHR 32% 28 DAT and only 3% 42 DAT with waterhemp densities not different from nontreated plots (Table 6).
Mechanisms of resistance and greenhouse herbicide dose–response experiments
Resistance mechanisms to ALS-, PPO-, and PSII-inhibiting herbicides
PCR-based molecular marker analysis was performed to determine if resistance to ALS-inhibiting herbicides in CHR-M6 is attributable to an amino acid substitution at position 574 of ALS. A comparison of bands generated from positive (ALS resistant) controls and CHR-M6 indicated identical band sizes, thereby revealing that plants from CHR possess a target site mutation known to confer resistance to ALS-inhibiting herbicides (Patzoldt and Tranel Reference Patzoldt and Tranel2007; Tranel and Wright Reference Tranel and Wright2002). Resistance to PPO inhibitors was also investigated via molecular marker analysis. A comparison of the products amplified between positive (PPO resistant) controls and CHR-M6 indicated identical band sizes, thereby revealing that plants from CHR possess the ΔG210 PPX2 mutation known to confer resistance to PPO-inhibiting herbicides (Patzoldt et al. Reference Patzoldt, Hager, McCormick and Tranel2006).
Sequence analysis of the entire psbA gene (encoding the D1 protein) did not reveal mutations known to confer target site resistance to PSII inhibitors (data not shown), suggesting that atrazine resistance in CHR-M6 might be caused by enhanced atrazine metabolism, similar to that reported previously (Ma et al. Reference Ma, Kaundun, Tranel, Riggins, McGinness, Hager, Hawkes, McIndoe and Riechers2013).
Mesotrione, 2,4-D, and atrazine dose-response experiments
HPPD inhibitors caused characteristic injury (stunting and bleaching of meristematic tissue) on plants from all populations. However, compared with sensitive populations WUS and BCR, CHR-M6 and NH40 exhibited far less (data not presented). Injury to WUS and BCR generally increased over time, whereas CHR-M6 and NH40 began to recover approximately 10 DAT. By 14 DAT new, noninjured leaf tissue was present on the majority of CHR-M6 and NH40 plants.
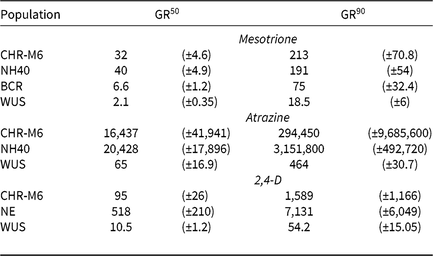
Treatment of WUS, BCR, CHR-M6, and NH40 with a range of mesotrione doses produced response curves demonstrating decreasing dry biomass with increasing doses (Figure 1). GR50 and GR90 values (Table 8) were calculated to determine the estimated doses of mesotrione to reduce plant dry biomass 50% and 90%. Calculated resistance ratios (based on GR50 values) in CHR-M6 to mesotrione were 4.8- or 16-fold when compared to BCR or WUS, respectively.
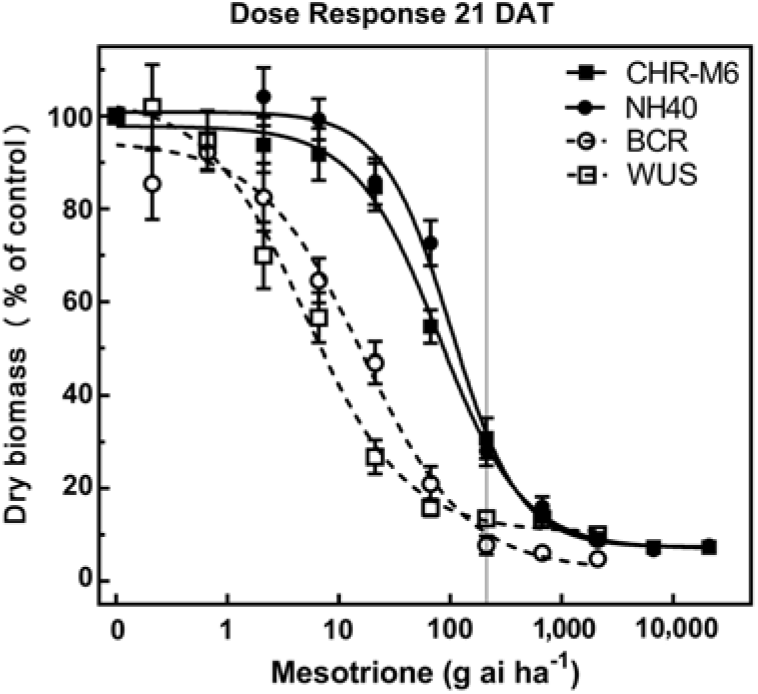
Figure 1. Mesotrione dose–response curves for CHR-M6 compared with HPPD inhibitor–sensitive populations WUS and BCR and the HPPD inhibitor–resistant NH40 populations. Aboveground dry biomass was harvested 21 d after treatment (DAT). The vertical line through response curves signifies a typical rate for field use.
Table 8. Estimated GR50 and GR90 values for dry biomass in pooled greenhouse dose–response experiments among waterhemp populations.a, b
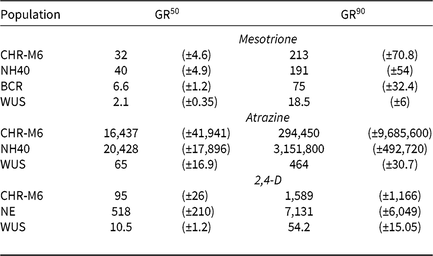
a Estimated values are expressed in g ai ha−1 (mesotrione and atrazine) or g ae ha−1 (2,4-D) and are followed by their respective standard errors in parentheses.
b Abbreviations: GR50 and GR90, herbicide doses required to reduce waterhemp dry biomass 50% and 90%, respectively.
A previously confirmed HPPD inhibitor–resistant waterhemp population from Iowa exhibited an 8-fold decrease in sensitivity to mesotrione compared with a sensitive population (McMullan and Green Reference McMullan and Green2011). This population required 21 g ha−1 mesotrione for 50% control (determined visibly), whereas CHR-M6 required 32 g ha−1 mesotrione to reduce dry biomass 50%. The GR50 of MCR was reported to be 48.5 g ha−1 mesotrione (Hausman et al. Reference Hausman, Singh, Tranel, Riechers, Kaundun, Polge, Thomas and Hager2011), a value similar to that reported in this research. These data indicate that CHR-M6 exhibits a level of resistance similar to that of other waterhemp populations confirmed resistant to HPPD-inhibiting herbicides.
Unlike BCR, WUS has not been previously treated with herbicides (Bell et al. Reference Bell, Hager and Tranel2013). Although BCR was less sensitive to mesotrione than WUS, all plants from both populations were completely controlled (no green tissue) with 105 g ha−1 mesotrione (the label-recommended rate for foliar applications). In contrast, 105 g ha−1 mesotrione reduced dry biomass of CHR-M6 and NH40 69% and 71%, respectively, when averaged across all replications of the experiment.
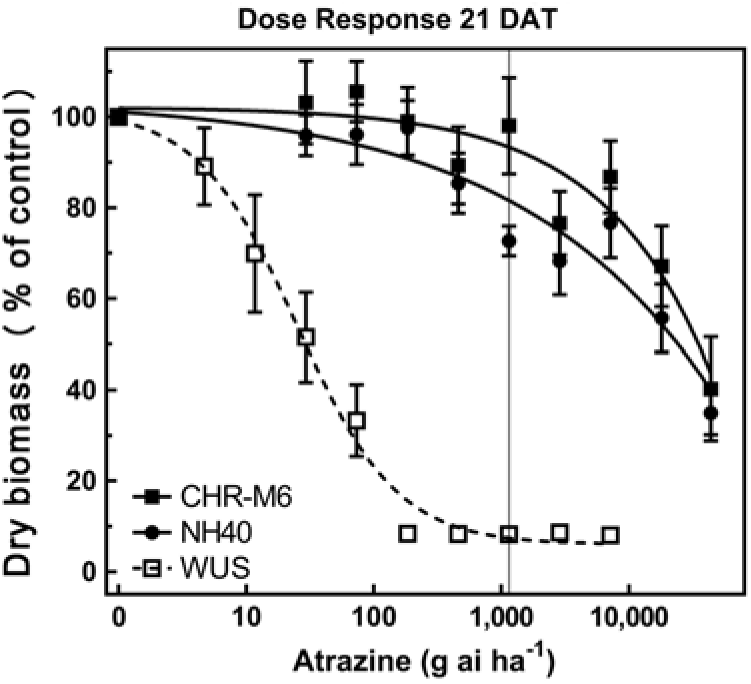
Following treatment with atrazine, WUS displayed injury symptoms (leaf chlorosis followed by necrosis) commonly observed following foliar exposure to PSII-inhibiting herbicides (Hess Reference Hess2000). CHR-M6 and NH40 demonstrated no injury from all but the highest atrazine doses. A distinct separation of dose–response curves between atrazine-resistant and sensitive waterhemp populations is observed in Figure 2. A majority of CHR-M6 and NH40 plants survived treatment with the highest dose of atrazine (44 kg atrazine ha−1).
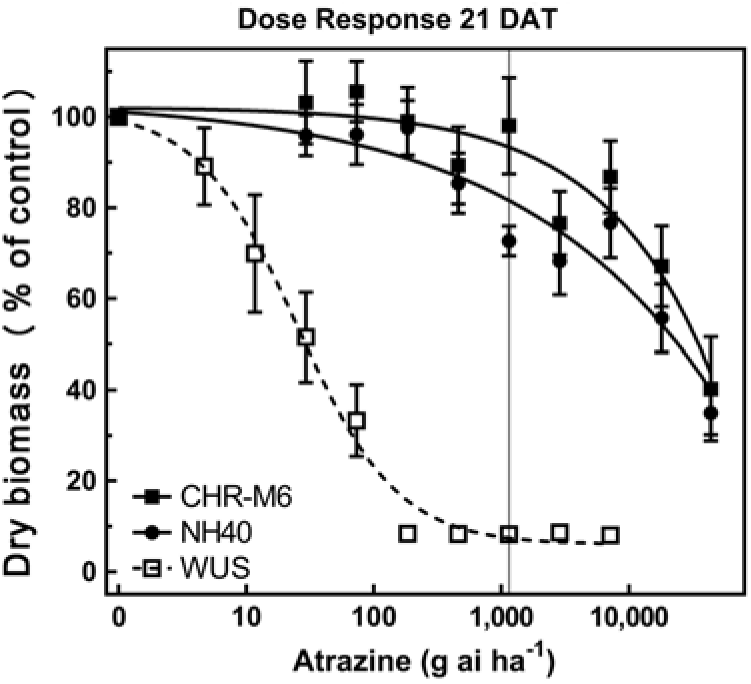
Figure 2. Atrazine dose–response curve for CHR-M6 compared with atrazine-resistant population NH40, and the sensitive population WUS. Aboveground dry biomass was harvested 21 d after treatment (DAT). The vertical line through response curves signifies a typical rate for field use.
Using calculated GR50 values (Table 8), CHR-M6 was 252-fold resistant to atrazine relative to WUS, and NH40 was 1.2-fold more resistant than CHR-M6. Reports of other atrazine-resistant waterhemp populations indicate levels of resistance ranging from 10-fold (non–target site–based resistance) (McMullan and Green Reference McMullan and Green2011), 38-fold (non–target site–based resistance) (Patzoldt et al. Reference Patzoldt, Tranel and Hager2005), to >185-fold (target site–based resistance) (Foes et al. Reference Foes, Tranel, Wax and Stoller1998). The magnitude of atrazine resistance in CHR-M6 and NH40, coupled with the inability to achieve plant mortality at the highest application rate, resulted in high estimated effective doses and large standard errors. An accurate estimated effective dose of atrazine could not be calculated from the data.
Treatment with 2,4-D caused characteristic synthetic auxin injury (epinasty, leaf strapping, stunting) on plants from all populations. The dose required to cause injury to plants in the sensitive population was much less than that required to cause injury to CHR-M6 and NE (data not presented). At higher doses (2,240–17,926 g ae ha−1), injury symptoms not commonly observed with synthetic auxin herbicides, including leaf chlorosis and necrosis, were observed on CHR-M6 and NE plants. Complete mortality of CHR-M6 or NE was not achieved with most doses, and treated plants began to recover by 21 DAT. Failure to achieve complete control resulted in high standard errors of calculated GR values. Dry biomass of WUS, CHR-M6, and NE plants treated with a range of 2,4-D rates decreased with increasing doses (Figure 3). The calculated GR50 values (Table 8) for CHR-M6 produce a resistance ratio of 9.5-fold compared with WUS, whereas NE is 5-fold more resistant than CHR-M6. The resistance ratio for CHR-M6 compared with WUS increases to 30-fold when GR90 values are used to calculate ratios.
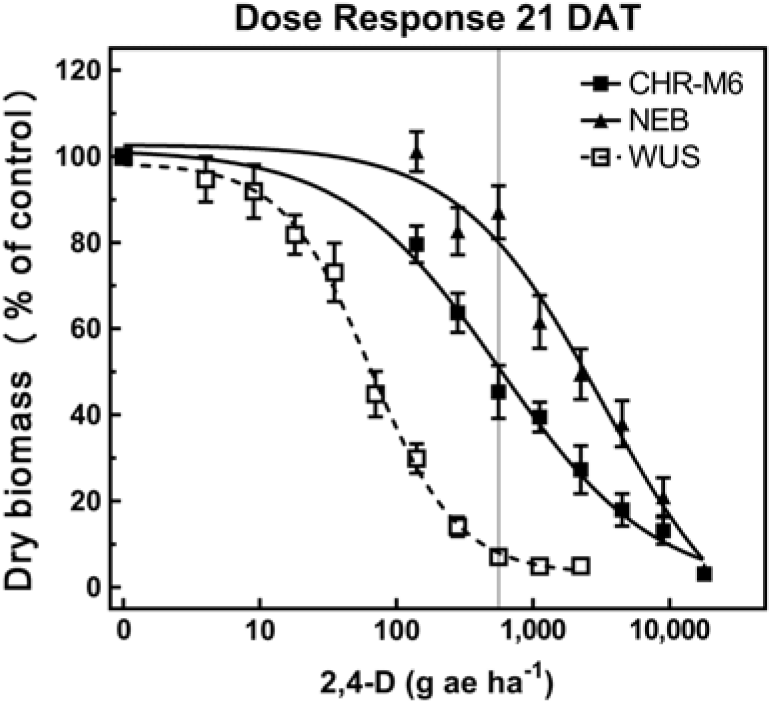
Figure 3. 2,4-D dose–response curve for CHR-M6 compared with 2,4-D-resistant population NE, and the sensitive population WUS. Aboveground dry biomass was harvested 21 d after treatment (DAT). The vertical line through response curves signifies a typical rate for field use.
The Nebraska 2,4-D–resistant waterhemp population was reported to be 10-fold resistant to 2,4-D (Bernards et al. Reference Bernards, Crespo, Kruger, Gaussoin and Tranel2012), whereas the Missouri population (Shergill et al. Reference Shergill, Barlow, Bish and Bradley2018) was 3-fold resistant. Resistance ratios of other weed species resistant to 2,4-D have varied, including 2.5-fold in wild radish (Raphanus raphanistrum L.) (Walsh et al. Reference Walsh, Powles, Beard, Parkin and Porter2004), 18-fold in wild mustard [Brassica kaber (DC.) Wheeler] (Heap and Morrison Reference Heap and Morrison1992), 25-fold for prickly lettuce (Lactuca serriola L.) (Burke et al. Reference Burke, Yenish, Pittman and Gallagher2009), and 29-fold for globe fringebrush [Fimbristylis miliacea (L.) Vahl] (Karim et al. Reference Karim, Man and Sahid2004).
The rate of 2,4-D commonly used in Illinois (1,120 g ae ha−1) reduced dry biomass of CHR-M6 and NE by 60% and 39%, respectively. The same rate reduced the dry biomass of WUS by 95%. These data illustrate a distinct difference in response to 2,4-D between the sensitive population (WUS) and CHR-M6.
Implications and future research
Our results indicate that the CHR population is resistant to herbicides from five site-of-action groups, including inhibitors of ALS, PPO, PSII, and HPPD, and the synthetic auxin 2,4-D. Unexpectedly, CHR has evolved resistance to 2,4-D, which, based on herbicide use history, had not previously been applied. The dioecious biology of waterhemp and high intraspecific genetic variability favor the evolution of resistance and multiple resistance (Tranel et al. Reference Tranel, Riggins, Bell and Hager2011), but may not solely be responsible. Cross-resistance, that is, resistance to a herbicide through indirect selection by another (Beckie and Tardif Reference Beckie and Tardif2012), might have resulted in 2,4-D resistance in CHR. Resistance to 2,4-D in the Nebraska waterhemp population is due to enhanced metabolism, probably mediated by cytochrome P450 enzymes (Figueiredo et al. Reference Figueiredo, Leibhart, Reicher, Tranel, Nissen, Westra, Bernards, Kruger, Gaines and Jugulam2018). Although the mechanism of 2,4-D resistance within CHR remains unknown, it is possible that selection for P450-mediated resistance, as occurred in MCR (Ma et al. Reference Ma, Kaundun, Tranel, Riggins, McGinness, Hager, Hawkes, McIndoe and Riechers2013), resulted in cross-resistance to 2,4-D.
Resistance to 2,4-D in CHR could have been introduced via migration. Waterhemp pollen can travel long distances by wind (Liu et al. Reference Liu, Davis and Tranel2012), which could allow pollen migration into CHR and introduce genes from a neighboring resistant population (Liu et al. Reference Liu, Davis and Tranel2012), similar to glyphosate resistance (Sarangi et al Reference Sarangi, Tyre, Patterson, Gaines, Irmak, Knezevic, Lindquist and Jhala2017). Finally, seed might have migrated into CHR via wildlife (de Vlaming and Proctor Reference de Vlaming and Proctor1968; Myers et al. Reference Myers, Vellend, Gardescu and Marks2004), equipment (Heijting et al. Reference Heijting, Van der Werf and Kropff2008), or water (Li and Qiang Reference Li and Qiang2009; Norsworthy et al. Reference Norsworthy, Griffith, Griffin, Bagavathiannan and Gbur2014).
Based on the present research, glyphosate and glufosinate are among the few remaining foliar-applied herbicides that control CHR. Amaranthus species have not yet evolved resistance to glufosinate (Heap Reference Heap2018), but numerous waterhemp populations have evolved resistance to glyphosate (Heap Reference Heap2018), highlighting the urgent need to implement management practices that preserve the efficacy of glufosinate and glyphosate for managing CHR. This research also revealed limited soil-applied options for managing CHR. The PSII inhibitor metribuzin was effective, but CHR is resistant to atrazine. Nonencapsulated acetochlor also controlled CHR, but a differential response was documented with other Group 15 active ingredients. Further research is needed to investigate potential resistance to soil-applied herbicides in CHR and will continue to characterize the response of the population and resistance mechanisms to various foliar- and soil-applied herbicides. Overall, a population with this magnitude of multiple resistance can pose significant challenges for its effective management, which highlights the necessity for continued efforts in herbicide discovery and the implementation of weed management programs not solely dependent upon herbicides.
Author ORCIDs
Aaron G. Hager https://orcid.org/0000-0002-3823-7068
Acknowledgments
The authors thank Doug Maxwell and Lisa Gonzini for technical assistance and Janel Huffman for assistance with greenhouse crosses. No conflicts of interest have been declared. This research received no specific grant from any funding agency, commercial or not-for-profit sectors.


