Introduction
Throughout the major U.S. soybean growing regions, including central Kentucky, one of the most problematic weeds is horseweed (Erigeron canadensis L., also known as marestail; Green et al. Reference Green, Haramoto, Legleiter, Knott and Lee2018; Van Wychen Reference Van Wychen2016). With its small seed size, horseweed is capable of emergence in the absence of soil disturbance, so it can be especially prolific in no-till production (Green et al. Reference Green, Haramoto, Legleiter, Knott and Lee2018). Horseweed also has a complex emergence pattern. In Kentucky, given adequate soil moisture, emergence can commence as soon as seed is produced in August (ER Haramoto, personal observation). Emergence can continue through the fall until the soil temperature reaches the base temperature for emergence (12 C; Nandula et al. Reference Nandula, Eubank, Poston, Koger and Reddy2006) and can begin again in the early spring as soil temperature rises. Other factors such as residue cover and competition can make horseweed emergence difficult to predict.
Planting into weed-free fields is highly recommended for optimal yields. However, horseweed that emerges the previous fall or early in the spring may be too large to effectively control with postemergence applications at planting. Optimal control for fields with fall- and early spring-emerging cohorts include herbicide applications in the fall or early spring (Davis et al. Reference Davis, Kruger, Young and Johnson2010; Loux and Johnson Reference Loux and Johnson2010). Fall-sown cover crops can also reduce horseweed density and size of established plants (Brainard et al. Reference Brainard, Bakker, Noyes and Myers2012; Davis et al. Reference Davis, Kruger, Young and Johnson2010; Sherman Reference Sherman2018), though they are not likely to provide the same level of control as an herbicide application (Sherman Reference Sherman2018). However, integrating cover crops and herbicides can reduce selection pressure and may eliminate the need for additional postemergence applications.
Cereal rye cover crops reduce density and biomass of fall-emerging weeds (Cornelius and Bradley Reference Cornelius and Bradley2017; Haramoto Reference Haramoto2019; Hayden et al. Reference Hayden, Brainard, Henshaw and Ngouajio2012; Werle et al. Reference Werle, Burr and Blanco-Canqui2017). In addition, the residue remaining after termination can decrease summer annual weed density (including spring-emerging horseweed) in the subsequent cash crop (Cornelius and Bradley Reference Cornelius and Bradley2017; Mirsky et al. Reference Mirsky, Curran, Mortensen, Ryan and Shumway2011; Ryan et al. Reference Ryan, Mirsky, Mortensen, Teasdale and Curran2011). Weed suppression by cover crops has been linked to the amount of biomass produced; this suppression occurs both over the winter (Bybee-Finley et al. Reference Bybee-Finley, Mirsky and Ryan2017; Finney et al. Reference Finney, White and Kaye2016; Haramoto Reference Haramoto2019) and into the subsequent cash crop (Ryan et al. Reference Ryan, Mirsky, Mortensen, Teasdale and Curran2011; Stanton and Haramoto Reference Haramoto2019; Webster et al. Reference Webster, Simmons, Culpepper, Grey, Bridges and Scully2016). Producers seeking to maximize cover crop biomass to increase the provisioning of this ecosystem service will want to delay termination because later spring kill dates have a larger impact on biomass production than fall seeding date (Mirsky et al. Reference Mirsky, Curran, Mortensen, Ryan and Shumway2011). Needing to terminate horseweed earlier, however, is incompatible with this goal. Using selective herbicides such as 2,4-D or dicamba can target broadleaf weeds like horseweed while still allowing small grain cover crops to persist.
Cover crops and other standing vegetation such as winter weeds, however, could interfere with these early spring herbicide applications used to target emerged horseweed. Herbicide deposition on the soil surface was only 8% in soybean rows, compared with 44% between the rows, when applied to R3 soybean plants that were approximately 75 cm tall and grown in 76-cm rows (Creech et al. Reference Creech, Henry, Hewitt and Kruger2018). In corn (Zea mays L.), applied at V10 to plants approximately 1 to 1.2 m tall, coverage at the soil surface averaged 36% in the corn rows and 59% between rows (Creech et al. Reference Creech, Henry, Hewitt and Kruger2018). Deposition at the soil surface increased from 8% to 27% coverage as the distance from a strawberry [Fragaria x ananassa (Weston) Duchesne ex Rozier] crown increased from 0–5 cm to 10–15 cm (Sharpe et al. Reference Sharpe, Boyd, Dittmar, MacDonald, Darnell and Ferrell2018). Wheat (Triticum aestivum L.) height, leaf area, and canopy area were all correlated with overall canopy volume, and cultivars with greater canopy volume were associated with reduced herbicide deposition on the soil surface and weed control (Kim et al. Reference Kim, Marshall, Brain and Caseley2011). Similarly, in winter wheat, greater herbicide deposition was found under plants with only five leaves unfurled through three tillers present, compared with when the inflorescence was emerging, reaching a minimum of 5% coverage at that time (Jensen and Spliid Reference Jensen and Spliid2002). Deposition may also be more variable where more vegetation is present, though studies on the variability in spray solution coverage or deposit size under living vegetation appear to be lacking.
The objective of this study was to determine how a standing cereal rye cover crop, with and without a prior fall herbicide application, influenced 2,4-D ester solution coverage and spray deposit distribution in the early spring. We hypothesized that there would be less coverage immediately adjacent to the cereal rye cover crop rows, but that this early season application would be similar across areas without cover crop and between cover crop rows. Also, greater coverage in areas that received a fall herbicide application was expected. Lastly, we hypothesized that there would be greater variability in the deposition where there was more cover crop biomass. This investigation occurred within a larger trial studying the impact of a cereal rye cover crop, fall herbicide application, and spring herbicide applications on horseweed density before and immediately after soybean planting (Sherman Reference Sherman2018).
Materials and Methods
Site Preparation
Studies were conducted in adjacent fields at the University of Kentucky’s C. Oran Little Research Center near Versailles, KY (38.07°N, 84.74°W) for 2 years (Fall 2016–Spring 2017 and Fall 2017–Spring 2018). Historically, these fields were in a no-till corn/soybean rotation, but each site was fallow in the summer before being used for each study to ensure an ample population of fall-emerged horseweed. Soil type was a Bluegrass Maury silt loam (fine, mixed, active, mesic Typic Paleudalfs) with 2% to 6% slopes. No tillage was used during the course of the experiment.
Spray deposition was studied within a larger field experiment designed to study the impacts of integrating a cereal rye cover crop with fall- and spring-applied herbicides for horseweed management (see Sherman Reference Sherman2018). A split-plot, randomized complete block design was used with six replications of each treatment. The 2,4-D spray solution deposition was examined in all six replicates in 2017, whereas only three replicates were examined in 2018. The main plot factor was the cover crop treatment (fall-planted cereal rye or none), whereas the subplot factor was the fall herbicide treatment (saflufenacil; [Sharpen®, BASF, Research Triangle Park, NC] or no fall-applied herbicide). Cereal rye (cultivar ‘Aroostook’) was planted with a no-till drill at 19-cm spacing at a seeding rate of 90 kg ha−1 on November 1, 2016, and October 27, 2017. Saflufenacil (50 g ai ha−1; mixed with 1% v/v methylated seed oil and 2.5% v/v liquid ammonium sulfate) was applied with a CO2 pressurized backpack sprayer on October 31, 2016, and October 26, 2017. A spray volume of 140 L ha−1 was used. The following spring, 2,4-D (Low Vol 4®, Loveland Products, Greeley, CO) was applied on March 10, 2017, and April 5, 2018, at 800 g ae ha−1 using a CO2 pressurized backpack sprayer and a spray volume of 140 L ha−1. Boom height was 45 to 50 cm, and AIXR11002 nozzles were used. The cereal rye cover crop growth stage was at Feekes 6 in 2017 and Feekes 7 in 2018; the average height of the cover crop at this time in both years was approximately 40 cm. At the time of 2,4-D application, air temperature was 20 C and 6 C, with an average wind speed of 5 and 12 km hr−1 in 2017 and 2018, respectively.
Data Collection
Cereal rye and/or weed biomass was sampled roughly 1 week prior to termination in April of each year (cereal rye growth stage was at Feekes 10.0–10.1) by collecting above-ground biomass within two 0.25 m2 quadrats per plot. In plots with cereal rye, quadrats were placed across two rows; they were placed randomly in plots without cereal rye. All biomass was separated into weed and cereal rye fractions, dried at 60 C until a constant mass was achieved, then weighed.
Water-sensitive paper (WSP; Syngenta, Greensboro, NC) was used to monitor the 2,4-D application. The dimensions of the individual WSP were 5.2 by 7.4 cm. In plots containing cereal rye, one WSP was placed immediately adjacent to a cereal rye row and another was placed between two cereal rye rows. In plots without cereal rye, one WSP was placed randomly within the plot. Plots were then sprayed as described above, then all pieces of WSP were collected when dry and stored in individual paper bags until they were processed.
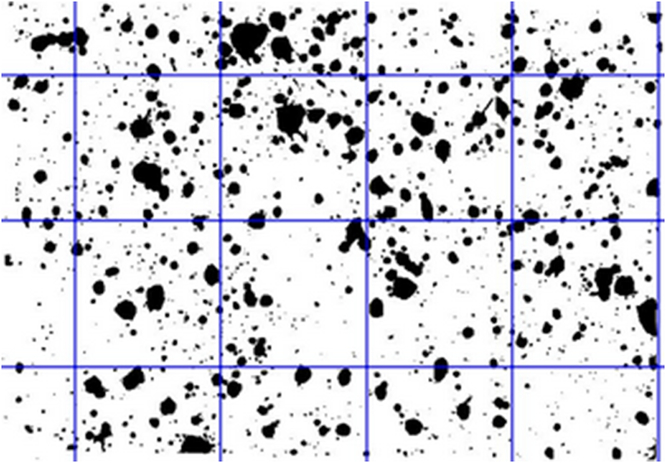
The WSP were scanned individually and images converted into JPEG format. ImageJ (Schneider et al. Reference Schneider, Rasband and Eliceiri2012) was used to analyze images. All images were first converted to a 32-bit grayscale image, then the threshold was adjusted to clarify individual 2,4-D spray solution deposits. To quantify herbicide deposition, three variables were determined over the entire WSP, for each individual WSP: the percent coverage, number of deposits, and average deposition size. To characterize variability in deposition, a grid composed of 300 mm2 squares was overlaid onto each WSP image in ImageJ (Figure 1). Next, the same variables (percent coverage, total number of deposits, and average size of each deposit) were then analyzed on each of the six individual grid squares per WSP. Deposits spanning across individual grid squares were not excluded from these analyses. The coefficient of variation (CV) was calculated between these six squares per WSP for each of the three above variables.

Figure 1. Example water-sensitive paper (WSP) with the grid overlay after thresholding in ImageJ. Deposits from the 2,4-D application are black. Percent coverage, number of deposits, and average deposit size were analyzed over the entire WSP. Additionally, these parameters were assessed on six individual grid squares, then the coefficient of variation (CV) was calculated between these six squares on one WSP. Parameters measured over the whole WSP, in addition to the CV calculated for each parameter on each WSP, were analyzed using analysis of variance.
Statistical Analysis
Data were analyzed using SAS with PROC MIXED (version 9.4, SAS Institute, Cary, NC); normality and equality of variance assumptions were examined prior to analysis. Cover crop and winter weed biomass were averaged over subsamples within a plot prior to analysis. Because cover crop and winter weed biomass were sampled prior to termination only and not at the time of 2,4-D application, only biomass from plots that did not receive 2,4-D was analyzed. This allowed assessment of how the fall herbicide application affected both cover crop and winter weed biomass, and how the cover crop affected winter weed biomass. This approach overestimates the amount of biomass present at the time of 2,4-D application but gives an indication of biomass differences between years. For cover crop biomass, fixed effects included the fall herbicide application and year; for winter weed biomass, cover crop was also included as a fixed, main plot factor. Winter weed biomass was square root transformed to improve normality. Both analyses included replicate as a random factor.
Due to the uneven number of replicates in each year, spray deposition variables were analyzed separately by year. Replicate was treated as a random effect, whereas fixed effects were the WSP position (adjacent to cover crop rows [“within rye rows”], between cover crop rows [“between rye rows”], or in areas without cover crop [“no cover crop”]) and the fall saflufenacil treatment. Either slicing or a Dunnett’s test was used to separate significant interactions; effects were considered significant at α = 0.05.
Results and Discussion
Cereal rye biomass averaged 3,190 kg ha−1 (SE 213) in spring 2017, but only 1,605 kg ha−1 (SE 206) in spring 2018. Greater cereal rye biomass production in 2016–17 was likely a result of milder winter temperatures; the 2017–18 winter was characterized by below average temperatures, including minimum temperatures below the 30-year average (Table 1). Spring measurements of winter weed biomass in plots without cereal rye averaged 988 and 562 kg ha−1 in 2017 and 2018, respectively. Cereal rye reduced winter weed biomass by an average of 85% in each year, while fall saflufenacil reduced winter weed biomass by 43% in 2016–17 and 93% in 2017–18 (data not shown). It was suspected that this application resulted in a greater reduction in winter weed biomass in the second year due to the cold winter weather experienced over 2017–18, which was not favorable for additional weed emergence nor growth of weeds that survived this application.
Table 1. Summary of weather conditions during the experimental period.
The percent coverage across the whole WSP differed among treatments and positions in 2017 (Table 2). Percent coverage of 2,4-D spray solution was 44% lower in areas immediately adjacent to the cereal rye cover crop rows (14.0%) compared with areas between cover crop rows (24.5%) or areas without a cover crop (26.0%; Figure 2A). In 2017, percent coverage of the 2,4-D spray solution was also 22% greater where saflufenacil was applied the previous fall (23.8%, SE 2.1) compared with where this application did not occur (18.6%, SE 2.0). No differences were noted in percent coverage across the whole WSP due to the saflufenacil treatment (average 23.1%, SE 3.1) in 2018 (Table 2). A trend of reduced percent coverage with cereal rye was noted in 2018 (Figure 2A), though these differences were not significant (Table 2). The number of deposits across the whole WSP was not affected by position or by fall saflufenacil application in either year (Table 2); an average of 878 (SE 38.4) and 1,350 (SE 114) deposits WSP−1 were measured in 2017 and 2018, respectively. More deposits were likely recorded in 2018 due to lower cover crop and winter weed biomass present in the plots. Average deposit size was reduced in the areas immediately adjacent to the cover crop rows relative to the other two positions in 2017 (Figure 2B), with deposits averaging 45% smaller without a cover crop and between cover crop rows (0.90 mm for each) compared with adjacent to cover crop rows (0.49 mm). As with percent coverage, a trend of smaller deposit sizes in cover cropped plots was noted in 2018 (Figure 2B), but these differences were not significant. Average deposit size was also greater in 2017 where saflufenacil was applied the previous fall (Table 2)—deposits averaged 0.88 mm with a fall saflufenacil application, but only 0.63 mm without this application—a 28% reduction.
Table 2. Results (p values) of analysis of variance on percent coverage, number of deposits, and average deposit size on the entire WSP. Years were analyzed separately. a
a Abbreviations: WSP, water-sensitive paper.

Figure 2. Percent spray coverage (A) and average deposit size (B) of 2,4-D spray solution on the whole water sensitive paper (WSP) in 2017 and 2018 located in different positions in the field. Within each year, letters denote significant differences between positions at α = 0.05.
Greater cover crop biomass in 2016–17 relative to 2017–18 likely explains why different results were observed in the 2 years of this study. In 2017, the percent coverage and average deposit size were both reduced adjacent to cereal rye rows relative to the other positions. Cereal rye may have intercepted larger deposits adjacent to the cereal rye row in this year, whereas lower cover crop biomass in 2017–18 reduced this potential. However, a similar number of deposits were observed across the positions, so it is also possible that differences in percent coverage are solely due to smaller deposit size, though it is unclear why the number of deposits would be similar across positions. The average size of deposits reaching the WSP immediately adjacent to cereal rye rows was smaller than in other positions, suggesting that larger deposits may have been more susceptible to interception, or may have been broken up by the cereal rye canopy. Winter weeds in 2016–17 also may have broken up larger deposits, resulting in smaller average deposit size in spring 2017 where no saflufenacil was applied the previous fall. Further study with nozzle types that create a wider spectrum of droplet sizes may help determine the mechanisms behind the observed differences.
Variability in percent coverage, number of deposits, and deposit size, measured by the CV between grids on an individual WSP, differed among WSP position in 2017 but not with fall saflufenacil application (Table 3). In 2018, only one significant interaction between the two factors was noted on the CV of deposit number (Table 3). The CV of percent coverage between the six individual grid squares on WSP adjacent to cereal rye rows in 2017 (40.0%) was over twice that of the WSPs located between the rye rows (18.5%) and without a cereal rye cover crop (13.7%; Figure 3A). The CV for the number of deposits in 2017 was also greater adjacent to cereal rye rows (21.7%) compared with the other two positions (11.9% and 10.9% for between rye rows and no cover crop, respectively; Figure 3B). Lastly, there was more variability in deposit size adjacent to the rye rows (36.5%) relative to between rye rows (23.0%) or with no cover crop (18.2%; Figure 3C). In 2018, a significant interaction between position and fall herbicide application was noted for CV of the number of deposits (Table 3); however, no differences in this CV were detected based on position (p = 0.436 and p = 0.127 with and without the fall saflufenacil application, respectively; average response shown in Figure 3B). For WSP adjacent to the cereal rye rows, there was a lower CV for the number of deposits where there was a fall saflufenacil application (9.3%) compared with where this herbicide was not applied (15.5%; data not shown). Given that the fall herbicide application was so effective in reducing winter weed biomass in the cover crop in this year (see above), this reduction in variability adjacent to cover crop rows is not surprising because less weed biomass in plots with the cereal rye cover crop would lead to more even coverage. Why this would only manifest in the number of deposits and not in percent coverage or deposit size is unclear. No differences in the CV of percent coverage nor deposit size CV were noted in 2018 (Table 3; Figure 3).
Table 3. Results (p values) from analysis of variance on the coefficient of variation of the percent coverage, number of deposits, and average deposit size between six individual grid squares per WSP in 2017 and 2018. a
a Abbreviations: WSP, water-sensitive paper.

Figure 3. Coefficient of Variation (CV) of spray coverage (A), number of deposits (B), and average deposit size (C) measured across six grid squares on individual water-sensitive paper located in different field positions. Within each year, letters denote significant differences in CV between positions at α = 0.05.
More variability in deposition parameters in spring 2017 in the area immediately adjacent to the cereal rye rows is likely also a result of the higher cover crop biomass in this year. Larger plants may have intercepted more of the droplets and created more disruption of the deposit state of fall, leading to greater variability in remaining deposit size. Variability dependent on the fall herbicide application was noted only in spring 2018, when this application was more effective in controlling winter weed biomass.
Practical Implications
Results demonstrate that percent coverage of an herbicide may be reduced in some areas if it is applied over a standing, live cereal rye cover crop. Deposit size distribution may also be altered, with a reduction in the average deposit size reaching the soil surface. However, overwintering cover crops can also reduce weed density, so reduction in coverage and changes to deposit size distribution may not result in overall reduced weed control. Of additional importance, however, is that a standing cover crop may increase variability in coverage. The vigor of the cover crop stand can affect total coverage and variability of coverage, as we detected fewer differences in a year when less cover crop biomass was produced. Cover crops may also reduce the weed size through competition for light and other resources. Therefore, more variable coverage, particularly immediately adjacent to cover crop rows where competitive effects may lead to even smaller weeds, may lead to poorer control.
Further study of the dynamics of this system should be conducted to determine the potential for standing cover crops to intercept herbicides that can be used to target horseweed seedlings growing at the soil surface; for example, determining how large the “zone of influence” of the cover crop row is; how cover crop biomass, height, and plant architecture influence the potential for interception and variability in coverage; and what the influence of nozzle selection and other application technology is. As cover crops continue to be part of integrated weed management, with increased biomass needed for provisioning of other ecosystem services, such answers will continue to improve their weed-suppressive capacity.
Acknowledgements
The Kentucky Soybean Promotion Board provided funding for this experiment. The authors acknowledge the assistance of Matthew Allen, Sara Carter, and Nick Fleitz, as well as personnel at the University of Kentucky C. Oran Little Research Center. Dr. Travis Legleiter provided insight into the analysis of variability, and thoughtful comments on the manuscript. No conflicts of interest have been declared.