Introduction
Organic farmers typically rely on tillage as their primary form of weed control, but the detrimental impact of excessive tillage on soils has spurred interest in adapting reduced-tillage strategies for organic production (Brainard et al. Reference Brainard, Haramoto, Williams and Mirsky2013; Carr et al. Reference Carr, Anderson, Lawley, Miller and Zwinger2012). Both deep primary tillage and shallower mechanical cultivation are effective methods of nonchemically terminating weeds by burying or uprooting through soil inversion or cutting weeds at the soil surface (Bond and Grundy Reference Bond and Grundy2001). However, this frequent and intense soil disturbance can result in oxidation and depletion of soil organic matter, loss of soil structure, increased susceptibility to soil erosion, and soil compaction due to recurrent traffic (Lal Reference Lal1991). Additionally, the time, labor, and fuel required for mechanical weed control is a significant contributor to total production costs in organic cropping systems (Archer et al. Reference Archer, Jaradat, Johnson, Weyers, Gesch, Forcella and Kludze2007). For example, compared with conventional production, time spent hand weeding was almost double in organic fresh market tomato (Solanum lycopersicum L.) production (Hillger et al. Reference Hillger, Weller, Maynard and Gibson2006), and on-farm fuel costs were almost double in organic soybean [Glycine max (L.) Merr.] production (McBride and Greene Reference McBride and Greene2009). Therefore, identifying weed management strategies that rely less on tillage could alleviate the negative effect that tillage has on soil quality, while also reducing the number of cultivation passes or time spent hand weeding.
Preventive and cultural weed management strategies that act to decrease weed emergence and increase crop competitiveness must be integrated into organic systems for reduced tillage to be a viable option (Barberi Reference Barberi2002; Brainard et al. Reference Brainard, Haramoto, Williams and Mirsky2013; Mirsky et al. Reference Mirsky, Ryan, Teasdale, Curran, Reberg-Horton, Spargo, Wells, Keene and Moyer2013). Surveys of organic growers in Michigan demonstrate that they are well aware of soil-related benefits of reducing tillage but are hesitant to adopt reduced-tillage practices, in large part due to concerns that weed management will become a greater challenge (Lowry and Brainard Reference Lowry and Brainard2017a). Two cultural strategies that may increase crop competitiveness and reduce weed management costs are use of cover crop mulches and targeted placement of nutrient amendments.
Cover crop residue used as mulch can substantially reduce weed emergence and competition through a variety of chemical, biological, and physical mechanisms. For example, allelochemicals released from rye and vetch decomposition have been shown to suppress emergence and growth of weeds (Barnes and Putnam Reference Barnes and Putnam1986; Creamer et al. Reference Creamer, Bennett, Stinner, Cardina and Regnier1996; Hill et al. Reference Hill, Ngouajio and Nair2006). The cool and moist environment underneath rye residue may lead to shifts in insect and pathogen communities involved in weed seed predation and decay that reduce seedbanks (Chauhan et al. Reference Chauhan, Gill and Preston2006; Menalled et al. Reference Menalled, Smith, Dauer and Fox2007; Pullaro et al. Reference Pullaro, Marino, Jackson, Harrison and Keinath2006), although the evidence for significant reductions through these mechanisms is mixed (Quinn et al. Reference Quinn, Brainard and Szendrei2016). When used as a mulch, rye residue can decrease and delay weed germination by reducing soil temperatures, light, and soil nitrogen (N) (Mohler and Teasdale Reference Mohler and Teasdale1993). Additionally, if sufficient residue is retained on the soil surface, rye mulches can reduce survival of germinated seedlings by forcing small-seeded weeds to exhaust seed reserves before penetrating the mulch layer (Teasdale and Mohler Reference Teasdale and Mohler2000). However, in addition to suppressing weeds, cereal rye (Secale cereale L.) may inhibit establishment and growth of the subsequent crop by immobilizing soil N and decreasing soil temperatures (Hill et al. Reference Hill, Renner and Sprague2016; Teasdale and Mohler Reference Teasdale and Mohler1993).
Targeting fertilizer placement to the crop rooting zone is another potentially valuable approach for increasing crop competitiveness against weeds (Blackshaw et al. Reference Blackshaw, Molnar and Janzen2004; Di Tomaso Reference Di Tomaso1995). Placing nutrients in close proximity to crop roots increases crop N uptake (Blackshaw et al. Reference Blackshaw, Semach and Janzen2002) and reduces the energy expended by the crop for nutrient scavenging, allowing for greater resources to be devoted toward aboveground productivity and yield (Maddux et al. Reference Maddux, Raczkowski, Kissel and Barnes1991; Shipley and Meziane Reference Shipley and Meziane2002). For example, banding N within the crop row increased wheat yields under weedy conditions by as much as 12% compared with fertilizer applied broadcast (Kirkland and Beckie Reference Kirkland and Beckie1998). Additionally, germination and emergence of seeds of many weed species, such as common lambsquarters (Chenopodium album L.), giant foxtail (Setaria faberi Herrm.), and Powell amaranth (Amaranthus powellii S. Watson), are stimulated by nitrogenous compounds within the soil (Brainard et al. Reference Brainard, DiTommaso and Mohler2006; Sweeney et al. Reference Sweeney, Renner, Laboski and Davis2008). Increasing N taken up by the crop or isolating N from the weed seed or root zone reduces N available to stimulate weed emergence and competition (Di Tomaso Reference Di Tomaso1995). Subsurface banding or point-injecting N fertilizer significantly reduced weed density, biomass, and N uptake of both wild oat (Avena fatua L.) and green foxtail [Setaria viridis (L.) P. Beauv.] (Blackshaw et al. Reference Blackshaw, Molnar and Janzen2004). Many common agricultural weeds are luxurious consumers of N, but also highly vulnerable to N deficiency (Harbur and Owen Reference Harbur and Owen2004). Finally, establishment of an early size differential between crops and weeds is also critical for ensuring efficacy and selectivity of mechanical cultivation tools (Gallandt et al. Reference Gallandt, Brainard and Brown2018; Kurstjens et al. Reference Kurstjens, Perdok and Goense2000; Mohler Reference Mohler2001); therefore, targeted placement of N to crop roots may not only enhance competitiveness of crops against weeds, but also improve the effectiveness of subsequent physical weed control tools that are especially critical for successful organic production.
While banding of conventional fertilizers has been shown to enhance crop competitiveness against weeds (Anderson Reference Anderson2008; Blackshaw et al. Reference Blackshaw, Molnar and Janzen2004), little work has been done to apply the same principle to organic forms of N. Strip intercropping of functionally diverse cover crops, such as cereal rye and hairy vetch (Vicia villosa Roth), is one mechanism by which N banding can be applied to an organic system (Lowry and Brainard Reference Lowry and Brainard2017b). Rye and vetch cover crops are often planted together in full-width mixtures (either randomly distributed by broadcasting or drilled together in rows) in organic production systems. In contrast, with strip intercropping, rye and vetch planting is segregated into functionally distinct high-N (vetch) and low-N (rye) zones. Hairy vetch, a legume, is sown in a strip directly in row (IR) with future crop establishment and provides N directly to the crop. Simultaneously, cereal rye is planted between crop rows, where it may immobilize N available to competing weeds. Removing or reducing the amount of rye residue within the crop row can minimize or eliminate any negative effects on crop establishment that are associated with cereal rye (Raimbult et al. Reference Raimbult, Vyn and Tollenaar1991).
Previous work has shown that strip intercropping of rye–vetch mixtures is enhanced when used in combination with strip tillage (Lowry and Brainard Reference Lowry and Brainard2017b). Strip tillage uses a combination of narrowly placed disks and rotary baskets (often attached to a shank) to confine tillage to a narrow strip within the crop row while leaving the zone between crop rows untilled (Luna and Staben Reference Luna and Staben2002). When strip tillage is combined with strip intercropping of rye and vetch, the vetch residue concentrated within the crop row gets tilled into the soil and may result in faster mineralization of vetch residue and greater nutrient availability to the crop (Lowry and Brainard Reference Lowry and Brainard2017b), while also reducing the potential for cereal rye to suppress crop growth. The cereal rye in the between-row (BR) zone will be left on the soil surface as mulch to suppress weeds.
The goal of this study was to evaluate whether strip intercropping of cereal rye and hairy vetch could decrease weed biomass and increase sweet corn (Zea mays L.) competitiveness against weeds within an organic strip-tillage system. We hypothesized that: (1) the strip intercropping of rye and vetch would decrease weed biomass and increase sweet corn yield under low weed management; and (2) increasing the proportion of vetch within rye–vetch mixture biomass incorporated into the future crop row (and the proportion of rye in rye–vetch mulch between crop rows) would increase sweet corn competitiveness against weeds by concentrating soil inorganic N within the crop row. Finally, we also evaluated the effects that the quantity of rye–vetch mixture biomass had on sweet corn competitiveness against weeds.
Materials and Methods
Site Description and Experimental Design
The experiment was conducted between 2011 and 2013 on two separate organically managed (approximately 5 to 7 yr, depending on year) fields with Kalamazoo (fine-loamy, mixed, semi-active, mesic Typic Hapludalfs) and Oshtemo (coarse-loamy, mixed, mesic Typic Hapludalfs) loams (Crum and Collins Reference Crum and Collins1995), at the Kellogg Biological Station in Hickory Corners, MI (42.4°N, 85.4°W). Treatments were arranged in a split-plot, randomized complete block design with four replicates. Main plots consisted of rye–vetch mixture spatial arrangement, which included two levels: a full-width mixture (MIX), in which rye and vetch were sown together in the same rows, and a segregated mixture (SEG), in which 2 rows of hairy vetch were alternated with 2 rows of rye. The split-plot factor consisted of three subplots: (1) high weed management, (2) low weed management, and (3) bare soil. High weed management treatments were intended to be weed-free and maintained by hoeing and hand weeding weekly until mid-July and every 2 wk thereafter. Low weed management treatments were intended to have a relatively high level of weed competition and were therefore only weeded twice throughout the sweet corn season via hoeing and hand weeding (see Table 1 for weeding dates). To alleviate variation in the ambient weed community in low weed management treatments, we distributed 3.0 g m−2 (approximately 8,500 seeds m−2) of stratified C. album seeds in 2012, and 1.8 g m−2 (approximately 3,180 seeds m−2) in 2013. All weed data, as well as sweet corn yield and biomass, were measured from low weed management subplots. We compared yield from high weed management subplots to that of low weed management subplots to evaluate the effect that weed competition had on sweet corn yields. No other data presented herein were collected from high weed management subplots. Bare-soil treatments contained rye–vetch cover crops planted the previous fall but were kept free of sweet corn and weeds throughout the sweet corn season by hand weeding and hoeing. Only soil N data are presented from the bare-soil subplots, which enabled us to observe patterns in soil inorganic N due solely to rye–vetch mixture spatial arrangement without N uptake by sweet corn or weeds. IR and BR zones within the cropping system were also treated as subplots. The IR zone was defined as the 25-cm strip where strip tillage occurred and where the sweet corn crop was planted; within the SEG rye–vetch spatial arrangements, it is the zone in which vetch was planted. The BR zone was defined as the 50-cm untilled zone between crop rows; within the SEG rye–vetch spatial arrangements, it is the zone in which rye was planted.
Table 1 Table of activities and operations.

High weed management subplot sizes were 27.3 (9.1 by 3.0 m) and 37.2 m2 (6.1 by 6.1 m) in 2012 and 2013, respectively; low weed management subplot sizes were 18.3 (6.1 by 3.0 m) and 28.06 m2 (6.1 by 4.6 m) in 2012 and 2013, respectively; and bare-soil subplots were 9.0 m2 (3.0 by 3.0 m) in both 2012 and 2013. Plot sizes were adjusted each year based on availability of organically certified land and size of available equipment. Larger plots were used for high weed management subplots to accommodate more frequent and intense sampling used for other questions associated with the study (Lowry Reference Lowry2015; Lowry and Brainard Reference Lowry and Brainard2016, Reference Lowry and Brainard2017b).
Cover and Cash Crop Management
Field activities were performed according to Table 1. Both cereal rye and hairy vetch seeds were “variety not stated” and organically certified across both years. When considered on a whole-plot (WP) basis, the cover crop spatial arrangement treatments had the same seeding rate for both cereal rye (62.72 kg ha−1) and hairy vetch (22.4 kg ha−1) but differed in seed placement. For the SEG spatial arrangement, vetch seeds were concentrated in the IR zone, and rye seeds were concentrated in the BR zone, resulting in seeding rates in those zones that were double that of the MIX spatial arrangement. In both rye and vetch spatial arrangements, BR spacing for rye and vetch rows was 19.1 cm. Cereal rye was planted with a grain drill, and every two drop tubes were blocked within SEG mixtures to prevent seeding rye in the vetch rows. Hairy vetch was planted with a Jang push-seeder (Jang Clean Seeder, Jang Automation, Chungcheongbuk-do, South Korea) at the designated rates and rows. No N fertilizers were added before cover crop establishment or sweet corn planting. Additional organic forms of phosphorus and potassium were added according to soil tests and consisted of: 34 kg K and P ha−1 of National Organic Program–certified potassium sulfate plus and Tennessee brown phosphate in 2012 and 34 kg K ha−1 of potassium sulfate plus in 2013.
Cover crops were flail mowed twice in mid- to late May, by which time vetch had reached approximately 50% flowering in 2012, and 30% flowering in 2013 . We used a two-row strip tiller (Hiniker Model 6000, Mankato, MN) equipped with cutting coulter, shank point assembly, berming disks, and rolling basket for tillage within the crop row, resulting in a tilled IR zone that was approximately 25-cm wide and 25- to 30-cm deep. To improve soil tilth for planting, a walk-behind rototiller was used for IR secondary tillage. Sweet corn (variety ‘Luscious’) was planted using a high-residue planter (Monosem vacuum seeder, Monosem, Edwardsville, KS) at a BR spacing of 76.2 cm and IR spacing of 11 cm. Once sweet corn emerged, population density was thinned to approximately 5 plants m−1 row (or 66,000 plants ha−1, which is consistent with seed company recommendations for organic sweet corn). Sweet corn was irrigated during low-rainfall periods in 2012, totaling 62.2 mm of irrigated water throughout the sweet corn season. In 2013, rainfall was sufficient, so we did not provide any additional irrigation.
Cover Crop, Weed, and Corn Biomass
Dry weights of cover crop and winter annual weed biomass were obtained before cover crop termination by clipping shoot tissue at ground level from two 0.25-m2 quadrats for each IR and BR area in every plot. Fresh cover crop biomass was separated into hairy vetch, rye, and weeds, dried at 60 C, and weighed. To determine the biomass of rye and vetch across the WP, rye and vetch biomass within the IR and BR zones was weighted by the relative area of the zone. To calculate the degree by which strip intercropping resulted in segregation of rye and vetch into distinct zones, we calculated:
 $$\eqalign { {\rm Vetch}_{{{\rm IR}}} {\rm \,\colon\,RyeVetch}_{{{\rm IR}}} \,{\rm ratio}\cr {\equals}{\rm Vetch}_{{{\rm IR}}} \,{\rm biomass/ }\left( {{\rm Rye}_{{{\rm IR}}} \,{\rm biomass{\plus}Vetch}_{{{\rm IR}}} \,{\rm biomass}} \right)$$
 $$\eqalign { {\rm Rye}_{{{\rm BR}}} {\rm \,\colon\,RyeVetch}_{{{\rm BR}}} \,{\rm ratio}\cr {\equals}{\rm Rye}_{{{\rm BR}}} \,{\rm biomass/(Rye}_{{{\rm BR}}} \,{\rm biomass{\plus}Vetch}_{{{\rm BR}}} \,{\rm biomass)}$$
where VetchIR is the shoot dry weight of hairy vetch collected from the IR zone; RyeVetchIR is the sum of rye and vetch shoot dry weight collected from the IR zone; RyeBR is the shoot dry weight of cereal rye collected from the BR zone; and RyeVetchBR is the sum of rye and vetch shoot dry weight collected from the BR zone.
Sweet corn aboveground biomass was measured on five random corn plants per plot at two time points throughout the season: early biomass was harvested when corn plants were between the V7 to V8 stage (36 d after planting [DAP] in 2012, and 45 DAP in 2013) and again at harvest. We selected the V7 to V8 stage for early biomass collection, because it is shortly after corn has initiated exponential growth and N uptake, when corn would therefore be likely to exhibit early signs of stress from N deficiency or weed competition. Sweet corn was harvested from 9.3 and 6.5 m2 in high and low weed management subplots in 2012, respectively; and from 14 m2 in both high and low weed management subplots in 2013. Sweet corn ears were separated into nonmarketable and marketable based on the circumference of the thickest portion of the ear; marketable ears had a circumference greater than 13 cm. Sweet corn early biomass, corn ear, and final shoot (stalk plus tassel and leaves) biomass samples were dried at 60 C and weighed, then ground to pass through a 1-mm screen. A Kjehldahl digest (Kalra 1998) was performed on 0.15-g samples of sweet corn biomass (2 lab replicates per sample) and analyzed for total Kjeldahl N with a QuikChem® 8500 flow injection analyzer. We multiplied the concentration of Kjeldahl N in corn plant tissue (mg N/kg biomass) by the aboveground corn biomass (Mg ha−1) to calculate the total Kjeldahl N within corn biomass on a per area basis (kg N ha−1).
Summer annual weed biomass was collected within the low weed management subplot before the two weeding events that occurred during sweet corn growth (in which we eliminated all standing weed biomass through a combination of hand weeding and hoeing) and then again at harvest. Weeds in two 0.25-m2 quadrats per IR and BR were collected, dried at 60 C, and weighed. To calculate the weed biomass across the WP, we calculated a weighted mean of the measured weed biomass dry weights from the IR and BR zones adjusted by their respective areas, so that:
 $$\eqalign { {\rm Weed}_{{{\rm WP}}} \,{\rm biomass}\cr {\equals} \left( {{\rm Weed}_{{{\rm IR}}} \,{\rm biomass{\asterisk}1/3}} \right){\rm {\plus}}\left( {{\rm Weed}_{{{\rm BR}}} \,{\rm biomass{\asterisk}2/3}} \right)$$
In 2012, we separated weed biomass into C.album (which was overseeded) and all other weeds. Due to a large infestation of grasses and clover (Trifolium spp.) in 2013, we separated weed biomass into C. album, clover, grasses, and all other broadleaf species. We classified early weed biomass as the sum of the collected weed biomass from the first two harvest time points, because they most closely matched the time period of early sweet corn growth (27 and 48 DAP in 2012; 25 and 48 DAP in 2013), while total-season weed biomass is the sum of early weed biomass and weed biomass collected at harvest. As a metric of sweet corn competitiveness against ambient weeds and overseeded C.album, we calculated:
 $$\eqalign { {\rm Early}\,{\rm sweet}\,{\rm corn}\,{\rm competitiveness}\cr {\equals}{\rm Early}\,{\rm sweet}\,{\rm corn}\,{\rm biomass/Early}\,{\rm weed}_{{{\rm WP}}} \,{\rm biomass}$$
 $$\eqalign{ {\rm Total}\,{\rm sweet}\,{\rm corn}\,{\rm competitiveness}\cr {\equals}{\rm Final}\,{\rm sweet}\,{\rm corn}\,{\rm biomass/Total}\,{\rm weed}_{{{\rm WP}}} \,{\rm biomass}$$
Soil Inorganic N
Soil samples were collected every 7 to 14 d (8 sampling times yr−1), throughout the growing season in both the IR and BR zones of bare-soil subplots. At each sampling date, 8 to 10 soil cores (5-cm diameter and 20-cm deep) were taken within each zone and plot. Soil samples were dried at 38 C and ground. A 1 M KCl extraction (Gelderman and Beegle Reference Gelderman and Beegle1998) was performed, and samples were analyzed on a QuikChem® 8500 flow injection analyzer. To convert soil N concentrations to a basis of weight per unit area, we determined soil bulk density on three soil cores (5-cm internal diameter and 24-cm depth) from both the IR (tilled) and BR (untilled) zones per plot. We then multiplied soil N concentration (kg Mg−1) by the product of bulk density (Mg m−1) and depth of sampling (m) to calculate kilograms of N per hectare (kg N ha−1; Ellert and Bettany Reference Ellert and Bettany1995).
Total-season soil inorganic N was calculated by taking the mean across all sampling time points from sweet corn planting to harvest. Early-season soil inorganic N was calculated by taking the mean of soil N across sampling time points from planting to collection of early corn biomass (four time points up until 36 DAP in 2012; five time points up until 45 DAP in 2013). To calculate the soil inorganic N across the WP, we calculated a weighted mean of the soil inorganic N from the IR and BR zones adjusted by their respective areas, so that:
 $$\eqalign { {\rm Soil}\,{\rm inorganic}\,{\rm N}_{{{\rm WP}}} \cr {\equals}{\rm Soil}\,{\rm inorganic}\,{\rm N}_{{{\rm IR}}} {\rm {\asterisk}1/3{\plus}Soil}\,{\rm inorganic}\,{\rm N}_{{{\rm BR}}} {\rm {\asterisk}2/3}$$
where soil inorganic NIR is the quantity of soil inorganic N (kg ha−1) within the IR zone, or the 25-cm zone where the crop is planted (and where tillage occurs within strip tillage); and soil inorganic NBR is the quantity of soil inorganic N (kg ha−1) within the BR zone, the 50-cm zone between crop rows that is also left untilled with strip tillage. To examine whether strip intercropping increased the percent of WP soil inorganic N that is concentrated within the IR we calculated:
 $$\eqalign { {\rm Soil}\,{\rm inorganic}\,{\rm N}_{{{\rm \,\%\,IR}}} {\equals}{\rm Soil}\,{\rm inorganic}\,{\rm N}_{{{\rm IR}}} {\rm /Soil}\,{\rm inorganic}\,{\rm N}_{{{\rm WP}}} {\rm {\asterisk}100}\cr $$
Statistical Analysis
All data were analyzed using linear mixed-model approaches via the lmer function in the ‘lme4’ package in R v. 3.3.2 (R Foundation for Statistical Computing, http://www.r-project.org). All figures were made using the ‘ggplot2’ package in R (Wickham Reference Wickham2009).
For mean comparisons of sweet corn yield, rye–vetch mixture spatial arrangement (MIX vs. SEG) and weed management intensity (high vs. low) were treated as fixed factors. For mean comparisons of weed biomass, IR and BR data were analyzed separately, and rye–vetch spatial arrangement was treated as a fixed factor. In both cases, year and the interaction of year with other fixed factors were treated as fixed effects, and if there was no interaction with year, years were pooled. In all cases, the interaction of block and year was treated as a random factor.
To examine the relationship between cover crop biomass and composition with soil inorganic N%IR, sweet corn and weed biomass, and sweet corn competitiveness, we evaluated three candidate mixed-model regressions. In all models, the interaction of block and year was treated as a random factor. We first evaluated a full model that included the following combinations of fixed factors: X+Year+Year*X; where X is equal to either VetchIR:RyeVetchIR ratio, RyeBR:RyeVetchBR ratio, vetchWP, ryeWP, or total rye–vetchWP cover crop biomass. If the interaction of X*Year was not significant, then we evaluated the reduced model of X+Year. Likewise, if Year was not significant, then we evaluated the effect of X alone. Models were compared for corrected Akaike information criterion, and the final model used for each analysis is listed in Table 2.
Table 2 Summary of selected linear mixed models used for analysis in Figures 3, 4, 5, and 6, along with model R2 and significance of fixed effects.

a To increase normality, early and final corn competitiveness was square-root transformed, total weedWP biomass was log-transformed (only for model with vetchWP), and total weedIR biomass was square-root transformed. Early corn competitiveness was calculated as the ratio of early corn:early weed biomass, and final sweet corn competitiveness was calculated as the ratio of final corn:total weed biomass.
b VetchIR:RyeVetchIR indicates proportion of IR cover crop biomass that is vetch.
c Final model selection was determined by first analyzing full model (X+ Year+X*Year), and if the interaction between X*Year was found to be nonsignificant, the interaction was dropped from the model. Then the reduced model (X+Year) was evaluated for the effect of Year, and if Year was found to be nonsignificant, then Year was dropped from the model, resulting in the simplest model (X).
d NS, not significant, P>0.1.
Results and Discussion
Cover Crop Biomass and Winter Annual Weeds
Detailed information on the effects of spatial arrangement on rye and vetch biomass is provided in Lowry and Brainard (Reference Lowry and Brainard2016). In brief, strip intercropping of rye–vetch mixtures increased vetch and decreased rye shoot biomass in the IR zone compared with the MIX in both 2012 and 2013, and marginally increased rye biomass within the BR (Table 3). Across both years, we found approximately 73% of vetch shoot biomass was concentrated within the IR of SEG treatments. Segregating rye and vetch into strips decreased total rye–vetch mixture shoot biomass in 2012 but had no effect on total shoot biomass in 2013. In 2012, there was some lodging of the rye and vetch in May before biomass collection and flail mowing. This resulted in greater mixing of the rye and vetch cover crops in the SEG treatments than anticipated. However, despite the cover crop lodging and potential residue mixing from flail mowing, segregating rye and vetch into strips lowered the C:N ratios of both shoot and root biomass (thus increasing the potential for N mineralization) within the crop row compared with the standard MIX spatial arrangement (Lowry and Brainard Reference Lowry and Brainard2016). Finally, strip intercropping of rye and vetch resulted in marginally lower winter annual weed biomass within the BR when analyzed across both years but had no effect on weed biomass within the IR zone. Dominant species in 2012 included common chickweed [Stellaria media (L.) Vill.] and corn chamomile (Anthemis arvensis L.). Dominant species in 2013 included red clover (Trifolium pratense L.), A. arvensis, and S. media.
Table 3 Mean (SEM) biomass of cereal rye, hairy vetch, and total rye and vetch cover crop biomass, as well as winter annual weed biomass in 2012 and 2013. Treatment comparisons include biomass collected across the whole plot (WP) of the mixed (MIX) rye-vetch spatial arrangement, and within the in-row (IR) and between-row (BR) zones of the segregated (SEG) rye-vetch spatial arrangements. IR and BR SEG zones were separately compared to the MIX spatial arrangement.

a NS indicates not significant, P>0.1
Summer Annual Weeds and Sweet Corn Yield
Mean comparisons of the effects of rye–vetch mixture spatial arrangements on summer annual weed biomass and sweet corn yield and biomass showed minor differences. The SEG spatial arrangement decreased IR summer annual weed biomass compared with MIX in 2012 (Figure 1; P=0.03). However, we found no effect of rye–vetch mixture spatial arrangement on summer annual weed biomass within the IR of 2013 or in the BR of 2012 or 2013. Weed biomass and composition differed substantially between the two years of this study. In 2012, the year with higher cover crop biomass, we found substantial suppression of summer annual weed biomass within the untilled BR zone where the residue was used as mulch, but not in the tilled IR zone where the residue was incorporated. Potentially, this suppression of BR weed biomass in 2012 may have increased resources available to stimulate growth of IR weeds. In 2013, T. pratense became established within the rye–vetch mixture in early spring and survived in the BR despite mowing that occurred to terminate rye and vetch. A larger ambient T. pratense seedbank, coupled with relatively low cover crop biomass in 2013 compared with 2012 likely explains the difference in weed biomass between the two years.

Figure 1 Mean (±SEM) cumulative weed biomass in low weed management subplots in both 2012 and 2013. Weed biomass was summed across weed harvests at two time points during sweet corn growth (before each major weeding event) and at sweet corn harvest. Weed biomass comparisons include mixed (MIX) and segregated (SEG) rye–vetch spatial arrangement. Weed biomass was collected both between (BR) and within (IR) crop rows.
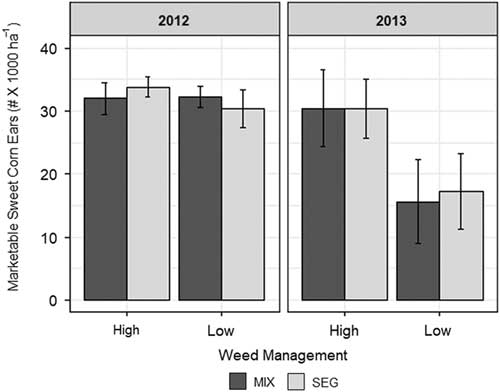
We anticipated that sweet corn yields under low weed management would be higher within the SEG treatment compared with MIX. However, the mean yield of sweet corn was similar within the MIX and SEG rye–vetch spatial arrangement regardless of weed management (high or low) in both 2012 and 2013 (Figure 2). Interestingly, we found no difference in sweet corn yield between high and low weed management in 2012, the year with higher cover crop biomass and lower weed biomass. This suggests that in 2012, the cover crop residue was sufficient to adequately suppress weeds in both rye–vetch mixture spatial arrangements.

Figure 2 Mean (±SEM) number of marketable sweet corn ears in both 2012 and 2013. Treatment comparisons include mixed (MIX) and segregated (SEG) rye–vetch spatial arrangement and high and low weed management.
One potential explanation for relatively minor effects of rye–vetch mixture spatial arrangement on mean comparisons of sweet corn yield and weed biomass is that aboveground rye and vetch shoots were not as segregated into their zones as we anticipated due to flail mowing and lodging of the rye and vetch in 2012. This is demonstrated by the high variability in the proportion of IR biomass that is vetch (VetchIR:RyeVetchIR ratio; Equation 1) and the proportion of BR biomass that is rye (RyeBR:RyeVetchBR ratio; Equation 2) between our experimental units of the SEG spatial arrangement. For example, in the SEG rye–vetch spatial arrangement, the VetchIR:RyeVetchIR ranged from 0.32 to 0.78 in 2012 and 0.32 to 1.00 in 2013. Ultimately, there were some SEG plots in which the segregation of rye and vetch residue did not differ from the MIX treatment (especially in 2012, the year with rye and vetch lodging). Within the MIX spatial arrangement, the proportion of vetch in the rye–vetch mixture ranged from 28% to 54% in 2012 and 6% to 37% in 2013. While we expected some lateral mixing of rye and vetch, lateral growth of vetch, cover crop lodging (in 2012), and flail-mowing resulted in greater movement of shoot tissue across zones than anticipated. Although root tissue was unlikely to have moved across zones to the same extent, roots are thought to represent only about 18% to 30% of total cover crop tissue for rye–vetch mixtures (Mwaja et al. Reference Mwaja, Masiunas and Weston1995).
Rye and Vetch IR Composition Affects Early Sweet Corn Competitiveness
We used regression analysis to explore how the variability in the composition of rye and vetch residues within the cover crop mixture in the IR and BR zones influenced sweet corn and weed biomass, as well as sweet corn competitiveness against weeds. We found greater early sweet corn competitiveness with increasing VetchIR:RyeVetchIR ratio (Figure 3E; Table 2). This increase reflects greater responsiveness of sweet corn to VetchIR:RyeVetchIR ratio (Figure 3A; Table 2) compared with weeds (Figure 3C; Table 2). In particular, each 1% increase in the percentage of VetchIR:RyeVetchIR ratio was associated with an increase of approximately 8.80 kg ha−1 in early sweet corn biomass. In contrast, no association between VetchIR:RyeVetchIR ratio and weed biomass was detected.

Figure 3 Relationships between the VetchIR:RyeVetchIR ratio and early-season soil inorganic N%IR compared with (A and B) early corn biomass collected at 36 and 45 d after planting (DAP) in 2012 and 2013, respectively; (C and D) early weed whole-plot (WP) biomass collected at 48 DAP in 2012 and 45 DAP in 2013; and (E and F) early sweet corn competitiveness against weeds (measured as the ratio of early corn biomass:early weedWP biomass). All corn and weed data were collected from low weed management subplots. Early sweet corn competitiveness was square-root transformed to increase normality. Rye and vetch spatial arrangement treatments include mixed (MIX) and segregated (SEG) in both 2012 (blue) and 2013 (red); treatment symbols are shown on figure. Regression lines show the predictions of linear mixed models examining the slope of X (VetchIR:RyeVetchIR ratio or soil inorganic N%IR), and in all figures there was no effect of year or an interaction with year and X. The selected models with parameters are specified in Table 2. Equations for regression lines are: (A) y=0.6+0.88x; (B) y=−0.92+0.05x; (E) y=3.3+6.6x; and (F) y=−4.1+0.27x. NS, not significant at P>0.1.
To gain insight into whether the effect of VetchIR:RyeVetchIR ratio on early sweet corn competitiveness was mediated by soil N, we determined whether (1) VetchIR:RyeVetchIR ratio was positively associated with soil inorganic N concentrated within the crop row (soil inorganic N%IR, see Equation 7); (2) greater soil inorganic N%IR was positively associated with competitiveness of the sweet corn crop against weeds; and (3) VetchIR:RyeVetchIR ratio was positively associated with N taken up within early sweet corn biomass. As hypothesized, VetchIR:RyeVetchIR ratio was positively associated with both soil inorganic N%IR and soil inorganic NIR early in the sweet corn season (Figure 4A and B; Table 2). Additionally, we found a positive trend between early soil inorganic N%IR with early sweet corn biomass and competitiveness against weeds, although this effect had marginal significance (P=0.07 and P=0.06, respectively; Figure 3B and F; Table 2). Finally, increasing VetchIR:RyeVetchIR ratio was positively associated with greater total Kjeldahl N accumulated in early sweet corn biomass (Figure 4C). Therefore, we conclude that greater sweet corn access to soil N was one factor that accounted for the effect of VetchIR:RyeVetchIR on early sweet corn biomass and competitiveness. However, we cannot distinguish in this study whether the effects of VetchIR:RyeVetchIR ratio on soil N and sweet corn competitiveness resulted from increasing N mineralization of vetch residue or from decreasing N immobilization by rye residues.

Figure 4 Relationships between the proportion of IR cover crop biomass that is vetch (VetchIR:RyeVetchIR) and (A) percent of early-season soil inorganic N that is concentrated within the IR zone (Soil inorganic N%IR); (B) mean early-season soil inorganic N within the IR zone (Soil inorganic NIR); and C) Kjeldahl N accumulated within aboveground early sweet corn biomass. Soil inorganic N data for the response variables in both A and B were collected from bare-soil subplots. “Early-season” is defined as roughly the time period between planting of sweet corn until it reached V7–V8 (36 d after planting [DAP] in 2012; 45 DAP in 2013). Rye and vetch spatial arrangement treatments include mixed (MIX) and segregated (SEG) in both 2012 (dashed) and 2013 (dotted); treatment symbols are shown on figure. Regression lines from years pooled are solid. Regression lines show the predictions of linear mixed models examining the slope of VetchIR:RyeVetchIR (X) ratio, the intercept of Year, and the slope for the interaction of X*Year. The selected models with parameters are specified in Table 2. Equations for regression lines are: (A) 2012: y=30.5+11x; 2013: y=35.6+11x; (B) 2012: y=21.5+6.2x; 2013: y=12.4+6.2x; and (C) y=14.4+17.7x.
One explanation for greater response of sweet corn to VetchIR:RyeVetchIR ratio and soil inorganic N%IR compared with weeds is that sweet corn more rapidly acquired early mineralized N released from vetch. Corn is a relatively large-seeded crop with a high relative growth rate that allows corn plants to rapidly establish their root systems and scavenge soil resources (Harbur and Owen Reference Harbur and Owen2006). In comparison, most weed species are small-seeded (Seibert and Pearce Reference Seibert and Pearce1993), and despite having a high relative growth rate, their small seed size puts them at a considerable initial disadvantage because of lower energy reserves to devote toward root proliferation.
Although positive, the association between the VetchIR:RyeVetchIR ratio and both soil inorganic N%IR and NIR was relatively weak (Figure 4A and B; Table 2). For example, in 2013, as the VetchIR:RyeVetchIR ratio increased from 0.06 to 1.0, early soil inorganic N%IR only increased from 37% to 50%. Similarly, a greater than 10-fold increase in vetch IR biomass in 2013 only resulted in an increase of 11 kg ha-1 in early soil inorganic NIR. This is likely because (1) a substantial portion of soil inorganic NIR came from mineralized soil organic matter and not solely from the decomposing rye–vetch residue, and (2) soil inorganic N may have moved between the IR and BR zones. Interestingly, while we found large differences between years in soil inorganic NIR, we found no difference between years in the soil inorganic N%IR, suggesting that this response is more resilient to annual fluctuations in temperature and precipitation. For example, growing degree day accumulation was 17% greater during sweet corn growth in 2012 compared with 2013 (see Lowry and Brainard [Reference Lowry and Brainard2017b] for details).
Alternative mechanisms by which VetchIR:RyeVetchIR ratio may have favored early sweet corn over weeds include allelopathy, fungal pathogens, and nematodes, all of which may selectively impact emergence and growth of plants. For example, allelopathic compounds released from both rye and vetch residues are thought to suppress weed seedling germination and emergence (Barnes and Putnam Reference Barnes and Putnam1986; Creamer et al. Reference Creamer, Bennett, Stinner, Cardina and Regnier1996; Hill et al. Reference Hill, Ngouajio and Nair2006). Vetch is also a well-known host of plant parasitic nematodes (Timper et al. Reference Timper, Davis and Tillman2006) that negatively impact broadleaf species relative to grasses. Although we found no effect of VetchIR:RyeVetchIR ratio on emergence of two weed species: C. album and S. faberi (unpublished data), we cannot rule out the possibility that one or more of these diverse mechanisms may have impacted the emergence of other weed species or the relative growth of sweet corn and weeds following emergence. Additionally, cereal rye has been shown to have negative effects on corn growth by harboring pests (Dunbar et al. Reference Dunbar, O’Neal and Gassmann2016) and immobilizing soil N (Kuo and Sainju Reference Kuo and Sainju1998). Decreasing the proportion of IR biomass that is rye likely reduced any potential negative effects of cereal rye on sweet corn emergence and early growth.
Surprisingly, the proportion of rye within rye–vetch BR biomass (RyeBR:RyeVetchBR ratio) was not associated with early corn biomass or competitiveness in either year (Supplementary Figure 1). In fact, in 2013, we found a positive association between early weedwp biomass and the RyeBR:RyeVetchBR ratio (P=0.03). Increasing rye residues may have increased weed growth by increasing soil moisture. Alternatively, the observed positive association may not have been causal. For example, pockets of greater soil fertility across the experimental area may have supported both greater rye biomass and greater weed biomass.
Rye and Vetch Biomass Effects on Final Sweet Corn Competitiveness
The effects of VetchIR:RyeVetchIR on sweet corn biomass and competitiveness did not persist to the end of the sweet corn season. In fact, we found no effect of VetchIR:RyeVetchIR on final-season sweet corn biomass, total-season weedWP biomass, and final sweet corn competitiveness (Supplementary Figure 2). Instead, final sweet corn and total weed biomass were positively associated with WP cover crop biomass rather than cover crop residue zonal composition. For example, greater vetchWP, ryeWP, and total rye–vetchWP biomass were associated with greater final sweet corn biomass (Figure 5A–C; Table 2). VetchWP biomass had a stronger positive association with sweet corn biomass in 2013 compared with 2012, perhaps because N was lower in 2013 (Figure 4B). Final sweet corn biomass consisted of both the corn ear and the rest of the shoot biomass. When we examined the relationship between vetchWP, ryeWP, and total rye–vetchWP biomass with sweet corn yield, we found trend increases similar to those seen for total sweet corn biomass (unpublished data).

Figure 5 Relationship between vetch, rye, and total rye–vetch biomass across the whole plot (WP) compared with (A–C) final sweet corn aboveground biomass, which includes both the corn ear and the rest of the shoot biomass; (D–F) total weedWP biomass summed over three time points throughout the sweet corn season; and (G–I) sweet corn competitiveness against weeds (measured as the ratio of final corn biomass:total weed biomass). All sweet corn and weed data were collected from low weed management subplots. To increase normality, total weed biomass was log-transformed (only for model with vetchWP), and sweet corn competitiveness was square-root transformed for analyses. Rye and vetch spatial arrangement treatments include mixed (MIX) and segregated (SEG) in both 2012 (dashed) and 2013 (dotted); treatment symbols are shown on figure. Regression lines from years pooled are solid. Regression lines show the predictions of linear mixed models examining the slope of cover crop biomass (X), the intercept of Year, and the slope for the interaction of X*Year. The selected models with parameters are specified in Table 2. Equations for regression lines are: (A) y=3.5+0.72x; (B) y=3.5+0.35x; (C) y=2.8+0.34x; (D) 2012: y=0.29+0.46x; (F) 2012: y=−0.52+0.27x; (G) 2012: y=81 − 14.5x; 2013 y=9.5+2.7x; and (I) 2013: y=6.8+1.2x. NS, not significant at P>0.1.
Compared with sweet corn, weed biomass varied more in its response to vetch cover crop biomass. In 2012 (the year with greater levels of soil inorganic N; Figure 4B) greater vetchWP biomass was associated with greater total-season weedWP biomass (Figure 5D; Table 2), corresponding to a decrease in corn competitiveness against weeds (Figure 5G; Table 2). In contrast, in 2013 (the year with lower levels of soil inorganic N), greater vetchWP biomass was not associated with greater weed biomass, and thus sweet corn competitiveness against weeds was increased (Figure 5G; Table 2). These findings are consistent with other studies that found that weed competitors greatly benefit from excess available N within the soil (Harbur and Owen Reference Harbur and Owen2004; Wortman et al. Reference Wortman, Davis, Schutte and Lindquist2011).
Contrary to expectations, we found no relationship between total ryeWP biomass and weedWP biomass or sweet corn competitiveness against weeds in either year (Figure 5E and H; Table 2). Greater total rye–vetchWP biomass was associated with greater subsequent weedWP biomass in both years (Figure 5F; Table 2) due mostly to greater summer annual weedIR biomass (Figure 6A; Table 2). Incorporated cover crop residues in the tilled IR zone may have stimulated weed emergence and growth by increasing soil moisture and nutrients (Lowry Reference Lowry2015). Surprisingly, we found no relationship between total rye–vetchBR biomass and summer annual weedBR biomass (Figure 6B; Table 2). This result is inconsistent with many previous studies in which greater cover crop biomass used as mulch resulted in greater weed suppression (Mohler and Teasdale Reference Mohler and Teasdale1993). Because total rye–vetchWP biomass in our study was positively associated with both sweet corn and weed biomass, we found only a small and inconsistent association between rye–vetch biomass and sweet corn competitiveness against weeds.

Figure 6 Relationship between (A) total rye–vetch biomass and total weed biomass collected within the in-row (IR) zone and (B) total rye–vetch biomass and total weed biomass collected within the between-row (BR) zone. All sweet corn and weed data were collected from low weed management subplots, and both the IR and BR total weed biomass is the sum of three harvest time points throughout the sweet corn season. To increase normality, weed biomass was square-root transformed. Rye and vetch spatial arrangement treatments include mixed (MIX) and segregated (SEG) in both 2012 and 2013; treatment symbols are shown on figure. The regression line is for both years pooled, and shows the predictions of linear mixed models examining the slope of total rye–vetch biomass within each zone (X), the intercept of Year, and the slope for the interaction of X*Year. The selected models with parameters are specified in Table 2. Equation for the regression line is: (A) y=0.05+0.38x. NS, not significant at P>0.05.
In summary, our results suggest that segregated plantings of rye–vetch mixtures may result in greater concentration of N within the crop row, thereby increasing early crop competitiveness against weeds. However, the effects of VetchIR:RyeVetchIR on sweet corn competitiveness did not persist throughout the sweet corn growing season. It is not surprising that late-season crop responses were less sensitive to N enhancement within the crop row compared with early-season responses, given that as corn roots grow, they are able to forage N within the BR zone (Lowry and Brainard Reference Lowry and Brainard2017b). Therefore, final sweet corn biomass and competitiveness was more responsive to the quantity of vetch biomass across the WP compared with the zonal composition of rye–vetch residues. Lack of persistent effects of VetchIR:RyeVetchIR on sweet corn competitiveness may also be explained in part by two in-season weed management events that eliminated differences in late weed growth across treatments. If weeds had not been removed, we may have seen persistent differences throughout the season.
Previous studies have shown that increasing crop early vigor can greatly enhance competitiveness against weeds (Mhlanga et al. Reference Mhlanga, Chauhan and Thierfelder2016) and enhance efficacy and selectivity of mechanical cultivation (Gallandt et al. Reference Gallandt, Brainard and Brown2018; Kurstjens et al. Reference Kurstjens, Perdok and Goense2000; Mohler Reference Mohler2001). Therefore, the positive association found between VetchIR:RyeVetchIR ratio and early sweet corn competitiveness indicates that strip intercropping rye and vetch may contribute to increased weed suppression by the crop as well as increased efficacy of weed control practices that are particularly critical for successful production of organic crops. This effect was likely partially mediated by concentrating soil inorganic N within the crop row, thus increasing N availability to the crop (Figure 4). These results suggest that the strategic manipulation of soil fertility to enhance crop competitiveness may be a valuable strategy to increase crop productivity and improve weed management within organic reduced-tillage systems.
Overall, strip intercropping of functionally diverse cover crops would benefit from additional research aimed at identifying species combinations, planting patterns, and termination methods to optimize this approach. Several adaptations to strip intercropping might enhance its effectiveness. For example, termination of the cover crop with a roller-crimper (drawn in the same direction as segregated strips) rather than a flail mower would likely minimize lateral movement of shoots, resulting in greater concentration of N-rich vetch residue in the IR zone and greater concentration of rye mulch in the BR zone. This approach could enhance weed suppression, improve N use efficiency, and reduce interference of rye residue with crop establishment. However, roller-crimper use has its drawbacks. Most importantly, roller-crimping is not as effective at fully terminating cover crops as flail mowing (Creamer and Dabney Reference Creamer and Dabney2002) and therefore increases the risk of cover crop regrowth suppressing the cash crop. Plastic tarps placed over cover crops after roller-crimping can effectively terminate a rye–vetch cover crop and could eliminate this regrowth risk within vegetable systems (Lounsbury et al. Reference Lounsbury, Warren, Wolfe and Smith2018) but are not practical in larger agronomic systems. The effectiveness of strip intercropping might also be enhanced through integration of a “cut and carry” system, in which residue is moved from the BR to the IR zone for suppression of IR weeds and to facilitate mechanical cultivation within the BR (Rostampour Reference Rostampour2011).
Supplementary materials
To view supplementary material for this article, please visit https://doi.org/10.1017/wsc.2018.83
Acknowledgments
This research was supported in part through funding from the USDA Sustainable Agriculture Research and Education (SARE) program (project no. GNC10-141), Michigan State University Project GREEEN (project no. GR12-387), the Ceres Trust Organic Research Initiative, and the USDA-OREI program (proposal no. 2014-05381). We also acknowledge the support of USDA National Institute of Food and Agriculture and Michigan State University AgBioResearch. No conflicts of interest have been declared. We thank Corey Noyes, Joe Simmons, Todd Martin, Erin Haramoto, and Zack Hayden for technical advice and assistance. We also thank Alexis Snyder, Heather Eifert, Sam Peck, Nate Robinson, Frank Horton, Hannah Gray, and Max Kokmeyer for assistance with data collection and field maintenance. Finally, we thank Mathieu Ngouajio, Alexandra Kravchenko, and G. Phil Robertson for guidance.