


Introduction
A significant increase in sweetpotato [Ipomoea batatas (L.) Lam.] production area in the southeastern United States has occurred in the past decade, increasing from 33,548 ha in 2007 to 51,800 ha in 2017 (USDA-NASS 2017). Sweetpotato has proven to be a valuable crop with a national farm gate value of $705.7 million in 2016, up from $298.4 million in 2006 (USDA-NASS 2017). North Carolina is the largest sweetpotato-producing state, accounting for 54% of U.S. production (USDA-NASS 2017). North Carolina, California, Mississippi, and Louisiana account for 94% of sweetpotato production in the United States (USDA-NASS 2017). Unfortunately, due to its prostrate growth habit and relatively slow growth, sweetpotato does not compete well with problematic weeds, resulting in reduced yields (Meyers et al. Reference Meyers, Jennings, Schultheis and Monks2010; Seem et al. Reference Seem, Creamer and Monks2003). Palmer amaranth (Amaranthus palmeri S. Watson) and large crabgrass [Digitaria sanguinalis (L.) Scop.] are among the top five most common weeds in North Carolina sweetpotato, with A. palmeri being identified as the most troublesome weed (Webster Reference Webster2010). Amaranthus palmeri has been reported to be taller, to have a faster growth rate and greater leaf area, and to produce more overall biomass when compared with other Amaranthus species (Horak and Loughin Reference Horak and Loughin2000). Season-long A. palmeri interference is seen in vegetable crops, with reduced yield of 94% in bell pepper (Capsicum annum L.) (Norsworthy et al. Reference Norsworthy, Oliveira, Jha, Malik, Buckelew, Jennings and Monks2008), 67% in tomato (Solanum lycopersicum L.) (Garvey et al. Reference Garvey, Meyers, Monks and Coble2013), 36% to 81% in sweetpotato (Meyers et al. Reference Meyers, Jennings, Schultheis and Monks2010), with the greater yield losses associated with higher A. palmeri densities.
Limited herbicide options exist for use in sweetpotato (Kemble Reference Kemble2017). Growers rely on PRE herbicides, which do not always provide efficacious weed control and require rainfall for activation. POST herbicide options for A. palmeri control in sweetpotato are limited to between-row applications of carfentrazone or glyphosate (Kemble Reference Kemble2017). The lack of POST herbicides forces growers to use tillage for control of weeds until row closure, at which time growers have no additional control options for dicotyledonous weeds other than mowing weeds above the crop canopy and hand weeding, which is a costly control measure (KM Jennings, personal communication).
Digitaria sanguinalis is commonly found in fruit and vegetable crops (Webster Reference Webster2010) but has not been highly ranked as a problematic weed due to efficacious POST herbicides such as clethodim, fluazifop, or sethoxydim (Kemble Reference Kemble2017). Although these graminicides can be effective, grasses escaping herbicide application or sprayed after substantial establishment may continue to compete with the crop and reduce yields. Furthermore, herbicide resistance management for D. sanguinalis should be considered, as resistance to acetyl-CoA carboxylase herbicides, including those registered for use in sweetpotato has been reported (Heap Reference Heap2018; Hidayat and Preston Reference Hidayat and Preston1997; Laforest et al. Reference Laforest, Soufiane, Simard, Obeid, Page and Nurse2017; Volenberg and Stoltenberg Reference Volenberg and Stoltenberg2002). While its impact on sweetpotato has not been reported, season-long, D. sanguinalis reduced yield in bell pepper by 46% (Norsworthy et al. Reference Norsworthy, Oliveira, Jha, Malik, Buckelew, Jennings and Monks2008), snap bean (Phaseolus vulgaris L.) by 47% to 50% (Aguyoh and Masiunas Reference Aguyoh and Masiunas2003), and watermelon [Citrullus lanatus (Thunb.) Matsum. & Nakai] by 82% (Monks and Schultheis Reference Monks and Schultheis1998).
A better understanding of the interactions of A. palmeri and D. sanguinalis with sweetpotato would allow for better decision making regarding their control. Thus, the objectives of this study were to determine (1) the effect of five densities of A. palmeri and D. sanguinalis on sweetpotato biomass and storage root yield and quality, (2) the intraspecific response of A. palmeri and D. sanguinalis across five densities with and without sweetpotato, and (3) the effect of sweetpotato on growth of A. palmeri and D. sanguinalis.
Materials and Methods
Field studies were conducted with ‘Covington’ sweetpotato at the Horticultural Crops Research Station near Clinton, NC (35.1°N, 81.16°W) on a Norfolk loamy sand (fine-loamy, kaolinitic, thermic Typic Kandiudults) with humic matter 0.31% and pH 5.9 in 2016 and an Orangeburg loamy sand (fine-loamy, kaolinitic, thermic Typic Kandiudults) with humic matter 0.47% and pH 5.9 in 2017. Nonrooted ‘Covington’ sweetpotato 20- to 30-cm-long cuttings were mechanically planted approximately 7.6-cm deep into ridged rows 1 m apart in the entire study at an in-row spacing of approximately 30 cm on June 9, 2016, and June 12, 2017. At 1 d after transplanting, sweetpotato plants were removed by hand in the no-sweetpotato treatments. On the same day, treatment rows assigned A. palmeri or D. sanguinalis were broadcast seeded on the soil surface and lightly raked to a depth of approximately 1.0 cm. After weed seeding, the entire study was irrigated with 1.3 cm of water using overhead irrigation to aid in weed seed establishment. No additional irrigation was applied, in either year, after the initial irrigation event. Treatments consisted of a single weed species (A. palmeri or D. sanguinalis) at five weed densities grown with and without sweetpotato arranged in a randomized complete block design with three replications (Supplementary Figures S1 and S2). Amaranthus palmeri and D. sanguinalis were hand thinned to treatment densities of 0 (weed-free), 1, 2, 4, and 8 and 0 (weed-free), 1, 2, 4, and 16 plants m−1 of row, respectively, when A. palmeri was approximately 8 cm tall, and D. sanguinalis had two expanded leaves. At the time of weed thinning, sweetpotato averaged one to two newly expanded leaves on each plant. Densities of A. palmeri and D. sanguinalis were based on those used in previous research (Aguyoh and Masiunas Reference Aguyoh and Masiunas2003; Bensch et al. Reference Bensch, Horak and Peterson2003; Fu and Ashley Reference Fu and Ashley2006; Meyers et al. Reference Meyers, Jennings, Schultheis and Monks2010). Plots consisted of two bedded rows, each 1-m wide by 5-m long, with the first row being a weed-free buffer row planted to sweetpotato and the second row a treatment row. Treatment rows were maintained at specific weed treatment densities, and border rows were maintained free of weeds season-long by weekly removal by hand. Cultural practices for conventional sweetpotato production in North Carolina were followed (Kemble Reference Kemble2017). Season-long rainfall and growing degree-day data are presented in Table 1.
Table 1. Monthly rainfall (mm) and growing degree days (GDD; base 10 C) at Horticultural Crops Research Station, Clinton, NC, from May to September 2016 and 2017.a

a Nonrooted cuttings were planted on June 9, 2016, and June 12, 2017, and harvested on September 30, 2016, and September 27, 2017. Data were collected from an on-site weather station.
b Rainfall totals do not include 13 mm of irrigation applied at 1 d after planting, after which no additional irrigation was applied.
Two days before sweetpotato harvest, 5 sweetpotato plants and 5 plants of each weed species were randomly harvested at the soil level from each plot to determine aboveground biomass. Samples were placed in 2-ply paper yard waste bags measuring 40 by 30 by 89 cm and fresh biomass was recorded. Samples were then placed in a propane-heated, forced-air drier for 96 h at 80 C. Once dry, samples were removed and weighed immediately to determine dry biomass. To determine fresh and dry sweetpotato and weed biomass on a per plant basis, total sweetpotato or weed biomass within a treatment and replication was divided by the number of plants harvested. To determine dry biomass per meter of row, individual weed biomass was multiplied by sweetpotato plant and/or weed number in 1 m of row, respectively.
Sweetpotato storage roots were harvested at 113 d after transplanting (DAT) in 2016 and at 107 DAT in 2017. In both years storage roots were harvested with a tractor-mounted two-row chain digger and hand sorted into jumbo (≥8.9 cm in diameter), no. 1 (≥4.4 cm but <8.9 cm), and canner (≥2.5 but <4.4 cm) grades (USDA 2005) and weighed. Total marketable yield was calculated as the sum of jumbo and no. 1 grades.
Data for crop biomass, individual weed biomass, weed biomass per meter of row, yield, and quality were subjected to ANOVA using PROC MIXED in SAS (SAS v. 9.4, SAS Institute, Cary, NC). Treatment, year, and treatment by year were considered fixed effects, while replication within year was treated as a random effect. Year was treated as a fixed effect to further evaluate components of the year by treatment interaction, such as year by weed density and year by crop presence or absence. If the treatment by year interaction was not significant, a contrast statement was used to test for a linear trend for dependent variables (averaged over year) with increasing weed density, calculated separately for each weed species. All response variables, except canner yield, were square-root transformed to reduce both data skewness and variance heterogeneity before carrying out the mixed model ANOVA. Least-squares means for these response variables are reported without the applied transformations and separated according to Tukey’s HSD (P ≤ 0.05). Mean percent reduction in sweetpotato no. 1, jumbo, and marketable yield due to weed density was calculated for each weed species using treatment differences of least-squared means and modeled using a single rectangular hyperbola function, as described by Cousins (Reference Cousins1985), for each weed species using Equation 1:
 $${Y_R} = {{(ID)} \over {1 + ({{ID} \over A})}}$$
where YR is the yield loss due to weed competition density, I is the percent yield loss as a function of weed density as weed density approaches zero, D is weed density, and A is the percent yield loss as weed density approaches infinity. Yield loss for weed-free plots was considered to be zero, because yield loss estimates were calculated based on the yield of the weed-free plots. SAS PROC NLIN was used to fit the rectangular hyperbola to means of percent yield reduction for each weed species.
Weed biomass per meter of row and individual weed dry biomass were log transformed and then subjected to ANOVA using PROC GLM. If ANOVA indicated significant effects (α ≤ 0.05) of weed density and crop versus no crop, linear or nonlinear regression analysis was performed as follows: for each weed species in the presence of sweetpotato, weed biomass per meter of row and individual weed biomass were regressed against weed density and fit to a linear model in Equation 2:
 $$Y = {Y_0} + {\rm{ax}}$$
where Y is the estimated biomass per meter of row, y 0 is the y-intercept, a is the slope for the predicted values of weed biomass per meter of row, and x is weed density. Individual weed biomass in the absence of a crop fit a linear-plateau model (Equation 3) and was regressed against weed density, which is composed of two functions: the first describes the linear increase or decrease of weed biomass at lower weed densities, and the second describes the plateau of weed biomass at high weed densities, as described by Schabenberger and Pierce (Reference Schabenberger and Pierce2002):
 $$Y = \left\{ {\matrix{ {\hskip-0.5pc{y_0} + \,ax\,{\rm{if}}\,x\, \lt \,\,{x_0}} \cr {{y_0} + \,a{x_0}\,{\rm{if}}\,x\, \ge \,{x_0}} \cr } } \right.$$
where y 0 is the y-intercept of the initial segmented line, a is the slope of the line, and x 0 is the weed density at which the two functions join. Y values for x less than x 0 fit the linear function, while Y values for x greater than or equal to x 0 are constant. Due to the limited number of weed densities established in this study, the linear-plateau model provides an informative approximation for individual weed biomass response as weed density increases (Byrd and Coble Reference Byrd and Coble1991; Rodgers et al. Reference Rodgers, Murray, Verhalen and Claypool1996).
Results and Discussion
Interspecific Interference
Marketable yield decreased as the density of A. palmeri or D. sanguinalis increased. No treatment by year interaction for sweetpotato yield was observed (P = 0.12); therefore, data were combined over years. Marketable yield loss associated with A. palmeri density ranged from 50% with 1 A. palmeri plant m−1 of row to 79% with 8 plants m−1 of row, respectively, when compared with the weed-free check (Figure 1A). Marketable yield reduction by D. sanguinalis was similar to marketable yield reduction caused by A. palmeri but at higher weed densities. Marketable yield was reduced by 35% and 76% with 1 and 16 D. sanguinalis plants m−1 of row, respectively (Figure 2A). Loss of jumbo yield is a significant contributor to overall marketable yield loss at weed densities as low as 1 plant of either species m−1. Jumbo grade had greater yield loss with 1 plant m−1 for A. palmeri (73%) and D. sanguinalis (75%) (Figures 1B and 2B) than the no. 1 grade for both weed species (35% for A. palmeri and 19% for D. sanguinalis) at the same density (Figures 1C and 2C).
Figure 1. ‘Covington’ sweetpotato yield loss as a percent of the weed-free treatment yield as a function of increasing Amaranthus palmeri density per meter of row. Sweetpotato were grown at the Horticultural Crops Research Station Clinton, NC, in 2016 and 2017. Marketable yield values are calculated by summing no. 1 and jumbo grades, and values are averaged over 2016 and 2017. Bars represent standard error of the mean at each measured density. Data were fit to a rectangular hyperbola model with equation: YR = (ID)/[1 + (ID/A)], where YR is the marketable yield reduction due to weed competition density, I is the percent yield loss as a function of weed density as weed density approaches zero, D is defined by weed density, and A is the percent yield loss as weed density approaches infinity. Equation parameters for the data are given with standard errors in parentheses after each value. When the sweetpotato crop was present, (A) I = 119.4(38.96), A = 86.93 (7.745), R2 = 0.93 for marketable yield; (B) I = 255.60(94.91), A = 102.70(6.74), R2 = 0.95 for jumbo yield; (C) I = 70.75(45.47), A = 77.81(17.94), R2 = 0.71 for no. 1 yield.

Figure 2. ‘Covington’ sweetpotato yield loss as a percent of the weed-free treatment yield as a function of increasing Digitaria sanguinalis density per meter of row. Sweetpotato were grown at the Horticultural Crops Research Station Clinton, NC, in 2016 and 2017. Marketable yield values are calculated by summing no. 1 and jumbo grades, and values are averaged over 2016 and 2017. Bars represent standard error of the mean at each measured density. Data were fit to a rectangular hyperbola model with equation: YR = (ID)/[1 + (ID/A)], where YR is the yield reduction due to weed competition density, I is the percent yield loss as a function of weed density as weed density approaches zero, D is defined by weed density, and A is the percent yield loss as weed density approaches infinity. Equation parameters for the data are given with standard errors in parentheses after each value. When the sweetpotato crop was present, (A) I = 61.07(15.33), A = 83.01 (7.611), R2 = 0.92 for marketable yield; (B) I = 318.10(241.3), A = 91.45(9.20), R2 = 0.87 for jumbo yield; (C) I = 29.17(18.44), A = 71.08(21.33), R2 = 0.59 for no. 1 yield.
Results for estimated marketable yield loss per weed as weed density approaches zero (parameter I) for A. palmeri and D. sanguinalis were 119% and 61%, respectively. The higher estimated marketable yield loss as weed density approaches zero for A. palmeri relative to D. sanguinalis indicated higher competitive capacity of A. palmeri at low densities. These results for A. palmeri are consistent with another study in sweetpotato (Meyers et al. Reference Meyers, Jennings, Schultheis and Monks2010) but higher than in soybean [Glycine max (L.) Merr.] (Bensch et al. Reference Bensch, Horak and Peterson2003), peanut (Arachis hypogaea L.) (Burke et al. Reference Burke, Schroeder and Thomas2007), and corn (Zea mays L.) (Massinga et al. Reference Massinga, Currie, Horak and Boyer2001). Estimated yield loss as weed density approaches zero in the present study indicates that A. palmeri and D. sanguinalis, even at low densities, can greatly reduce sweetpotato marketable yield. The initial yield loss as weed density approaches zero for D. sanguinalis was less than A. palmeri at lower densities. However, sweetpotato yield loss from interference byD. sanguinalis was higher than yield loss reported in snap bean (Aguyoh and Masiunas Reference Aguyoh and Masiunas2003). For parameter A, the asymptote of the regression model estimating the maximum yield loss due to weed density was 87% for A. palmeri and 83% for D. sanguinalis. Meyers et al. (Reference Meyers, Jennings, Schultheis and Monks2010) estimated a maximum marketable yield loss of 90% at A. palmeri densities of 6.5 plants m−1 of sweetpotato row. Findings from our study further support the findings of Meyers et al. (Reference Meyers, Jennings, Schultheis and Monks2010), who also reported the highly competitive nature of A. palmeri with sweetpotato. To reduce interference of A. palmeri and D. sanguinalis, which are commonly reported in sweetpotato, growers should use a combination of efficacious PRE herbicides, as outlined by Meyers et al. (Reference Meyers, Jennings and Monks2013), in combination with tillage, hand removal, and mowing (A. palmeri only). Although POST herbicides for A. palmeri are limited, POST herbicide options for selective grass control in sweetpotato are available (Kemble Reference Kemble2017) and should be used when D. sanguinalis is less than 10 cm to minimize yield loss. If D. sanguinalis resistance is suspected, then alternative methods should be analyzed for control. Growers should not dismiss the impact of either weed, as a single A. palmeri or D. sanguinalis per meter of row reduced marketable yield by 50% and 35%, respectively (Figures 1 and 2).
Reduction in marketable yield loss was due to a decrease in weight of no. 1 and jumbo sweetpotato grades. Amaranthus palmeri decreased the yield of no. 1 and jumbo grades at all densities greater than 1 plant m−1 row when compared with weed-free sweetpotato yields (Figure 3). Similarly, D. sanguinalis at 1 plant m−1 row decreased the weight of sweetpotato jumbo grade when compared with the weed-free check (Figure 4). Digitaria sanguinalis densities greater than 2 plants m−1 row decreased no. 1 grade sweetpotato yield relative to the weed-free check, with 16 plants m−1 causing the greatest loss of no. 1 and jumbo grades. Yield for the canner grade was not affected by any density of either weed. These findings further demonstrate the negative impact of A. palmeri and D. sanguinalis on sweetpotato yields at low weed densities.
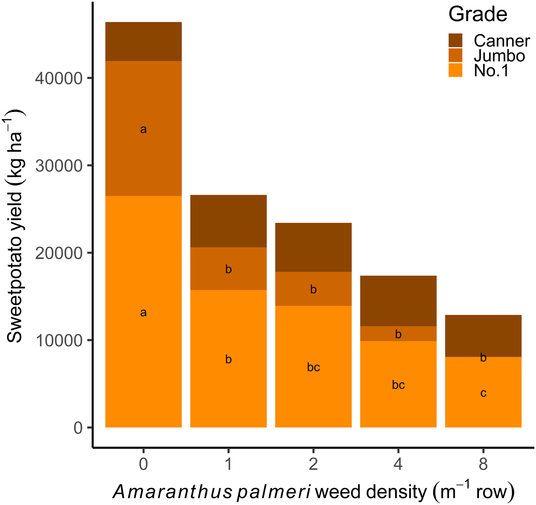
Figure 3. Effect of Amaranthus palmeri density on ‘Covington’ sweetpotato yield (kg ha−1) by grade. Sweetpotato were grown at the Horticultural Crops Research Station Clinton, NC, in 2016 and 2017. Within each grade, bars with the same letter are not different according to Tukey’s HSD (P ≤ 0.05).
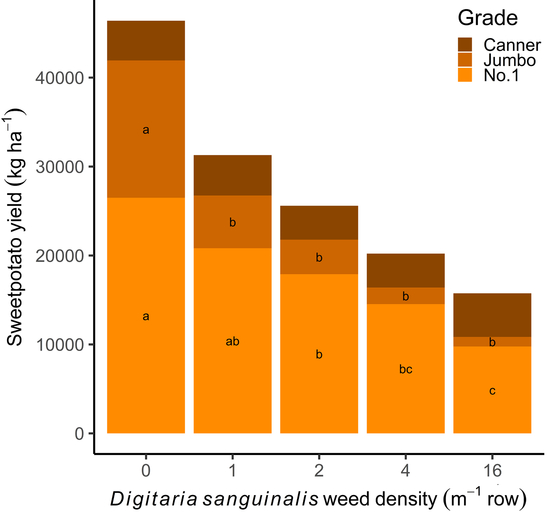
Figure 4. Effect of Digitaria sanguinalis density on ‘Covington’ sweetpotato yield (kg ha−1) by grade. Sweetpotato were grown at the Horticultural Crops Research Station Clinton, NC, in 2016 and 2017. Within each grade, bars with the same letter are not different according to Tukey’s HSD (P ≤ 0.05).
Interspecific competition is also reflected in biomass reduction of one or both plant species competing with each other (Aguyoh and Masiunas Reference Aguyoh and Masiunas2003; Webster and Grey Reference Webster and Grey2015) Interactions between year, crop versus no crop, and weed density were not significant (P ≥ 0.05); therefore, means pooled over years were obtained for density and crop versus no crop combinations for each weed species. Biomass per meter of row of A. palmeri and D. sanguinalis increased with increasing weed density (Figures 5 and 6). The presence of sweetpotato reduced overall biomass per meter of row for both weed species at densities of 1, 2, and 4 plants m−1 row. Furthermore, sweetpotato reduced the rate of bioaccumulation for D. sanguinalis, as can be seen when comparing the slopes of biomass accumulation of both weeds (Figures 5 and 6). We believe that this was an effect of weed height, as A. palmeri quickly establishes and reduces the light reaching the sweetpotato canopy, whereas D. sanguinalis does not exceed the sweetpotato canopy height as quickly as A. palmeri and is therefore less competitive with sweetpotato for light. The impact of A. palmeri on light interception with the sweetpotato canopy has been documented by others (Meyers et al. Reference Meyers, Jennings, Schultheis and Monks2010). Individual weed biomass of A. palmeri and D. sanguinalis was similar across weed densities when grown with sweetpotato (Figures 7 and 8). Individual weed biomass for A. palmeri and D. sanguinalis, however, was lower for all weed densities when grown in the presence of sweetpotato compared with weeds grown without sweetpotato. The reduced individual biomass and biomass per meter of row for both weeds, when grown with sweetpotato, indicate that interspecific interference is occurring between sweetpotato and weeds. Crop biomass reductions are generally associated with increased weed competition and yield losses (Aguyoh and Masiunas Reference Aguyoh and Masiunas2003; Norsworthy et al. Reference Norsworthy, Oliveira, Jha, Malik, Buckelew, Jennings and Monks2008). However, in this study, although weed biomass was lower when grown with sweetpotato, increased weed density did not reduce sweetpotato biomass, despite the reduction in sweetpotato yield at the same densities.

Figure 5. Amaranthus palmeri dry biomass per meter of row (kg m−1 row) as a function of increasing A. palmeri density per meter of row in the presence or absence of conventionally grown ‘Covington’ sweetpotato. Studies were conducted at the Horticultural Crops Research Station, Clinton, NC, in 2016 and 2017. Dry biomass per meter of row for mean values, with bars representing standard error of the mean, over 2016 and 2017 for crop presence and absence were fit to a linear model with the equation: y = y 0+ax. Equation parameters for the data are given with standard errors in parentheses after each value. When the sweetpotato crop was present, y 0 = 0.161(0.123), a = 0.101(0.0266), R2 = 0.88. When crop was absent, y 0 = 0.545(0.146), a = 0.115(0.0317), R2 = 0.87.

Figure 6. Digitaria sanguinalis dry biomass per meter of row (kg m−1 row) as a function of increasing D. sanguinalis density per meter of row in the presence or absence of conventionally grown ‘Covington’ sweetpotato. Studies were conducted at the Horticultural Crops Research Station Clinton, NC, in 2016 and 2017. Dry biomass per meter of row for mean values, with bars representing standard error of the mean, over 2016 and 2017 for crop presence and absence were fit to a linear model with the equation: y = y 0+ ax. Equation parameters for the data are given with standard errors in parentheses after each value. When the sweetpotato crop was present, y 0 = 0.0956(0.0621), a = 0.146(0.00747), R2 = 0.99. When crop was absent, y 0 = 0.455(0.176), a = 0.191(0.0212), R2 = 0.97.

Figure 7. Mean Amaranthus palmeri individual dry biomass (kg), with bars representing standard error of the mean, as a function of increasing A. palmeri density per meter of row in the presence or absence of conventionally grown ‘Covington’ sweetpotato. Studies were conducted at the Horticultural Crops Research Station, Clinton, NC, in 2016 and 2017. Equation parameters for the data are given with standard errors in parentheses after each value. Dry biomass per meter of row for mean values averaged over 2016 and 2017 for crop presence was fit to a linear model with equation: y = y 0 + ax, where equation parameters are y 0 = 0.314(0.0713), and a = −0.0217(0.0155). Regression for individual weed biomass in the absence of sweetpotato was fit to a linear-plateau model: Y = y 0 + ax, if x < x 0, and Y = y 0 + ax 0, if x ≥ x 0, where y 0 = 1.268(0.0265), a = −0.328(0.0168), and x 0= 3.00(0.0850), R2 = 0.99.

Figure 8. Mean individual Digitaria sanguinalis dry biomass (kg), with bars representing standard error of the mean, as a function of increasing D. sanguinalis density per meter of row in the presence or absence of conventionally grown ‘Covington’ sweetpotato. Studies were conducted at the Horticultural Crops Research Station, Clinton, NC, in 2016 and 2017. Equation parameters for the data are given with standard errors in parentheses after each value. Dry biomass per meter of row for mean values averaged over 2016 and 2017 for crop presence was fit to a linear model with equation: y = y 0 + ax, where equation parameters are y 0 = 0.26(0.039), and a = −0.0030(0.0047). Regression for individual weed biomass in the absence of sweetpotato was fit to a linear-plateau model: Y = y 0 + ax, if x < x 0, and Y = y 0 + ax 0, if x ≥ x 0, where y 0 = 1.05(0.0256), a = −0.179(0.00966), and x 0 = 4.00(0.1618), R2 = 0.99.
Intraspecific Competition
Individual dry biomass of each weed species growing without sweetpotato decreased as weed density increased (Figures 7 and 8). In the absence of sweetpotato, individual dry biomass of both weeds was fit to a linear-plateau model. Individual weed biomass was greatest for both weeds at the lowest density. Amaranthus palmeri and D. sanguinalis individual plant biomass decreased 71% from 1 (lowest density) to 3 (estimated) plants m−1 of row and 62% from 1 (lowest density) to 4 plants m−1 of row, respectively, and remained unchanged at densities above 4 plants m−1 row for both weeds (Figures 7 and 8). This finding was similar to the trend observed in peanut (Burke et al. Reference Burke, Schroeder and Thomas2007) for A. palmeri. We believe that the reduction in individual weed biomass for A. palmeri and D. sanguinalis at lower weed densities when grown without sweetpotato is due to increasing intraspecific competition as weed density increases. At the higher densities of both weeds, the impact of intraspecific competition has limited effect on further decreasing individual weed biomass. The established threshold is the density at which all weeds achieve maximum accumulated biomass before intraspecific competition begins. Further biomass increases would require densities resulting in weed mortality due to intraspecies competition, and such densities were not evaluated in this study.
This study demonstrates that A. palmeri and D. sanguinalis have the ability to reduce yield at densities as low as 1 to 2 plants m−1 row. Sweetpotato competes with A. palmeri or D. sanguinalis, resulting in reduced weed biomass. This observation suggests that sweetpotato with rapid canopy establishment and dense growth habit may provide additional competition with weeds and reduce yield loss, as proposed by Harrison and Jackson (Reference Harrison and Jackson2010). Future studies should establish critical weed-free periods for these weeds in sweetpotato, investigate competitiveness of resistant weed biotypes with sweetpotato, and determine weed interference with sweetpotato under varying management practices (planting density, irrigation, and crop rotation).
Supplementary materials
To view supplementary material for this article, please visit https://doi.org/10.1017/wsc.2019.16.
Author ORCID
Nicholas T. Basinger, https://orcid.org/0000-0002-7317-5835.
Acknowledgments
Funding for this research was provided by the North Carolina Agricultural Research Services, the North Carolina Cooperative Extension Service, the Department of Horticultural Science, and the North Carolina Department of Agriculture and Consumer Services and is greatly appreciated by the authors. The authors would like to thank the staff at the Horticultural Crops Research Station for management, tillage, and fertilization of the trial, with special thanks to Wesley Hairr, Glen Aman, Dusty Jolly, and Rodney Mozingo. Thanks to Matthew Bertucci, Andrea Genna, Anna Wyngaarden, Rachel Berube, and Lauren Deans for their assistance in plot maintenance and data collection. No conflict of interest has been declared.


