Introduction
Biological invasions cause significant damage to biodiversity and ecosystem function and are considered a major global challenge for the conservation of natural resources and biodiversity (Simberloff et al. Reference Simberloff, Martin, Genovesi, Maris, Wardle, Aronson, Courchamp, Galil, Garcia-Berthou and Pascal2013). The genetic diversity of invasive plant species is one of the major drivers of their colonization success (Sakai et al. Reference Sakai, Allendorf, Holt, Lodge and Weller2001) and has attracted considerable attention (Dlugosch and Parker Reference Dlugosch and Parker2008; Dlugosch et al. Reference Dlugosch, Anderson, Braasch, Cang and Gillette2015; Qiao et al. Reference Qiao, Liu, Zhang, Zhang and Li2019; Smith et al. Reference Smith, Hodkingson, Villellas, Catford and Buckley2020; Vellend and Tomimatsu Reference Vellend and Tomimatsu2010; Ward Reference Ward2006).
Invasive species are predicted to suffer from reductions in genetic diversity during founding events, reducing their adaptive potential (Dlugosch and Parker Reference Dlugosch and Parker2008). However, relevant studies could not show a consistent pattern of bottleneck severity within successful invasions (Bossdorf et al. Reference Bossdorf, Auge, Lafuma, Rogers, Siemann and Prati2005; Dlugosch et al. Reference Dlugosch, Anderson, Braasch, Cang and Gillette2015; Lambrinos Reference Lambrinos2004), and a growing body of research proves that multiple introductions are common among populations of invasive species (Bossdorf et al. Reference Bossdorf, Auge, Lafuma, Rogers, Siemann and Prati2005; Dlugosch et al. Reference Dlugosch, Anderson, Braasch, Cang and Gillette2015; Wang et al. Reference Wang, Chen, Zan, Wang and Su2012; for review, see Dlugosch and Parker Reference Dlugosch and Parker2008). For these multiply introduced species, no genetic bottleneck and isolation by distance can be inferred. Admixture between multiple source populations could benefit invasive populations through heterosis (e.g., Li et al. Reference Li, Stift and van Kleunen2018) and, in the long term, by increasing genetic diversity and thus evolutionary potential, allowing adaptation to new environmental conditions (Li et al. Reference Li, van Kleunen, Li, Liu, Gao, Zhu, Zhao, Zhao and Li2019; Rius and Darling Reference Rius and Darling2014; Schierenbeck and Ellstrand Reference Schierenbeck and Ellstrand2009; Wang et al. Reference Wang, Chen, Zan, Wang and Su2012). Therefore, understanding the genetic variation and structure of invasive plants would help to reveal their invasive origins, dispersal pattern, and evolutionary history (Dlugosch and Parker Reference Dlugosch and Parker2008; Li et al. Reference Li, van Kleunen, Li, Liu, Gao, Zhu, Zhao, Zhao and Li2019).
Mile-a-minute (Mikania micrantha Kunth) is a tropical American herbaceous species that has become a worldwide invasive weed (Bravo-Monzón et al. Reference Bravo-Monzón, González-Rodríguez and Espinosa-García2018; Zhang et al. Reference Zhang, Ye, Cao and Feng2004). It is a multibranched scrambling vine of the family Asteraceae and can reproduce easily through both sexual and vegetative mechanisms. The species is self-incompatible and spreads via wind and insect pollination, producing a large number of small, light seeds (Hong et al. Reference Hong, Shen, Ye, Cao and Wang2007). In the field, it can produce up to 20,535 to 50,297 seeds per plant (Zan et al. Reference Zan, Wang, Wang, Liao and Li2000). Mikania micrantha can also reproduce from stem fragments that root easily at the nodes and from vegetative ramets that arise from rosettes (Zhang et al. Reference Zhang, Ye, Cao and Feng2004). The basic biology, morphology, physiology, general distribution, and ecological niche modeling impacts on other plant communities, as well as natural enemies of M. micrantha, have been studied in detail (Banerjee et al. Reference Banerjee, Mukherjee, Guo, Ng and Huang2019; Zhang et al. Reference Zhang, Ye, Cao and Feng2004).
Various microsatellite markers have been developed for this species (Hong et al. Reference Hong, Niu, Shen, Ye and Cao2010; Yan et al. Reference Yan, Huang, Fang, Lu, Zhou, Ge and Shi2011), and its genetic diversity, structure, and differentiation have been investigated. For example, Wang et al. (Reference Wang, Su and Chen2008) tested the genetic structure of 28 M. micrantha populations collected in Hong Kong, Macao, and Guangdong Province in their introduced range using inter simple sequence repeat (ISSR) markers and found that during M. micrantha invasion, multiple introductions mitigated the loss of genetic variation associated with bottlenecks. Using microsatellite markers, we analyzed 787 samples collected in Guangdong Province, and the population genetics results suggested the importance of highways as corridors for the spread of M. micrantha in southern China (Geng et al. Reference Geng, Chen, Cai, Cao and OuYang2016). However, the sample collection localities were limited to Guangdong Province and nearby Hong Kong and Macao (Wang et al. Reference Wang, Chen, Zan, Wang and Su2012, Reference Wang, Wang, Chen, Wang and Su2016). Despite these few published genetic studies on M. micrantha in China, large-scale studies on the genetic background of M. micrantha in China are still lacking.
In Asia, the earliest record of M. micrantha can be dated to 1884, when it was a cultivated plant in Hong Kong (Wang et al. Reference Wang, Liao, Zan, Li, Zhou and Gao2003). In mainland China, most literature advocated that the oldest record of the species is from 1984 in Yinhu, Shenzhen, Guangdong Province, which is adjacent to Hong Kong (Kong et al. Reference Kong, Wu and Hu2000; Wang et al. Reference Wang, Liao, Zan, Li, Zhou and Gao2003). However, Du et al. (Reference Du, Yang, Li and Yin2006) found that the first invasion of M. micrantha in mainland China was recorded in 1983, based on a collection by Qing Lin in Yingjiang City, Yunnan Province (specimen number 7708052, 1983-10-26). A survey among the older residents of Yunnan Province showed that the emergence of M. micrantha in Ruili City, Delong State, Yunnan Province, dates back to the early 1960s (Du et al. Reference Du, Yang, Li and Yin2006). After that, M. micrantha was introduced into Dehong State, Yunnan Province (Du et al. Reference Du, Yang, Li and Yin2006). Therefore, we hypothesized that the populations from Delong State, Yunnan Province, originated and developed independently. However, the answer remains unclear.
Multiple introductions are inferred among populations of M. micrantha, even though chloroplast simple sequence repeat (cpSSR) marker results indicated the populations were distributed only in Guangdong Province (Wang et al. Reference Wang, Su and Chen2008), while amplified fragment length polymorphism (AFLP) marker data indicated populations were distributed in Guangdong Province, Macao, and Hong Kong (Wang et al. Reference Wang, Chen, Zan, Wang and Su2012). Geng et al. (Reference Geng, Chen, Cai, Cao and OuYang2016) found that the genetic admixtures among the roadside populations imply the occurrence of multiple population introductions during colonization, indicating that the post-introduction admixture happened during the evolution of M. micrantha populations. After its introduction in Guangdong Province, M. micrantha was introduced into Hainan and Guangxi provinces in 2003 and 2008, respectively (Wei et al. Reference Wei, Pan, Tang, Lin and Zhou2014; Yu and Wu Reference Yu and Wu2009), and the known geographic distribution of M. micrantha covered Guangdong, Guangxi, Yunnan, and Hainan provinces. In this study, we sampled four populations of M. micrantha in Dehong State, Yunnan Province, and seven populations in Guangxi, Hainan, and Guangdong provinces. We aimed to determine the multiple introduced populations using microsatellite markers and evaluate the level of genetic admixture among M. micrantha populations covering Yunnan, Guangxi, Guangdong, and Hainan provinces. Our results will provide a scientific basis for the management of invasive M. micrantha.
Materials and Methods
Sample Collection
We collected 427 samples from 11 M. micrantha populations in Yunnan, Guangdong, Guangxi, and Hainan provinces (Figure 1). Basic information and the numbers of collected samples are listed in Supplementary Table S1. Fresh leaf tissue was collected and processed with silica gel as previously described (Geng et al. Reference Geng, Chen, Cai, Cao and OuYang2016).
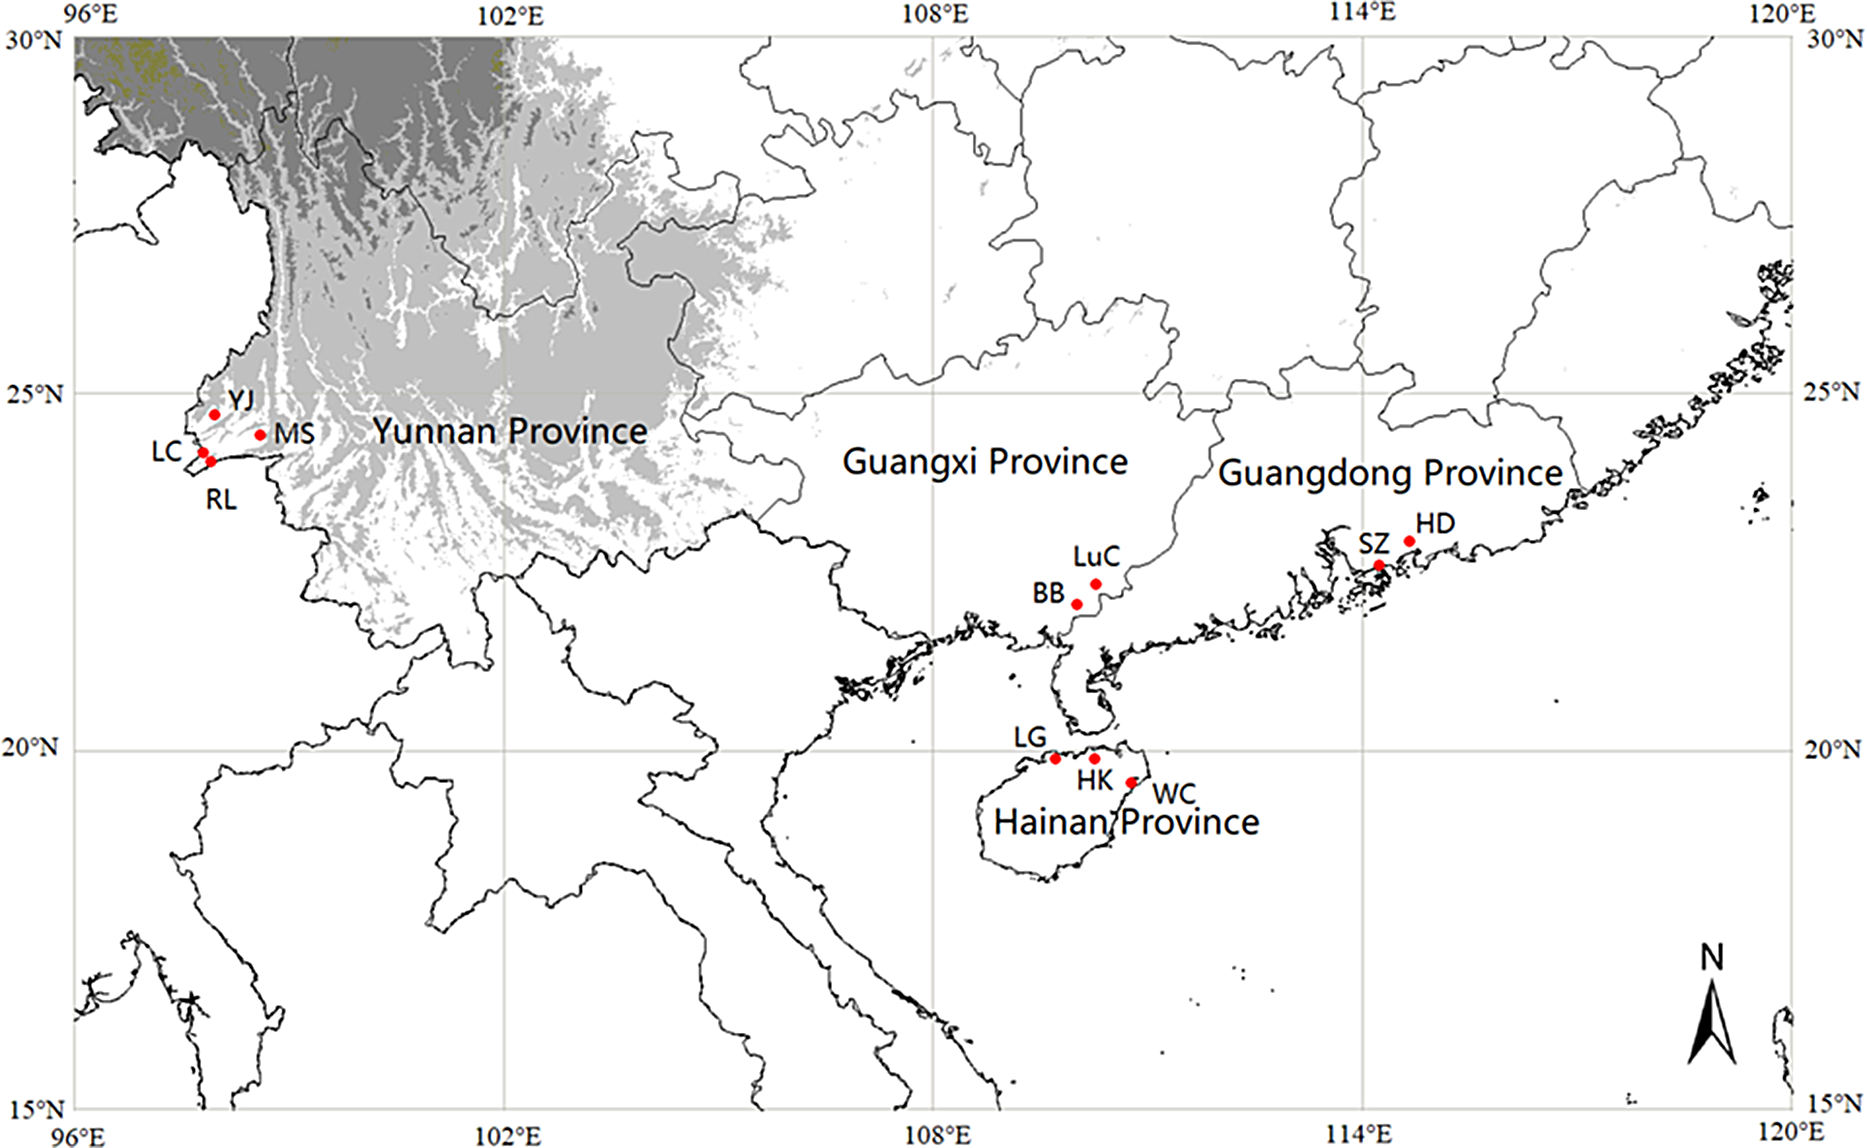
Figure 1. Geographic distribution of the 11 populations of Mikania micrantha sampled in this study. The abbreviations for populations are listed in Supplementary Table S1.
DNA Extraction and Microsatellite Analysis
Total genomic DNA was extracted from the dried tissue following the manufacturer’s instructions for the plant DNA extraction kit (Tsingke Biotech, Beijing, China). The quality of DNA was determined by 0.8% agarose gel electrophoresis, and the DNA was diluted to 10 ng/μl for microsatellite analysis.
Microsatellite markers were developed from the transcriptomic data of M. micrantha by Beijing Qingke Biotechnology Kunming Branch Company (Kunming City, Yunnan Province, China). The polymerase chain reaction (PCR) was performed in a final volume of 15 μl, containing 50 ng of genomic DNA, 1× Tsingke Master Mix (green), and 0.67 μM of each primer. The PCR reactions were performed in an ABI 2720 thermocycler (Applied Biosystems Life Technologies, Carlsbad, CA, USA) with the following cycling conditions: after 5 min at 94 C, 30 cycles were carried out for 30 s at 94 C, 30 s at 60 C, and 30 s at 72 C, with a final extension of 5 min at 72 C. Amplification products were sequenced using an ABI 3730xl DNA sequencer (Applied Biosystems Life Technologies). The band size was calculated using the software Gene Mapper 4.1 after comparison with an ABI GeneScan™ 500 LIZ™ Size Standard (Applied Biosystems Life Technologies). Twelve highly polymorphic nuclear microsatellite loci were chosen for further analysis based on the following criteria: (1) consistent amplification products, (2) reproducible fragments between replicate PCRs, and (3) no amplification in the negative control (Li and Jin Reference Li and Jin2007).
Genetic Diversity Analysis
Based on the microsatellite loci, the number of different alleles (N a), the number of effective alleles (N e), Shannon’s information index (I), and the coefficient (F IS ) were estimated using GenAlEx 6.501 (Peakall and Smouse Reference Peakall and Smouse2012). The polymorphic information content (PIC) was calculated using the Microsatellite Toolkit v. 3.1.1 (Park Reference Park2001). Expected heterozygosity (H e) and observed heterozygosity (H o) were estimated using POPGENE 1.32 (Yeh and Boyle Reference Yeh and Boyle1997).
Population Genetic Structure Based on Microsatellite Loci
Nei’s (Reference Nei1972) genetic distances among populations were calculated using GenAlEx 6.501 (Peakall and Smouse Reference Peakall and Smouse2012). Bootstrapping of the unweighted pair-group method with arithmetic means (UPGMA) tree among populations was performed using PowerMarker v. 3.25 with 1,000 iterations. The bootstrap value was calculated using Phylip 3.68 and MEGA 5.10. The tree was constructed via FigTree v. 1.4.2.
The genetic structure of M. micrantha populations was assessed using Bayesian model–based clustering analysis implemented in STRUCTURE 2.3.3 (Pritchard et al. Reference Pritchard, Stephens and Donnelly2000). The initial range of potential genetic clusters (K) was set from 2 to 20, with 20 independent runs under the admixture model with 200,000 Markov chain Monte Carlo iterations and a 100,000 burn-in period. The most probable number of clusters (K) was selected by calculating an ad hoc statistic ∆K based on comparing the log probability of the data (LnP(D)) for each K value, as described by Evanno et al. (Reference Evanno, Regnaut and Goudet2005), and was implemented in the website program Structure Harvester (Earl and von Holdt Reference Earl and von Holdt2012; http://taylor0.biology.ucla.edu/structureHarvester). The highest ∆K value was selected to determine the number of clusters.
An analysis of molecular variance (AMOVA) was conducted using GenAlEx software, and variations between and among populations, as well as the population differentiation coefficient (F ST), were calculated. Gene flow (N m) was calculated as 0.25(1 − F ST)/F ST, as described by Wright (Reference Wright1931).
Geographic distances among populations were calculated by Vincenty’s formula (http://www.movable-type.co.uk/scripts/latlong-vincenty.html). Mantel tests between Nei’s genetic distance and geographic distance were conducted using the GenAlEx software to estimate the effect of geographic distance on the genetic structure of the populations.
Results and Discussion
Genetic Diversity and Variation
Among the 427 individuals, 28 alleles were detected in 12 nuclear microsatellite loci (Table 1). Among the 11 populations, the polymorphic loci percentage was high and varied from 91.67% to 100%, with an average of 94.70% (Table 2). The N e varied from 1.5287 (WC population) to 1.8693 (BB population), with an average of 1.6922; I varied from 0.4506 (WC population) to 0.6826 (BB population), with an average of 0.5549; PIC varied from 0.2359 (WC population) to 0.3579 (BB population), with an average of 0.2925; while H o varied from 0.2935 (YJ population) to 0.4136 (BB population), with an average of 0.3314; and H e varied from 0.2855 (WC population) to 0.4313 (BB population), with an average of 0.3541 (Table 2). The F IS values varied from −0.012 to 0.227, with an average of 0.0971 (Table 2). The heterozygosity of nuclear markers is the most common metric of diversity used to estimate the intraspecific genetic diversity in plants (Dlugosch and Parker Reference Dlugosch and Parker2008). Consistent with prior studies on the genetic diversity of M. micrantha at the population level (Geng et al. Reference Geng, Chen, Cai, Cao and OuYang2016), a relatively higher level of genetic diversity was found at the population levels in this study. For example, the mean H e was 0.3541 at the population level versus a mean H e of 0.477 at the population level reported in a previous study by Geng et al. (Reference Geng, Chen, Cai, Cao and OuYang2016). The genetic diversity might be primarily owing to the reproductive traits of M. micrantha. Mikania micrantha is a self-incompatible plant (Hong et al. Reference Hong, Shen, Ye, Cao and Wang2007), and strong sexual reproduction helps it maintain a relatively high level of genetic diversity (Geng et al. Reference Geng, Chen, Cai, Cao and OuYang2016). The species produces enormous numbers of small and light seeds (1.7 × 10⁵ m−2), which are dispersed via wind (Zhang et al. Reference Zhang, Ye, Cao and Feng2004), although it can also reproduce vegetatively by producing shoots from stem fragments and rosettes (Zhang et al. Reference Zhang, Ye, Cao and Feng2004), which could reduce the genetic diversity within populations (Wang et al. Reference Wang, Wang, Chen, Wang and Su2016). Low mean rates of clonal reproduction are seen with populations sampled at intervals of at least 10 m apart (Geng et al. Reference Geng, Chen, Cai, Cao and OuYang2016).
Table 1. Sequences of the 12 microsatellite primers successfully used in this study. a

a Abbreviations: Tm, melting temperature.
Table 2. Genetic diversity of 11 Mikania micrantha populations. a

a Abbreviations: P, percentage of polymorphic loci (%); N a, number of alleles at each locus; N e, number of effective alleles; I, Shannon’s information index; PIC, polymorphic information content; H o, observed heterozygosity; H e, expected heterozygosity; F IS, inbreeding coefficient. The abbreviations for populations are listed in Figure 1 and Supplementary Table S1.
Genetic Differentiation and Gene Flow
The results of the AMOVA showed that most of the variation occurred within populations (82.73%), while only 18.27% occurred among populations (Table 3). The genetic differentiation coefficient (F ST) was 0.183 (Table 3), indicating a relatively low level of genetic differentiation among populations. Similar results have been reported by Geng et al. (Reference Geng, Chen, Cai, Cao and OuYang2016), whose AMOVA results showed that 91% of the genetic variation resided within populations and 9% among populations. The self-incompatible reproduction mechanism of M. micrantha can effectively avoid population inbreeding depression and could contribute to reducing the genetic differentiation among populations (Geng et al. Reference Geng, Chen, Cai, Cao and OuYang2016).
Table 3. Analysis of molecular variance (AMOVA) results for Mikania micrantha populations. a

a Abbreviations: df, degree of freedom; SS, sum of squares; MS, expected mean squares; F ST, genetic differentiation coefficient.
b P-value = probability of null hypothesis. Significance tests after 1,000 permutations.
In this study, the estimated N m from F ST was 1.116, which is larger than 1.0, indicating the gene flow of M. micrantha was strong enough to prevent substantial differentiation owing to genetic drift (Slatkin and Barton, Reference Slatkin and Barton1989). In a previous study, the calculated N m value among populations collected from Guangdong Province was even higher (N m = 5.478; Geng et al. Reference Geng, Chen, Cai, Cao and OuYang2016), which indicated that the dispersal and establishment via seed prevail over vegetative expansion in M. micrantha (Wang et al. Reference Wang, Wang, Chen, Wang and Su2016). The extensive gene flow, mediated by wind-dispersed seeds, is likely to be the primary factor that causes the random distribution of genetic variation of M. micrantha across the introduced region (Zhang et al. Reference Zhang, Ye, Cao and Feng2004). The strong sexual reproduction of M. micrantha allows for gene flow within and among populations, which helps it to overcome founder effects and tends to increase the genetic variation of populations (Geng et al. Reference Geng, Chen, Cai, Cao and OuYang2016). Alternatively, human-mediated long-distance dispersal events of seeds or propagules of M. micrantha could facilitate gene flow among distant populations (Geng et al. Reference Geng, Chen, Cai, Cao and OuYang2016; Wang et al. Reference Wang, Su and Chen2008).
Genetic Structure and Independent Origins of Populations from Dehong State, Yunnan Province
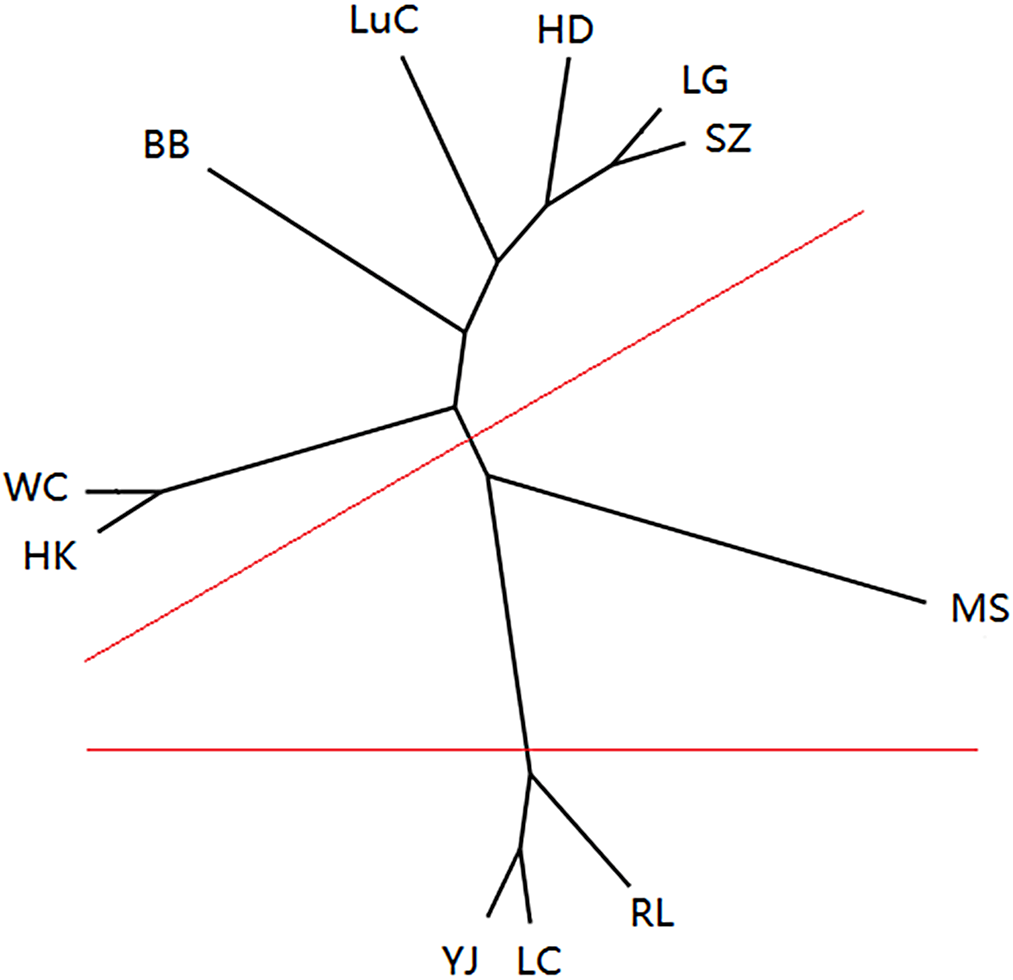
In the STRUCTURE analysis, the clustering level, K = 3, yielded the largest ΔK value (i.e., three clusters) (Figure 2). At K = 3, almost all individuals that belonged to the populations MS, RL, LC, and YJ from Dehong State, Yunnan Province, were grouped together in the red cluster (Figure 2; Table 4), while the LG, SZ, and LuC populations were grouped together in the green cluster, and population WC from Hainan Province was grouped in the blue cluster (Figure 2; Table 4). These results indicate that the genetic structure of M. micrantha populations (MS, RL, LC, and YJ) from Dehong State, Yunnan Province, is unique and distinct from that of the other populations, indicating an independent origin and development of these populations. The independent origin of populations from Dehong State, Yunnan Province, was also supported by the fact that the first specimen of M. micrantha was collected in 1983 by Qing Lin in Yingjiang City, Dehong State, Yunnan Province (specimen number 7708052, 1983-10-26; Du et al. Reference Du, Yang, Li and Yin2006). In addition, 11 populations of M. micrantha were clustered in three groups using the UPGMA method. The MS population from Dehong State, Yunnan Province, formed a group with a single population, while the populations YJ, LC, and RL from Dehong State, Yunnan Province, clustered into the second group (Figure 3). The other seven populations from Guangxi, Guangdong, and Hainan provinces were clustered into the third group (Figure 3). Based on the UPGMA and STRUCTURE analysis results, we also deduce that the MS, YJ, LC, and RL populations from Dehong State, Yunnan Province, could have originated independently and developed.

Figure 2. Bayesian assignment proportions for K = 3 clusters of 11 Mikania micrantha populations determined in the STRUCTURE software. Each vertical bar represents one individual. From 1 to 11, the populations are MS, RL, LC, YJ, LuC, BB, HK, WC, LG, SZ, and HD. The abbreviations for populations are listed in Supplementary Table S1.
Table 4. Proportion of ancestry of each Mikania micrantha population in three gene pools, defined via the model-based clustering method at K = 3. a


Figure 3. Unrooted unweighted pair-group method with arithmetic means (UPGMA) tree of 11 Mikania micrantha populations based on Nei’s genetic distance. Clustering groups are artificially indicated by red lines. The abbreviations for populations are listed in Supplementary Table S1.
In this study, we also found that almost all of the individuals that belong to population WC from Hainan Province were grouped in the blue cluster (Figure 2; Table 4). Yu and Wu (Reference Yu and Wu2009) determined that Wenchang City was the first introduction site in 2003 in Hainan Province. Although genetic analysis based on more populations is needed to determine the origin of the WC population of M. micrantha, we deduced that the WC population from Hainan Province could have originated independent of the ancestors of populations not collected in this study.
Genetic Distance and Multiple Introductions
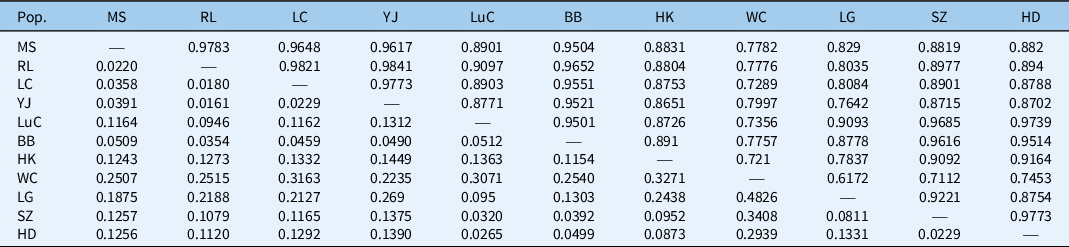
Population pairwise relationships showed the lowest genetic distance between populations YJ and RL (0.0161) in Yunnan Province and the highest between populations WC and LG (0.4826) in Hainan Province (Table 5). We also found a lack of a clear geographic genetic structure among populations of M. micrantha based on the UPGMA results (Figure 3). With the exception of the four populations from Dehong State, Yunnan Province (RL, LC, MS, and YJ), that were clustered together, two closely related populations (i.e., the LG population form Hainan Province and the SZ population from Guangdong Province) are from different geographic locations, while two populations collected from the same province (i.e., the HD and SZ populations from Guangdong Province) did not group together (Figure 3). In addition, a Mantel test of pairwise Nei’s genetic distances and pairwise geographic distances revealed no evidence for isolation by distance (r = 0.068, P = 0.343) (Figure 4). These results indicate multiple origins of populations of M. micrantha in this study. Wang et al. (Reference Wang, Wang, Chen, Wang and Su2016) used seven cpSSRs to investigate 28 M. micrantha populations and detected no evidence for “isolation by distance,” indicating that multiple introductions are inferred among populations of M. micrantha. Multiple introductions have also been reported in M. micrantha populations using AFLP (Wang et al. Reference Wang, Chen, Zan, Wang and Su2012) and cpSSR (Wang et al. Reference Wang, Wang, Chen, Wang and Su2016). Multiple introductions can also contribute to the high genetic variation within populations and the low genetic differentiation among populations of M. micrantha by transforming among-population variation from different geographic sources into within-population variation (Geng et al. Reference Geng, Chen, Cai, Cao and OuYang2016; Kolbe et al. Reference Kolbe, Glor, Schettino, Lara, Larson and Losos2004; Wang et al. Reference Wang, Su and Chen2008).
Table 5. Pairwise genetic similarity of Mikania micrantha populations listed above the diagonal run of dashes and Nei’s genetic distance listed below the diagonal run of dashes. a


Figure 4. Mantel test of Nei’s genetic distance and geographic distance of 11 Mikania micrantha populations. The line indicates the linear regression line between Nei’s genetic distance and geographic distance.
Post-introduction Admixture
In this study, the STRUCTURE results also indicate that at K = 3, the BB population from Guangxi Province, HK population from Hainan Province, and HD population from Guangdong Province could not be assigned to a single cluster, so they were denoted by a combination of red cluster and green cluster (Figure 2; Table 3). These results indicate that the BB, HK, and HD populations could originate from the admixture of the red cluster (populations from Yunnan Province) and the green cluster (populations from Guangxi, Guangdong, and Hainan provinces). Similar mechanisms were described for this species in previous studies (Geng et al. Reference Geng, Chen, Cai, Cao and OuYang2016; Wang et al. Reference Wang, Chen, Zan, Wang and Su2012). Admixture creates unique opportunities for genetic interactions among previously isolated alleles and/or loci, which can dramatically affect phenotypes and fitness in admixed genotypes (Edmands Reference Edmands1999; Keller and Waller Reference Keller and Waller2002). Compared with the lack of genetic structure and low gene flow inferred from pre-introduction admixture of common ragweed (Ambrosia artemisiifolia L.) (Li et al. Reference Li, van Kleunen, Li, Liu, Gao, Zhu, Zhao, Zhao and Li2019), our results imply that the post-introduction admixture caused by multiple introductions and/or high gene flow (van Boheemen et al. Reference van Boheemen, Lombaert, Nurkowski, Gauffre, Rieseberg and Hodgins2017) could be alternative mechanisms underlying the invasive success of M. micrantha. In the present study, it was not clear how the BB, HK, and HD populations could obtain genotypes from geographically distant red and green clusters. However, hybridization could have happened in individuals that established after long-distance migration mediated by human activities. Geng et al. (Reference Geng, Chen, Cai, Cao and OuYang2016) found that heavy traffic on highways associated with economic development could be the main force driving the seed dispersal and resulting in the genetic admixture of roadside populations of M. micrantha. The post-introduction admixture may have been formed by hybridization between individuals that originated from different source populations that were carried to new sites via the heavy traffic on highways (Geng et al. Reference Geng, Chen, Cai, Cao and OuYang2016) and other human activities, such as trading, and established new populations.
In conclusion, we found high genetic diversity at the population level and low levels of genetic differentiation among populations of M. micrantha in South China. Three gene clusters and one admixture gene cluster were found. The independent origins of four populations collected from Dehong State, Yunnan Province, was determined. We conclude that post-introduction admixture, caused by multiple introductions, high gene flow, and long-distance dispersal mediated by human activities, could contribute to the evolutionary adaptation of M. micrantha. Further introduction and admixture should therefore be prevented.
Acknowledgments
We thank Chuanguang Zhang at the Yunnan Academy of Forestry and Grassland for kind help in sample collection. This work was financially supported by Key Research and Development Project of Yunnan Province (2018BB009). No conflicts of interest have been declared.
Supplementary material
To view supplementary material for this article, please visit https://doi.org/10.1017/wsc.2021.29