Introduction
Alligatorweed [Alternanthera philoxeroides (Mart.) Griseb., Amaranthaceae] is a semiaquatic weed native to South America and is highly invasive in many regions of the world, including China (Liu et al. Reference Liu, Horvath, Li and Liu2019). Phenotypic variation and clonal integration facilitate the successful invasion of A. philoxeroides in disturbed habitats and under fluctuating environmental conditions, damaging agricultural production and upsetting the ecological balance (Bai et al. Reference Bai, Wang, Fan, Fu, Wang, Zhang, Song, Zhang and Wu2017). Managing the invasion of A. philoxeroides usually requires a combination of biosecurity approaches, including physical removal, herbicide management, and biological control. Mechanical techniques can be adapted for the control of A. philoxeroides through removing above- and belowground materials. However, physical approaches can only be used on a small scale, as the process is costly, labor-intensive, and must be repeated. Previous studies suggested that A. philoxeroides can be effectively managed using herbicides. However, A. philoxeroides evades the herbicide through the production of stem fragments, which can disperse effectively to form new infestations (Tanveer et al. Reference Tanveer, Ali, Manalil, Raza and Chauhan2018). Furthermore, many herbicides only destroy the leaves and shoots without affecting older stems or rhizomes (Schooler et al. Reference Schooler, Cook, Bourne, Prichard and Julien2008). As an invasive weed, A. philoxeroides has become a costly and intractable problem. The understanding of its plasticity and adaptability mechanisms is critical to create more effective and sustainable management programs.
Gene expression analysis is a commonly used and important approach in the study of plant biology that can improve our understanding of the molecular basis underlying diverse biological processes (Fan et al. Reference Fan, Yu and Liu2013b; Zhu et al. Reference Zhu, Gong and Yin2019a). However, many qPCR experiments are difficult to repeat due to differences in the extraction of mRNA between samples and the performance of reverse transcription and PCR itself (Kozera and Rapacz Reference Kozera and Rapacz2013). To avoid the influence of these factors, normalizing genes are applied, and this seems to be one of the easiest ways to correct errors in qPCR research. Ideal reference genes are crucial to the reliability and accuracy of qPCR data (Mughal et al. Reference Mughal, Leemans, Spirhanzlova, Demeneix and Fini2018). Their expression is expected to remain more stable in different tissues and under different experimental treatments than that of the genes being investigated. Unfortunately, no single reference gene in plants has proven to be universally constant during development or when subjected to various experimental conditions. To date, only a few gene expression studies have been performed in A. philoxeroides. In these previous studies, genes, including Actin (Bai et al. Reference Bai, Wang, Fan, Fu, Wang, Zhang, Song, Zhang and Wu2017; Li et al. Reference Li, Xu, Wang, Pan and Lu2015; Song and Su Reference Song and Su2013), Actin2/8 (Li et al. Reference Li, Liu, Zhuo, Chen, Hu, Peng, Wang, Lu and Lu2018), Ubiquitin C (Li et al. Reference Li, Deng, Geng, Zhou, Wang, Zhang, Song, Gao and Yang2017), and UBC10 (Zhu et al. Reference Zhu, Zhou and Yang2015) were used as internal reference genes in qRT-PCR and semi-quantitative PCR analyses. These genes were orthologues of the most frequently used reference genes or were identified by systematic comparisons with traditional reference genes in plants (Chandna et al. Reference Chandna, Rehna and Naveen2012). However, evidence shows that these commonly used reference genes may not be constitutively and stably expressed in different tissues and under different conditions in all plant species (Hong et al. Reference Hong, Seo, Yang, Xiang and Park2008). Therefore, systematic identification and validation of multiple stable reference genes in A. philoxeroides should be considered for accurate transcript normalization research.
High-throughput deep sequencing has been widely employed to study molecular biological changes and regulation among different tissues and treatments, especially for species without a genome assembly, due to its high resolution, sensitivity, and large data set (Leebens-Mack et al. Reference Leebens-Mack, Barker, Carpenter, Deyholos, Gitzendanner, Graham, Grosse, Li, Melkonian, Mirarab, Porsch, Quint, Rensing, Soltis and Soltis2019; Zhu et al. Reference Zhu, Jia, Yang, Xia, Zhang, Jia, Zhou, Nie, Yin, Ma and Liu2019b). Recently, sequences and expression information produced by RNA-seq have been used to identify novel and stable reference genes for several plant species, including grape (Vitis aestivalis Michx.) (González-Agüero et al. Reference González-Agüero, García-Rojas, Di Genova, Correa, Maass, Orellana and Hinrichsen2013), Lycoris aurea (L´ Hér.) Herb. (Ma et al. Reference Ma, Xu, Zhao, Xia and Wang2016), and soybean [Glycine max (L.) Merr.] (Yim et al. Reference Yim, Wong, Ku, Qin, Chan and Lam2015). In A. philoxeroides, several RNA-seq projects have been performed. For instance, Gao et al. (Reference Gao, Geng, Yang, Hu and Yang2015) detected numerous genes responsive to hydrological conditions using RNA-seq. Liu et al. (Reference Liu, Horvath, Li and Liu2019) revealed transcriptomic adaption in A. philoxeroides that grow in the northern and central portions of China. These studies generated large numbers of de novo assembled genes with sequence and expression profiling information, which laid the foundation for selection candidate sequences to develop appropriate qRT-PCR reference gene primers.
In this study, we used a comprehensive de novo assembly of results from multiple RNA-seq data sets to identify the most stably expressed genes in various tissues of A. philoxeroides grown under different conditions (Yin et al. Reference Yin, Tian, Li, Zhu, Zhou, He, Nie, Su, Zhong and Chen2020). Their expression stability was further validated using qRT-PCR. The delta-CT, geNorm, NormFinder, and RefFinder algorithms were used to identify the comprehensive stability ranking of these reference genes under various treatments. This work provides the basis for the gene expression analysis of A. philoxeroides in further research.
Material and Methods
Selection of Stable Expression Genes Based on Expression Patterns
In our previous study, Illumina RNA-seq data of four A. philoxeroides transcriptome sequencing BioProjects (serial nos. PRJNA268359, PRJNA263573, PRJNA256237, and PRJNA256235) were downloaded from the SRA category of the NCBI database (Yin et al. Reference Yin, Tian, Li, Zhu, Zhou, He, Nie, Su, Zhong and Chen2020). In BioProject PRJNA263573, root samples treated with low-potassium nutrient solution and control for 7 d were collected (Li et al. Reference Li, Xu, Wang, Pan and Lu2015). In BioProject PRJNA256237, stem internode tissues were harvested from pond and upland treatments (Gao et al. Reference Gao, Geng, Yang, Hu and Yang2015). In BioProject PRJNA256235, A. philoxeroides clones were collected from uplands and ponds. In the BioProject PRJNA268359, the top two to three leaves were sampled from wild cultivars located in the northern (Jinan, Shandong) and central (Shanghai) portions of A. philoxeroides’s range in China (Liu et al. Reference Liu, Horvath, Li and Liu2019). The Illumina reads obtained were used as input to create the de novo assembly, as reported by Yin et al. (Reference Yin, Tian, Li, Zhu, Zhou, He, Nie, Su, Zhong and Chen2020). The mean FPKM (fragments per kilobase per million reads) values (MV) and SDs of individual genes were calculated for 27 data sets. To select the considerably high and stable expression candidates, genes with MV values larger than 25 were selected and ranked from the least to highest deviation according to the SD. Based on the functional annotations, 30 candidates with commonly known functions were further selected from the top 60 genes. Heat maps and box plots were generated using the R package ggplot with commands “pheatmap(log2(data), color = col, cluster_cols = FALSE, cluster_rows = T, gaps_col = c(2,19,21,24))” and “boxplot(log(data), col = “green”, pars = list(pch = NA, ylab = “Average log2(FPKM)”, xlab = “Gene”))” (Fang et al. Reference Fang, Jiang, He, Ma, Liu, Wang, Zhang and Yin2020). To further evaluate the expression stability of the 30 selected genes, the indicators, including coefficient of variation (CV; SD of FPKM/average of FPKM) and maximum fold change (MFC; maximum FPKM value/minimum FPKM value), were calculated and used to draw the dot plot (de Jonge et al. Reference de Jonge, Fehrmann, de Bont, Hofstra, Gerbens, Kamps, de Vries and van der Zee2007).
Plant Materials
Naturally grown A. philoxeroides was collected from a test field of Yangtze University (112.152553°E, 30.357591°N). Vegetative parts from 30 individuals were harvested and cut to produce 5-cm-long nodal segments. The basal section was 2.5 cm long, and the apical section was 2.5 cm long. Then, half of these plants were cultured in Hoagland nutrient solution, and the other half were planted into plastic pots (15.5 cm in diameter at the top and 14.5-cm high). The plastic pots were filled with sandy loam soil. The temperature in the greenhouse was maintained around 28/25 C with a day/night cycle of 14/10 h. After 70 d of growth, uniformly sized seedlings were transferred to plastic containers filled with 1/2 Hoagland’s nutrient solution. Five experimental groups were designed: (1) control: seedlings were grown under 28/18 C day/night temperature; (2) drought stress: mannitol (5%) was added to the nutrient solution; (3) salt stress: NaCl (150 mM) was added to the nutrient solution; (4) chilling stress: seedlings were maintained at 4 C for 4 h; and (5) heat stress: seedlings were maintained at 40 C temperature for 4 h (Yin et al. Reference Yin, Tian, Li, Zhu, Zhou, He, Nie, Su, Zhong and Chen2020). Adventitious root (diameter < 1.5 mm), stem, and leaf tissues from aquatic plants and storage root (diameter > 1.5 mm), stem, and leaf tissues from terrestrial plants were then collected, quickly frozen in liquid nitrogen, and stored at −80 C before RNA extraction. For herbicide treatments, a total of five commonly used herbicides, including glyphosate, isoproturon, oxadiazon, fluoroglycofen, and fluroxypyr, were sprayed onto naturally grown A. philoxeroides (Schooler et al. Reference Schooler, Cook, Bourne, Prichard and Julien2008). About 4 and 24 h later, stem and leaf tissues were collected for RNA extraction. Specific details of the herbicides used in the study and application rates can be found in Supplementary Table 1.
RNA Isolation and cDNA Synthesis
Total RNA was isolated from for each sample using TRIzol™ reagent (Thermo Fisher, Waltham, MA, USA). The integrity and quality of RNA were evaluated by performing 1.5 g L−1 agarose gel electrophoresis, and the quantity and quality of RNA samples were measured with a NanoDrop™ 2000 Spectrophotometer (NanoDrop Technologies, Thermo Scientific, Waltham, MA, USA). Single-strand cDNA was synthesized from 1 μg of total RNA, using the RevertAid First Strand cDNA Synthesis Kit with oligo-dT (Thermo Scientific) in a PTC-200 Thermal Cycler (MJ Research, Waltham, MA, USA) following the manufacturer’s protocol. The final cDNA products were diluted 10-fold with nuclease-free water before use.
Primer Design and Specific Confirmation
The gene-specific qRT-PCR primers were designed using Primer Premier 5.0 (PREMIER Biosoft International, Palo Alto, CA, USA). The exon-exon regions were specifically targeted during primer design to avoid possible genomic DNA amplification. To confirm the specificity of primers, a 20 μl reaction mixture, containing 10 μl of 2× Taq Master Mix (Vazyme, Nanjing, China), 3 to 5 μl of DNA template (200 ng μl−1), 1 μl each of forward and reverse primers (synthesized by Genscript, Shanghai, China), and 5 μl ddH2O, was used. PCR amplification was performed in an MJ Research PTC-200 thermal cycler as follows: initial denaturation at 94 C for 5 min, followed by 35 cycles of 30 s denaturation at 94 C, 30 s annealing at 58 C, and 30 s extensions at 72 C, and a final extension at 72 C for 10 min (Yin et al. Reference Yin, Liu, Ma, Wu, Li, Zhu and Han2018). After amplification, 8 μl of PCR product mixture of each sample was loaded for electrophoresis on 1.5% agarose gels and visualized using the Gel Doc XR system (Bio-Rad, Hercules, CA, USA).
qRT-PCR and Data Analysis
Real-time qRT-PCR was carried out on a CFX 96 Real-Time PCR system (Bio-Rad) using SYBR Green Master Mix (Vazyme) as previously reported (Zhu et al. Reference Zhu, Jia, Yang, Xia, Zhang, Jia, Zhou, Nie, Yin, Ma and Liu2019b). The reaction mixture contained 10 µl of SYBR Green I Master, 0.4 µl of each of the forward and reverse primers (10 µM), 2.0 µl of diluted cDNA, and 7.2 µl of PCR-grade water in a final volume of 20 µl. The PCR amplification program was performed as follows: 30 s at 95 C, 40 cycles of 10 s at 95 C and 30 s at 60 C, and a melting curve protocol (65 to 95 C with fluorescence measured every 0.5 C). Each sample contained three biological replications. The housekeeping gene Actin used by Song and Su (Reference Song and Su2013) was also tested in this study. For qPCR results, RefFinder (https://www.heartcure.com.au/reffinder/?type=reference), which integrates the BestKeeper, NormFinder, geNorm, and the delta-CT method, was used to determine the most stable reference genes under various stresses (salt, drought, heat, and chilling) in different A. philoxeroides tissues. The PCR efficiency (E) and the regression coefficient (R2) were calculated using the slope of the standard curve generated from a 10-fold dilution of cDNA in a qRT-PCR assay according to the equation E = [10−(1/slope) − 1] × 100% (Duan et al. Reference Duan, Wang, Zhang, Yang, Wang, Qiu, Song, Guo and Li2017).
Results and Discussion
Identification of Candidate Reference Genes from Alternanthera philoxeroides RNA-seq Data
Validating appropriate internal reference genes for the quantification of gene transcripts is extremely important to ensure the reliability of qRT-PCR analysis (Gutierrez et al. Reference Gutierrez, Giménez, Palomino and Avila2011). To date, reference gene evaluation and validation studies have been performed in many plants, including brown mustard [Brassica juncea (L.) Czern.] (Chandna et al. Reference Chandna, Rehna and Naveen2012), soybean (Le et al. Reference Le, Aldrich, Valliyodan, Watanabe, Ha, Nishiyama, Guttikonda, Quach, Gutierrez-Gonzalez, Tran and Nguyen2012), bamboo [Bambusa arundinacea (Retz.) Willd.] (Fan et al. Reference Fan, Ma, Guo, Li, Wang and Lu2013a), and fava bean (Vicia faba L.) (Gutierrez et al. Reference Gutierrez, Giménez, Palomino and Avila2011), while limited information is available on stable reference genes for A. philoxeroides. Thus, it is necessary to identify reference genes for this invasive weed and confirm that their expression is stable.
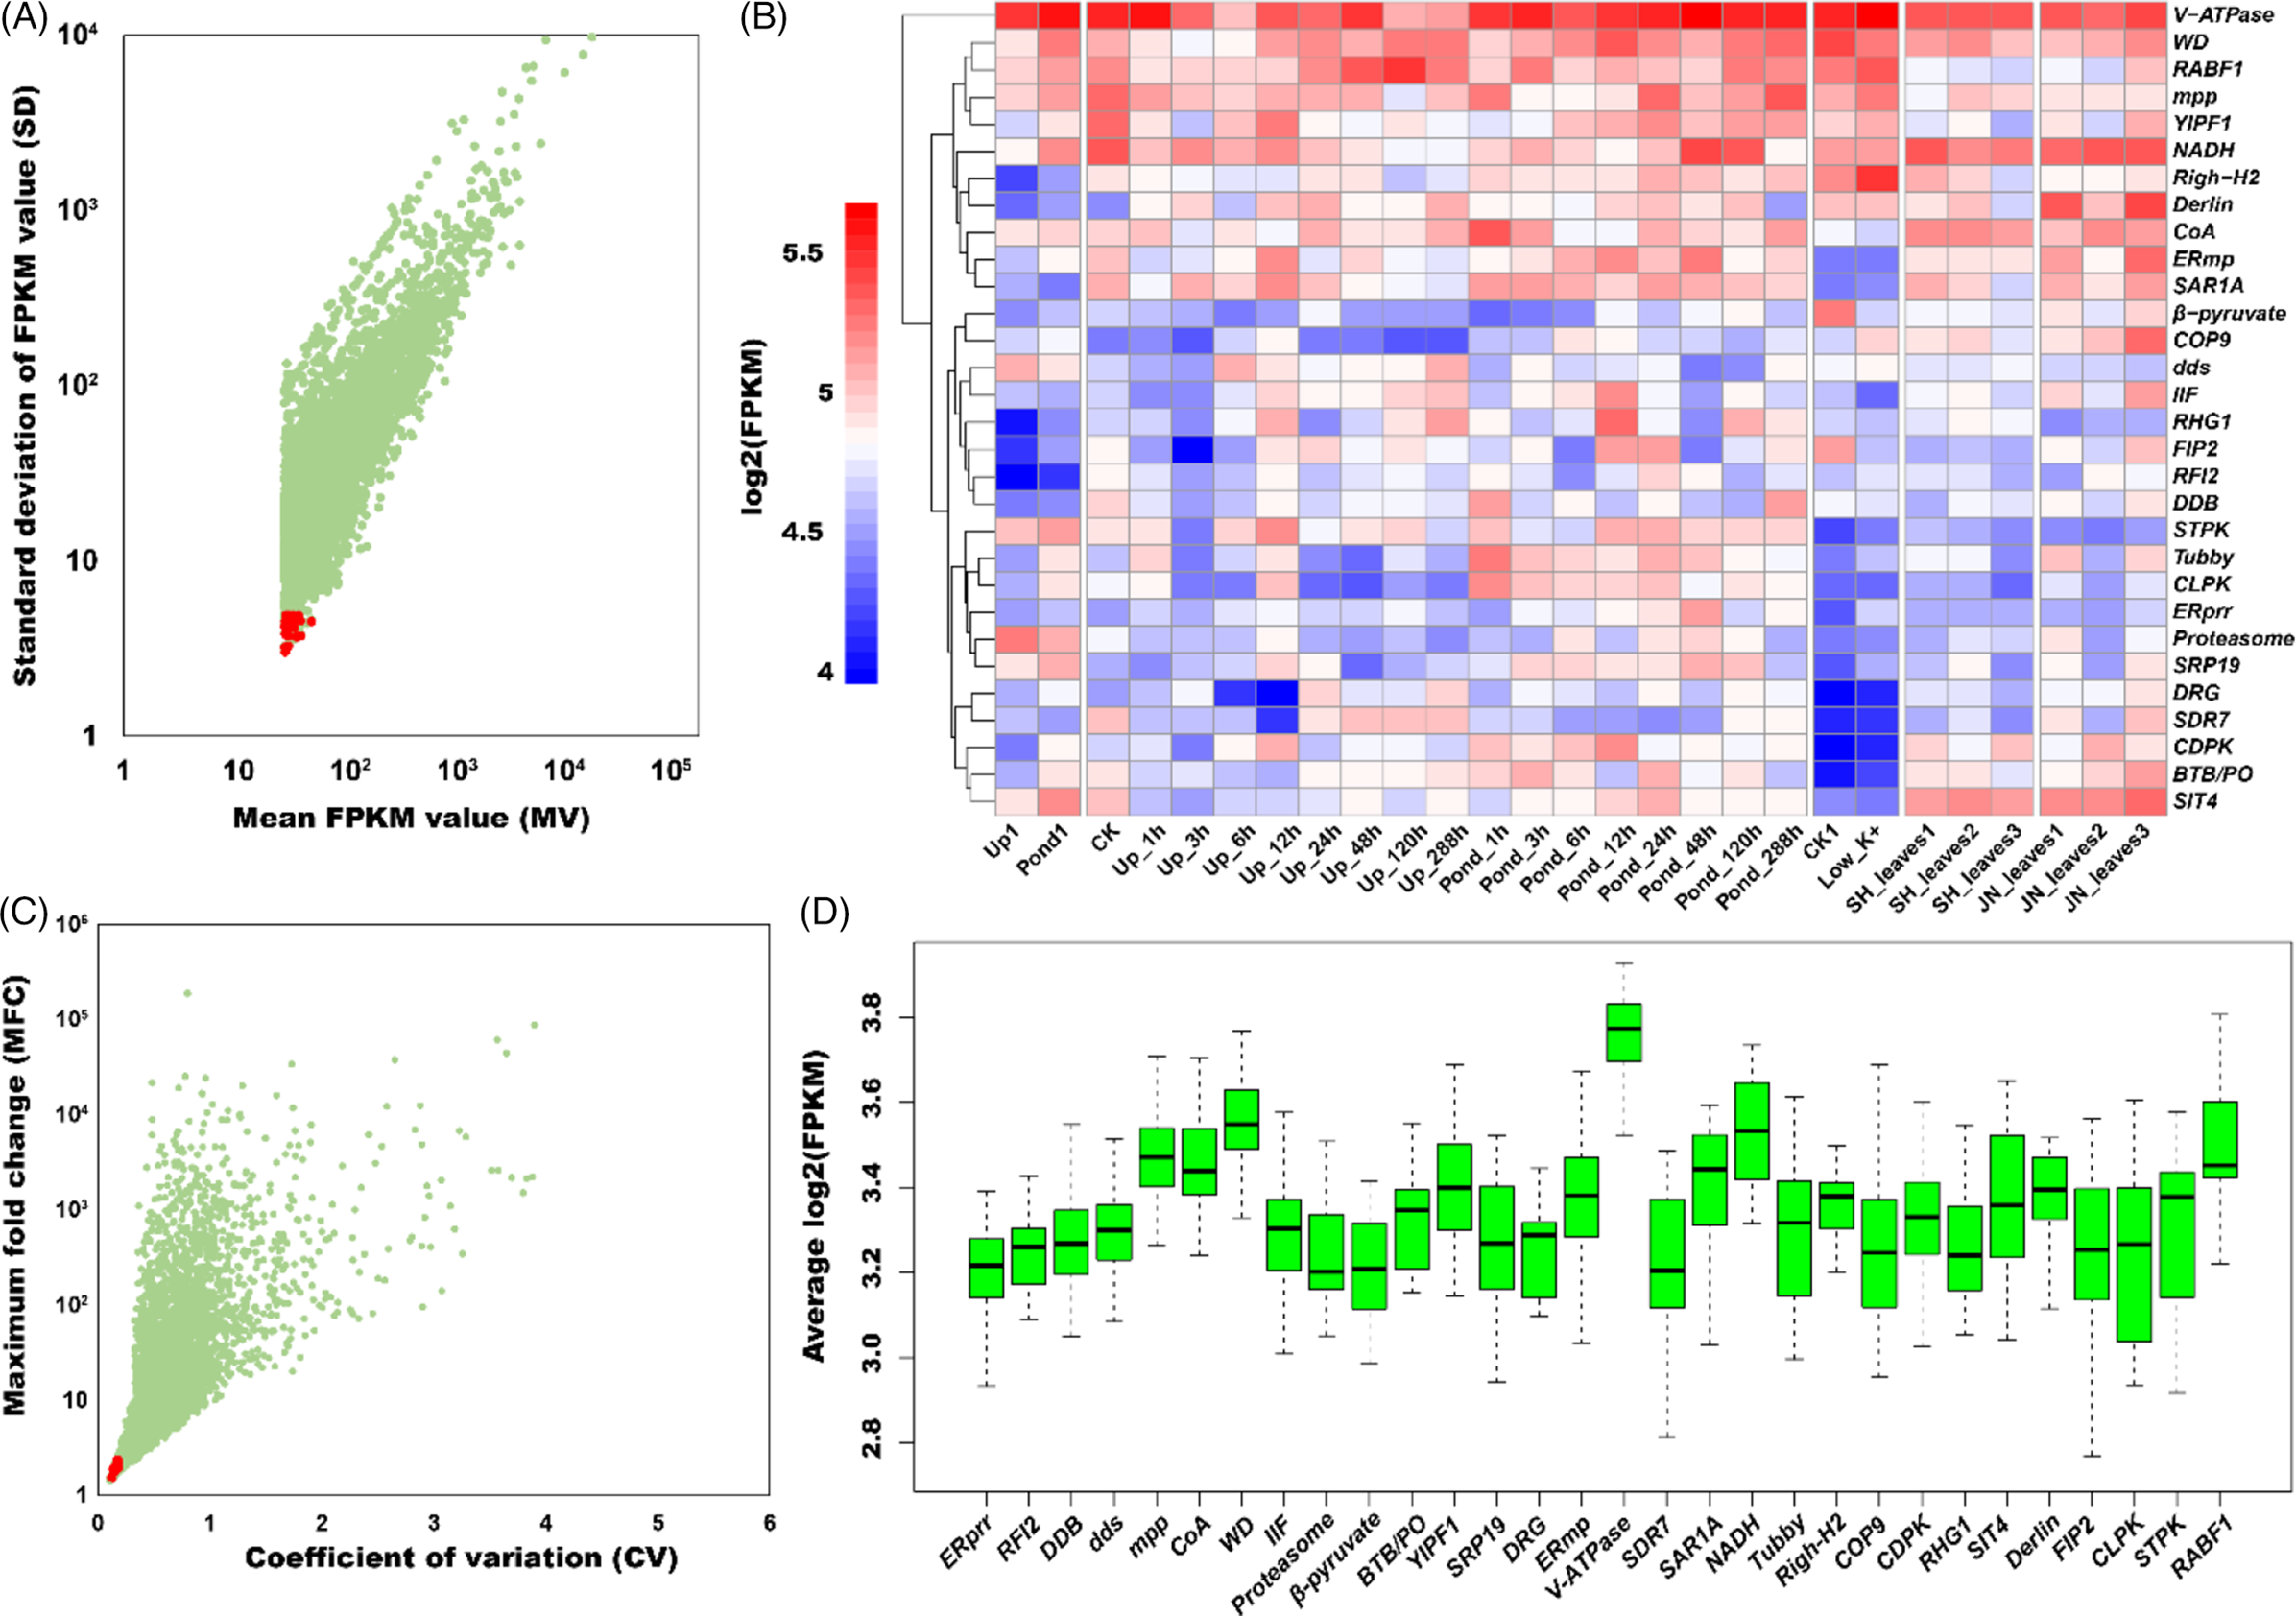
In our previous study, we collected four sets of released RNA-seq data from NCBI and reran the de novo transcriptome assembly pipeline (Yin et al. Reference Yin, Tian, Li, Zhu, Zhou, He, Nie, Su, Zhong and Chen2020). The newly assembled transcriptomic sequences were used to search and select candidate reference genes in A. philoxeroides. The expression level for each gene in the RNA-seq data was first normalized based on FPKM values, which were then used to calculate FPKM MV and SD. After ranking the SDs from the smallest to the largest, we selected 30 genes with an MV larger than 25 and with functional annotations from the top 60 stable expression candidates (Table 1; Figure 1A; Supplementary Table 2). To estimate the expression stability of each gene, the CV (SD of FPKM/average of FPKM) and MFC were calculated. As shown in Supplementary Table 2, the CV and MFC values of these 30 selected candidates were less than 0.2 and 2.5, respectively (Figure 1B). In general, the MV, SD, CV, and MFC values indicate that the 30 candidate genes are appropriate for further reference primer development.
Table 1. Detailed information on candidate reference genes. a
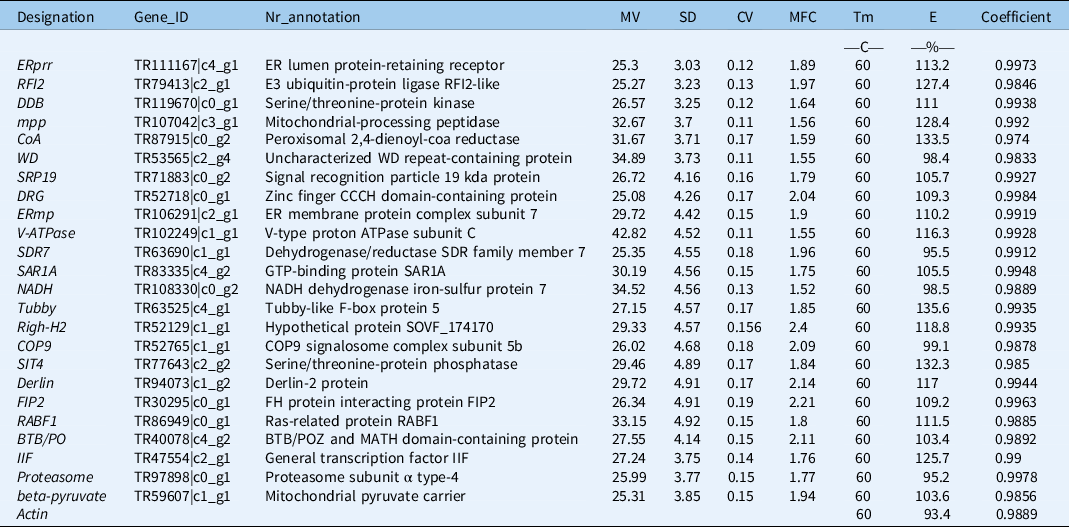
a Abbreviations: Nr, all non-redundant sequences; MV, mean FPKM (Fragments per Kilobase Million) values; SD, standard deviation of FPKM values; CV, coefficient of variation calculated by SD/MV; MFC, maximum fold change of FPKM values; E%, PCR efficiency; Coefficient, regression coefficient (R2); Tm, melting temperature.

Figure 1. Expression levels and patterns of selected genes. The expression stability of 30 selected candidate genes is indicated by (A) standard deviation of FPKM (fragments per kilobase per million reads) value (SD) and mean FPKM value (FPKM) and (B) maximum fold change (MFC) and coefficient of variation (CV). Red dots represent the 30 selected genes, and cyan dots represent the other genes. (C) Gene expression levels under multiple conditions. (D) Overview of expression patterns. Box-and-whisker plot graph shows log2(FPKM) values for each selected gene from different tissues and under different treatments. Black lines and boxes represent the medians and 25th/75th percentiles, respectively. Whisker caps represent the minimum and maximum values. Upland (Up) and Pond: pooled samples of Alternanthera philoxeroides were collected from upland and pond environments (BioProject ID PRJNA256235). CK: control, root; Low K+: low-potassium stress, root (BioProject ID PRJNA256237). Pond_CK to Pond_288h: potted plants were completely submerged in a series of plastic tanks containing tap water to a depth of 50 cm; Up_CK to Up_288h: plants were supplied with 1 L H2O d−1 in the upland treatment and the soil was kept well drained. Stem internode tissues were harvested for each treatment (BioProject ID PRJNA268359). JN: “Northern” population (the top 2nd and 3rd leaf pairs) collected in Jinan, Shandong; SH: “central” population (the top 2nd and 3rd leaf pairs) collected in Shanghai.
To illustrate the gene expression stability of the 30 selected genes, RNA-seq data were further analyzed. As shown in the heat map (Figure 1C) and box plot (Figure 1D), the expression levels of these 30 candidate genes were considerably stable and consistent among different tissues and under different treatments. These results demonstrated that the selected candidates are reliable.
Confirmation of Reference Gene Primers
Thirty pairs of primers with melting temperature (Tm) values between 52.2 and 62.6 C and amplicon fragment sizes between 107 and 276 bp were designed (Supplementary Table 3). Their specificity was confirmed by PCR reactions and 1.5 g L−1 agarose gel electrophoresis. The primers dds, YIPF1, CDPK, RHG1, and STPK were filtered out due to low specificity. The other primers (ERprr, RFI2, DDB, mpp, CoA, WD, IIF, Proteasome, β-pyruvate, BTB/PO, SRP19, DRG, ERmp, V-ATPase, SDR7, SAR1A, NADH, Tubby, Righ-H2, COP9, SIT4, Derlin, FIP2, CLPK, and RABF1) were kept for further stability validation (Figure 2). Then, the PCR efficiencies of 25 candidate reference genes were calculated. As shown in Table 1, the amplification efficiency (E) of each primer pair varied between 95.2% for Proteasome and 135.6% for Tubby. The regression coefficient (R2) ranged from 0.974 (CoA) to 0.998 (DRG). We also performed melting curve analysis for all of the primers used, and a single peak corresponding to a single amplification product was observed in all cases (Supplementary Figure 1). These results confirmed that the 25 pairs of primers could be used to perform qRT-PCR analysis because they have high amplification efficiency and are specific for candidate reference gene amplification.
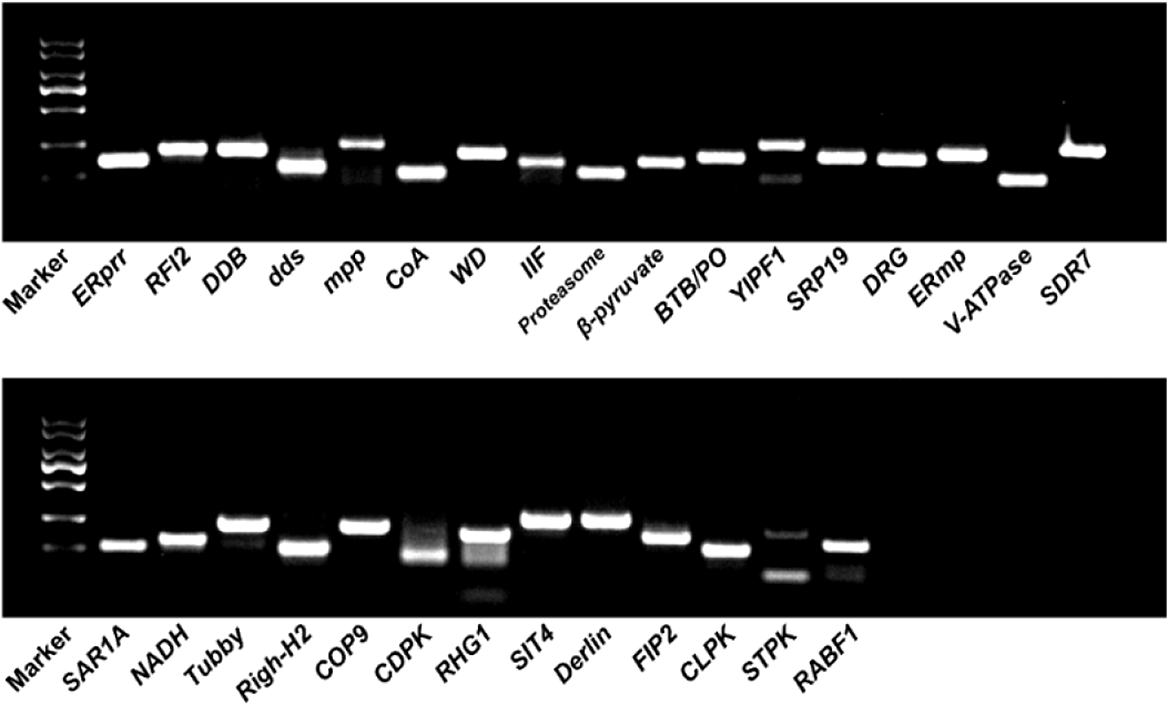
Figure 2. PCR products resolved on an agarose gel to confirm the specificity of primers. Marker, DL2000 marker. The remaining lanes are the PCR products of primers corresponding to candidate reference genes.
Comprehensive Stability Analysis of Reference Genes
One of the important characters of housekeeping genes is that they are expressed stably throughout different periods of time, treatments, and organs (Mughal et al. Reference Mughal, Leemans, Spirhanzlova, Demeneix and Fini2018). To confirm the expression stability of the 25 candidate reference genes and select the best ones for the purpose of expression normalization in A. philoxeroides, the expression levels of the 25 candidate reference genes were evaluated in different samples (root, stem, and leaf tissues subjected to different treatments: NaCl, PEG-induced drought stress, heat, chilling stress, and a control) using qRT-PCR. qRT-PCR was performed on these selected genes and an Actin gene adapted from a previous study in A. philoxeroides (Song and Su Reference Song and Su2013) (Supplementary Table 4). Different tools, such as geNorm, NormFinder, and BestKeeper (Andersen et al. Reference Andersen, Jensen and Ørntoft2004; Pfaffl et al. Reference Pfaffl, Tichopad, Prgomet and Neuvians2004; Vandesompele et al. Reference Vandesompele, De, Pattyn, Poppe, Van, De and Speleman2002) have been developed and adopted to identify the best suitable reference genes from candidate reference genes in many plant species (Fan et al. Reference Fan, Ma, Guo, Li, Wang and Lu2013a; Xu et al. Reference Xu, Zhang, Su, Zhang and Huang2011; Zhang et al. Reference Zhang, Wu, Wan, Gu, Zhang, Wu and Zhang2012). The SD values calculated by the delta-CT method were used to rank the stability of the candidate reference genes. The gene with the lowest SD was identified as the most stable reference gene (Duan et al. Reference Duan, Wang, Zhang, Yang, Wang, Qiu, Song, Guo and Li2017). As shown in Figure 3B, the analysis results suggested that CoA (1.87), Tubby (1.89), and RFI2 (1.92) were the most stable reference genes. RABF1 (6.03), CLPK (6.04), and Actin (10.26) were the least stable reference genes. The BestKeeper program can be used to calculate the CV and the SD of the Cq (cycle of quantitative real-time PCR) values and thus evaluate the stability of a candidate reference gene. Reference genes exhibiting the lowest CV and SD (CV ± SD) are identified as the most stable genes. As shown in Figure 3C, the BestKeeper analysis suggested that RF12 (3.21 ± 0.97) and Tubby (3.96 ± 1.18) were the most stable reference genes, while RABF1 (8.83 ± 2.48) and Actin (20.05 ± 5.92) were the least stable reference genes (Supplementary Table 5). geNorm ranks the candidate reference genes based on the expression stability value M (average pair-wise variation of a certain gene with all other candidates being tested). The gene with the highest M value is considered to have the least stable expression, while the gene with the lowest M value has the most stable expression (Vandesompele et al. Reference Vandesompele, De, Pattyn, Poppe, Van, De and Speleman2002). In this study, the CoA and Tubby genes were most stably expressed in different samples under various treatments, with an M value of 0.497. In contrast, CLPK and Actin were the most unstable genes, with M values of 2.206 and 2.825, respectively (Figure 3D). Compared with geNorm, which identifies two reference genes with the highest degree of similarity in expression profile and the lowest intragroup variation (Ma et al. Reference Ma, Xu, Zhao, Xia and Wang2016), NormFinder combines inter- and intragroup variations into a stability value and finally ranks the top genes with minimal inter- and intragroup variation (Andersen et al. Reference Andersen, Jensen and Ørntoft2004). The NormFinder software ranks the candidate reference genes based on gene transcript–level variations under certain experimental conditions. As in the geNorm method, the gene with the lowest M value represents the gene with the lowest variation and most stable expression. As can be seen in Figure 3E, the ranking values of 26 genes gradually increased from left to right, while the stability gradually decreased accordingly. In this study, CoA and Tubby had the lowest ranking values at 0.552 and 0.594, respectively. The ranking order was slightly different from that of geNorm. As can be seen in Figure 3, the two most stable genes, as determined by delta-CT, BestKeeper, NormFinder, and geNorm, were CoA and Tubby; RF12 and Righ-H2; V-ATPase and SPR19; and CoA and Tubby, respectively. Due to the differences in statistical algorithms and analytical procedures, it was not surprising that the rankings of candidate genes varied depending on the software used (delta-CT, BestKeeper, NormFinder, or geNorm). However, two genes (RF12 and SRP19) were identified as being among the six most stable reference genes by four algorithms at the same time, and three genes (Proteasome, CoA, and V-ATPase) were identified as being among the six most stable reference genes by at least three algorithms at the same time. SIT4, RABF1, CLPK, and Actin were unstably expressed based on all the tools used.
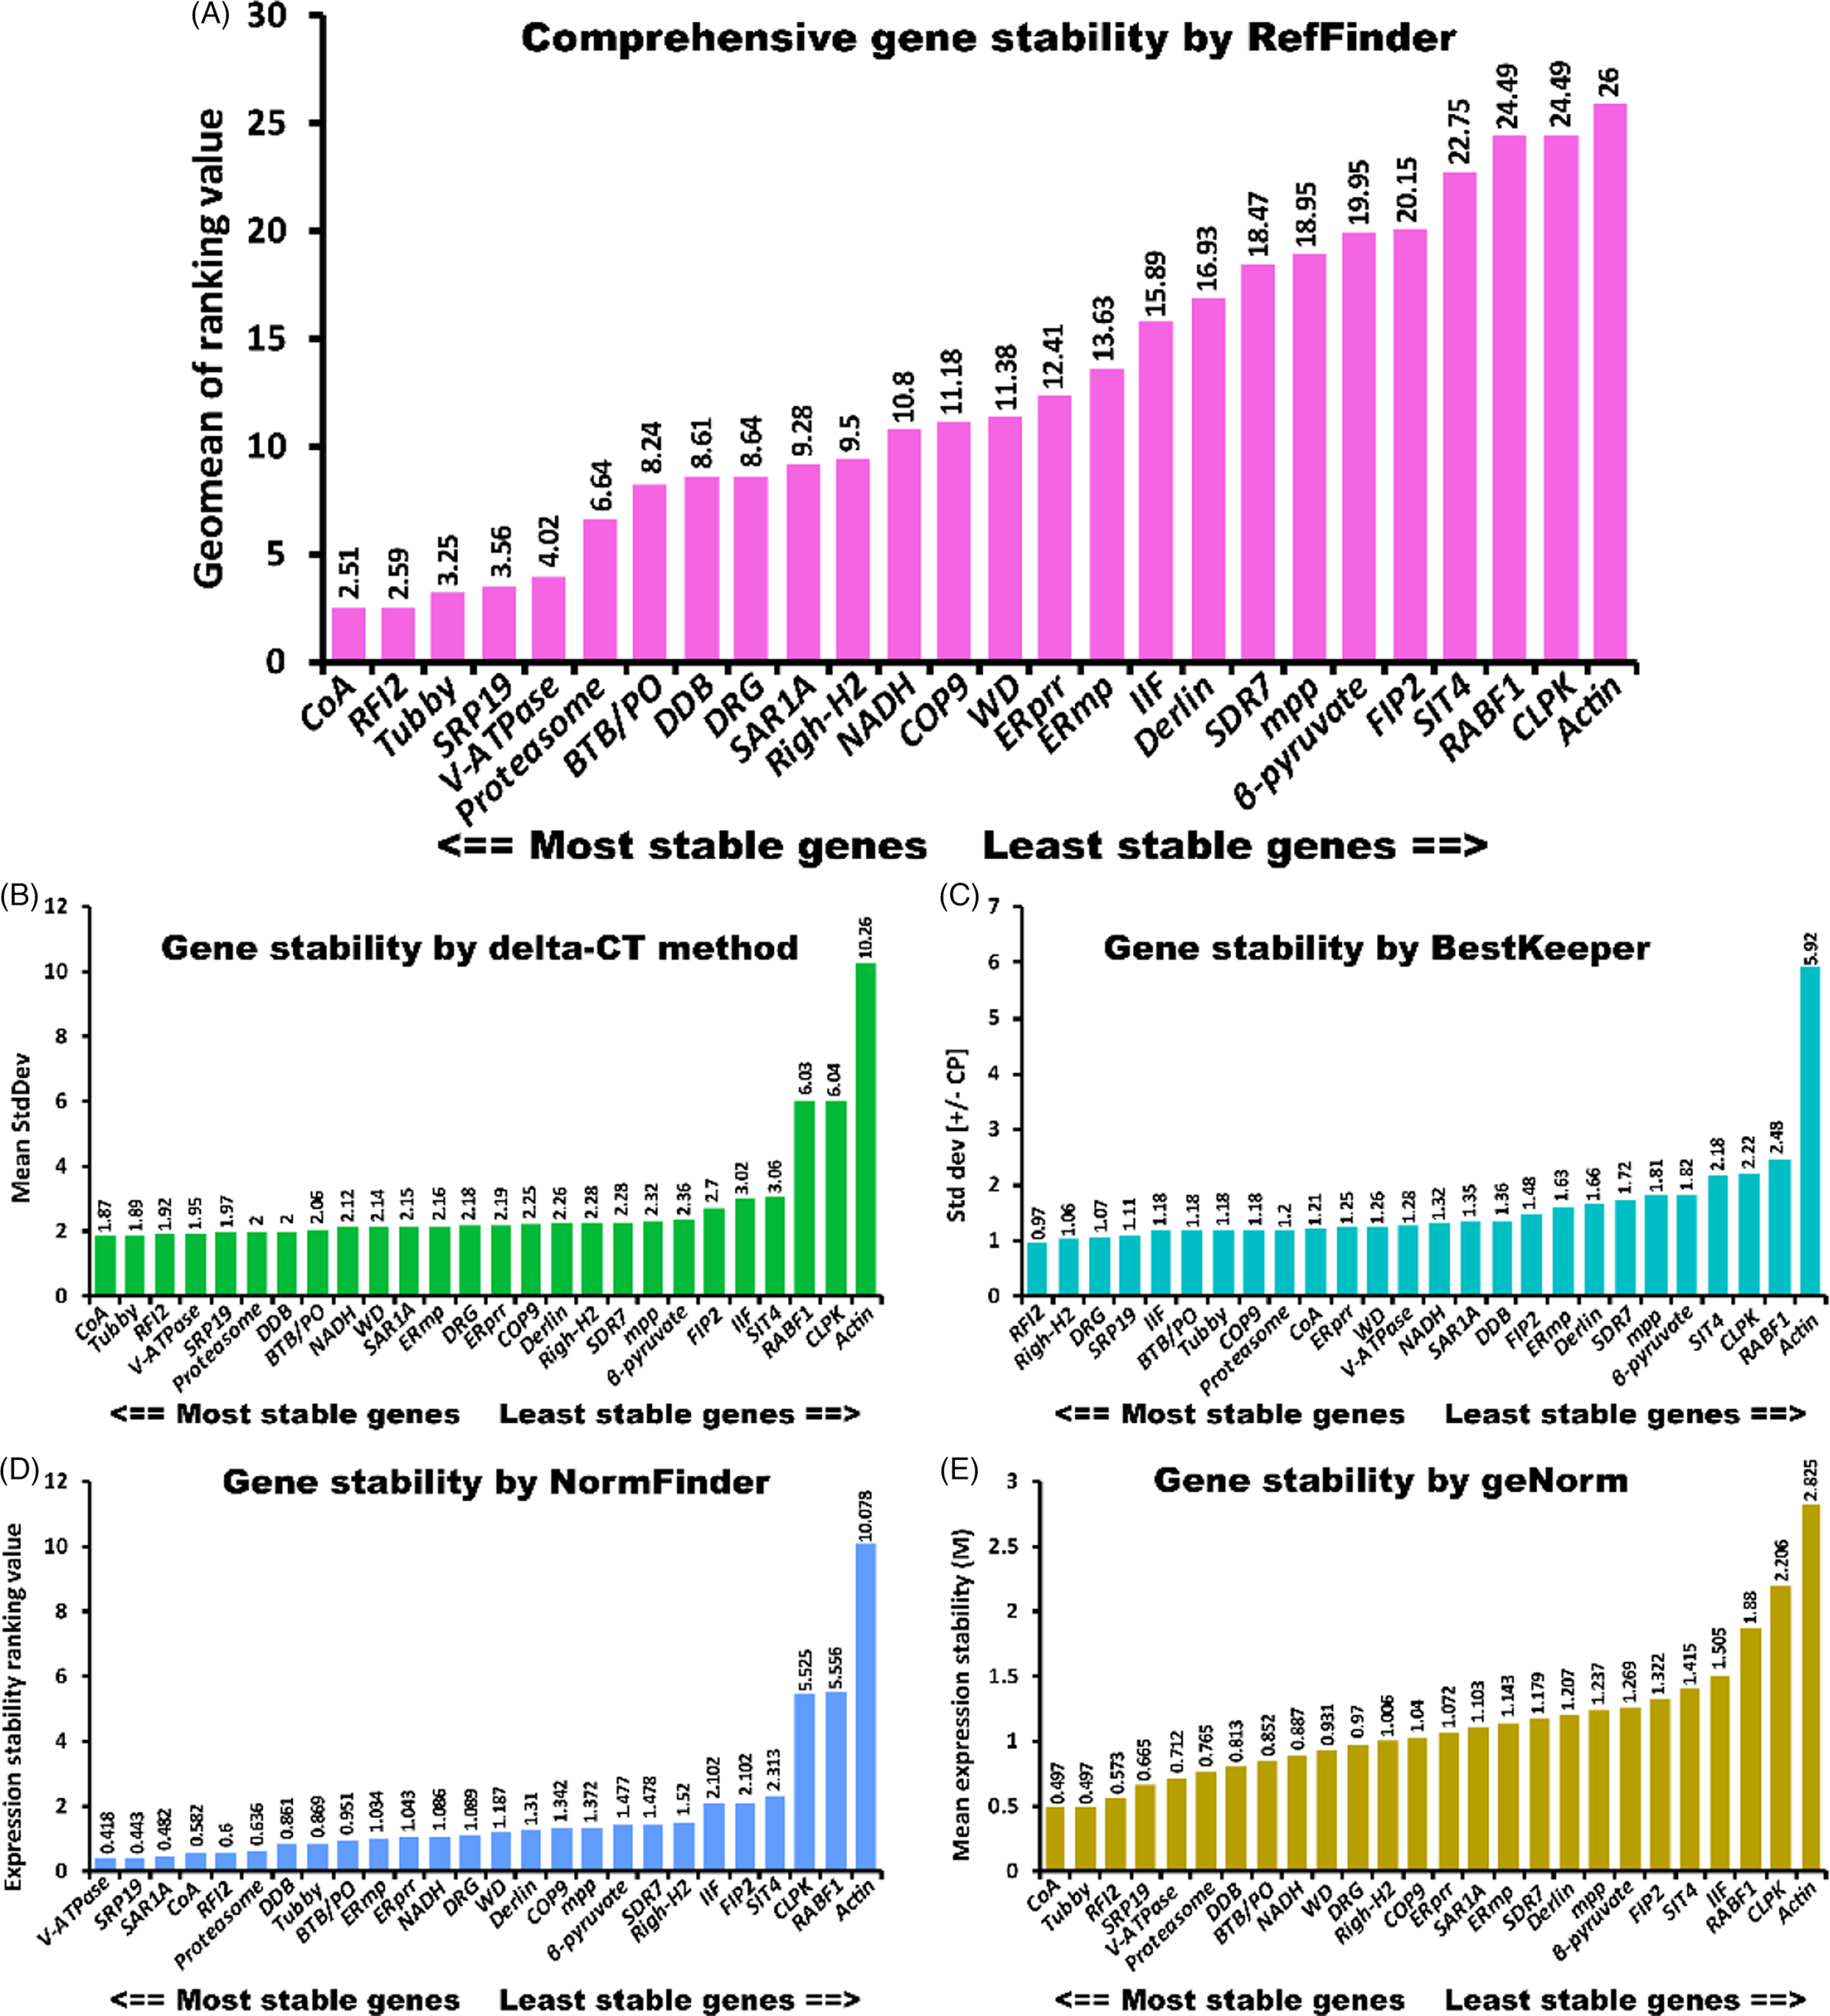
Figure 3. Stability rankings of selected reference genes across samples analyzed using five different statistical algorithms: (A) RefFinder, (B) delta-CT, (C) BestKeeper, (D) NormFinder, and (E) geNorm.
A comprehensive tool, RefFinder (http://fulxie.0fees.us/?type=reference), was developed to generate the final overall ranking of candidate reference genes based on the geometric mean of the weights of every gene calculated by the delta-CT method and the BestKeeper, geNorm, and NormFinder programs (Xie et al. Reference Xie, Xiao, Chen, Xu and Zhang2012). In this study, RefFinder was used to integrate and rank the tested candidate genes comprehensively. The stability ranking order suggested by RefFinder was CoA > RFI2 > Tubby > SRP19 > V-ATPase > Proteasome (Figure 3A). In the present analysis, Actin was determined to be the most unstable reference gene identified by the four algorithms. The qRT-PCR primers for Actin (forward: CATGTTTGAGACCTTCAACACCCC; reverse: GTAGTCTCATGGATACCCGCAGCT) were adopted from a study by Song and Su (Reference Song and Su2013), which produced a 501-bp amplicon. Agarose gel and melting curve analyses showed that the primer for Actin was specific (Supplementary Figure 2). However, as shown by gel electrophoresis and the PCR efficiency results (Table 1), Actin had the lowest efficiency among the primers used in this study (the band was weak, and the PCR efficiency was 93.4). This may partly explain why Actin was more variable than the primers developed in this study. Further analysis in different tissues revealed that Tubby, RFI2, and CoA were ranked as the most stable reference genes in leaf tissues (Figure 4A). Tubby, CoA, and ERprr were ranked as the top three most stable genes in stem tissues, and RFI2, ERprr, and SRP19 were the most stable genes in the roots (Figure 4B and C).
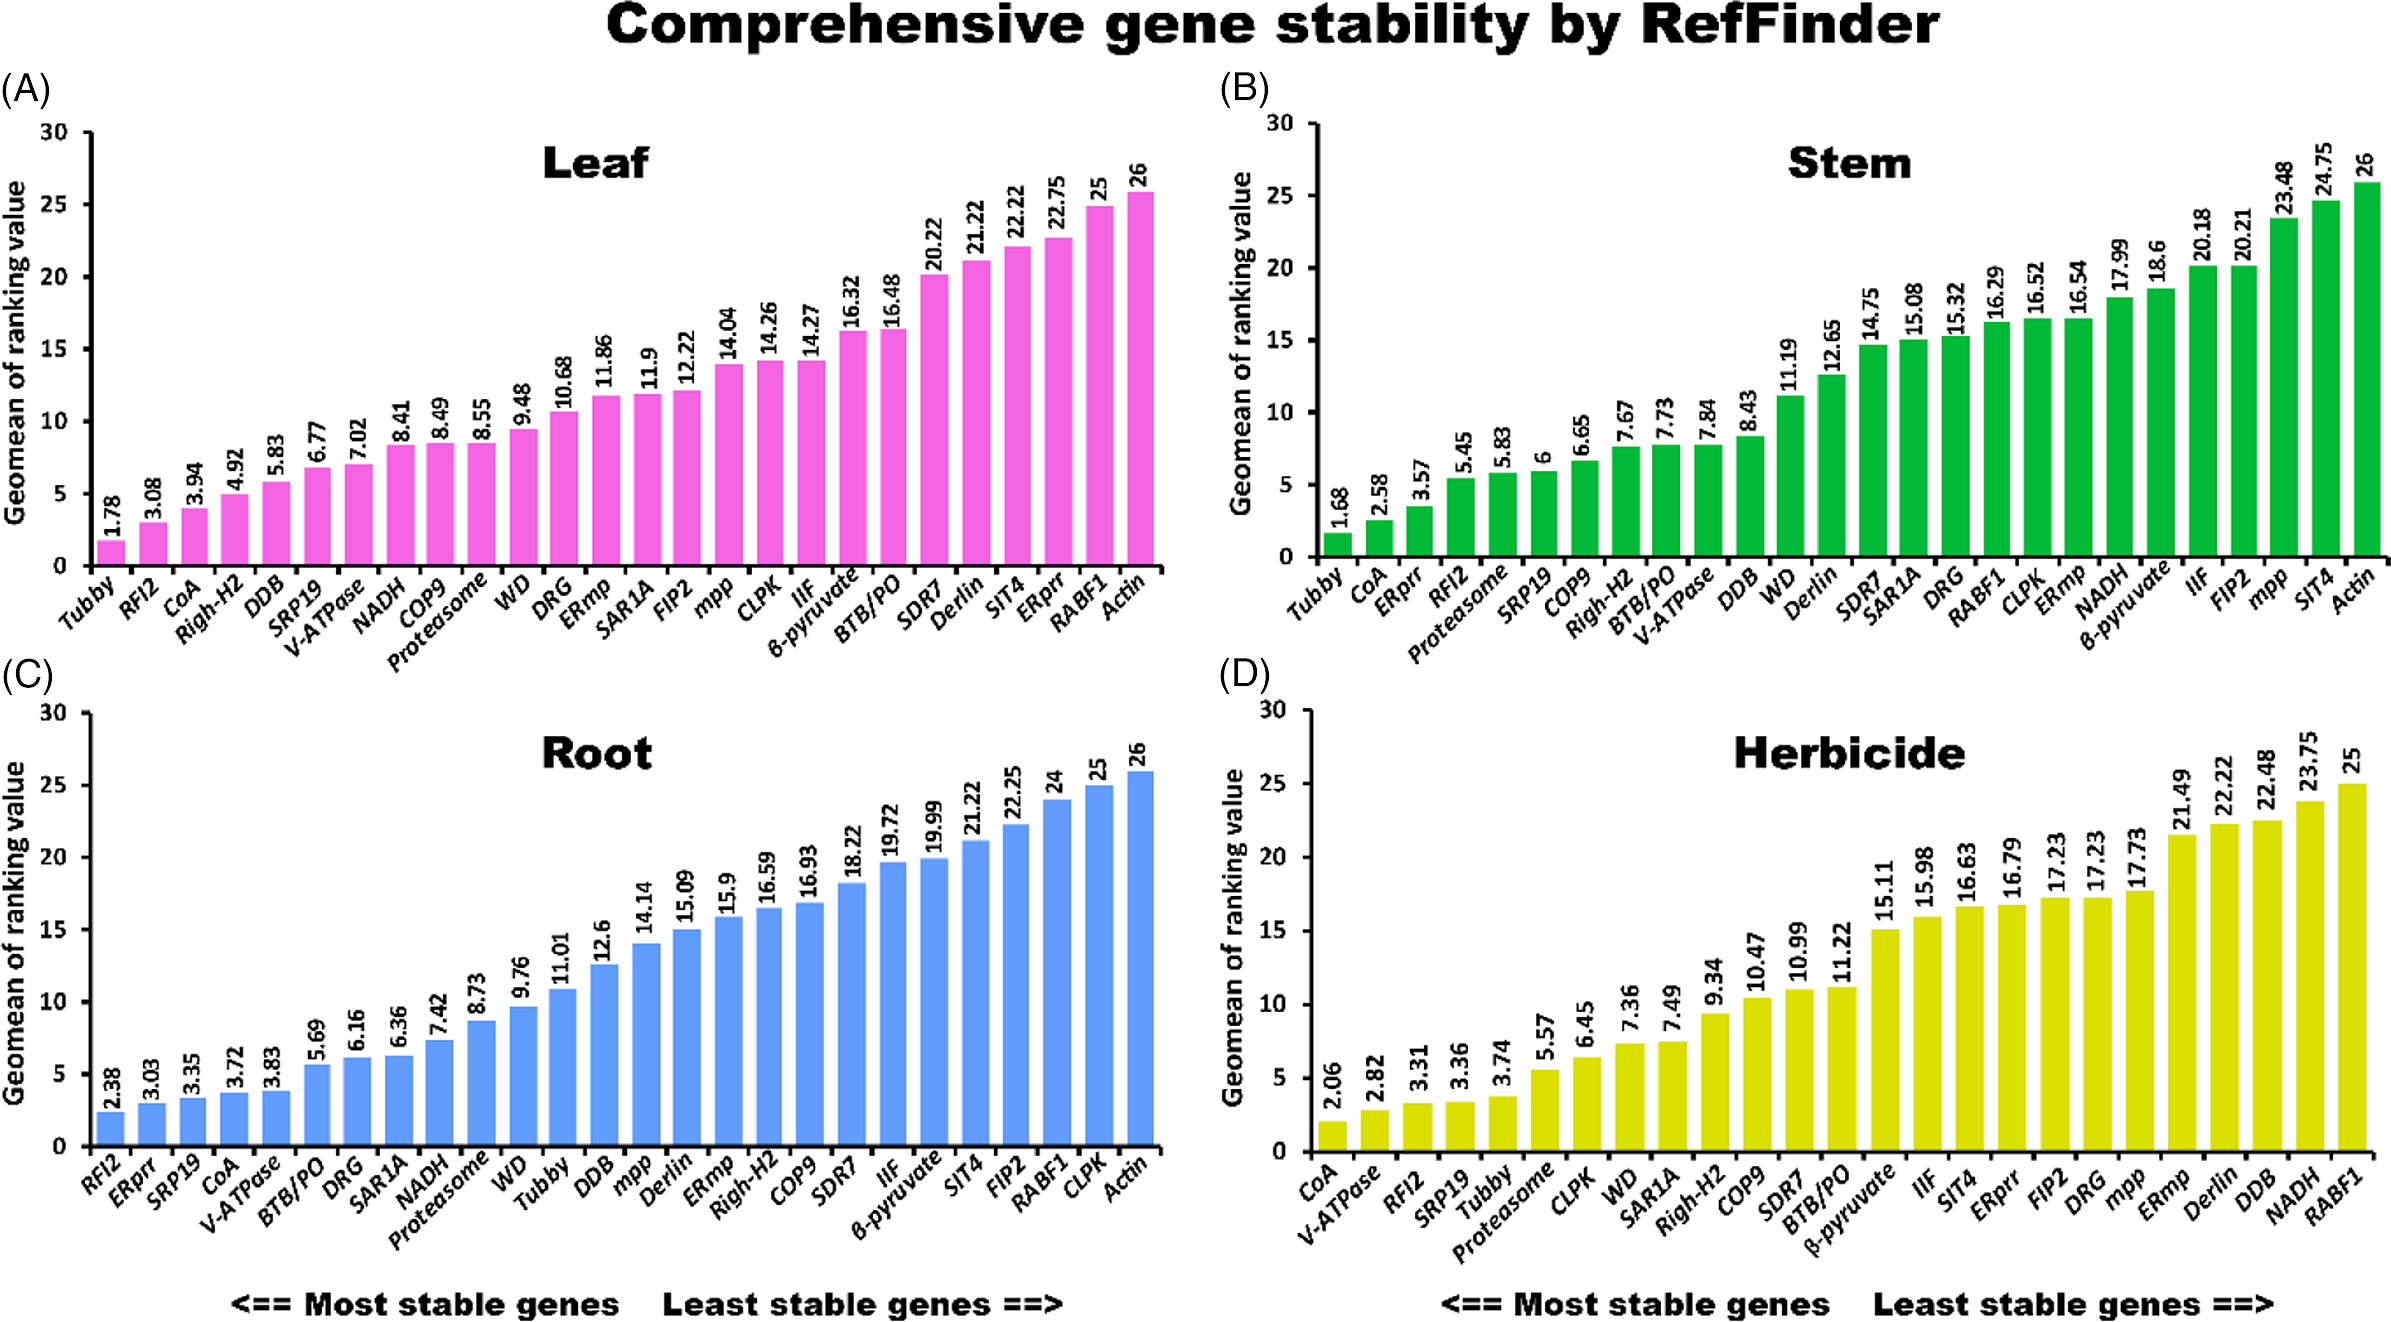
Figure 4. Stability rankings of selected reference genes across (A) leaf, (B) stem, and (C) root tissues. (D) Stability rankings of selected reference genes across leaf and stem tissues treated by five herbicides. RefFinder was used to rank the reference genes.
Previous studies suggested that A. philoxeroides can be effectively managed using herbicides. The underlying molecular mechanisms of A. philoxeroides in response to herbicides have drawn much attention from researchers. However, there have been no reference genes available for gene expression analysis in A. philoxeroides until now. In this study, five herbicides were sprayed on A. philoxeroides to select suitable reference genes for studies with herbicides. The results showed that CoA, V-ATPase, SRP19, RFI2, and Tubby were the top five most stable genes in leaf and stem tissues (Figure 4D; Table 2). These findings will facilitate the study of the interaction between A. philoxeroides and herbicides. The results of this study suggested that the newly discovered reference genes were more stably expressed in A. philoxeroides compared with classic reference genes (Figure 4).
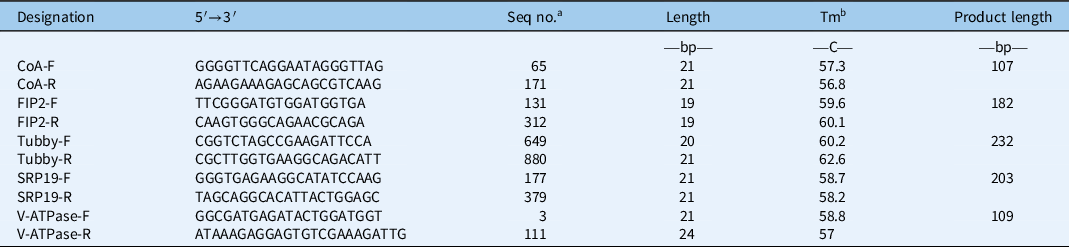
Table 2. Primer information on the top five stable reference genes.

a Seq no., sequence number, the start point of forward primer and the end point of reversed primer in the target sequence.
b Abbreviation: Tm, melting temperature.
In this study, A. philoxeroides tissues were used to evaluate the stability of candidate reference genes. RNA-seq studies were used to identify possible stable control genes for qRT-PCR. Subsequently, the expression stability of candidate reference genes was ranked using four tools, namely, delta-CT, BestKeeper, NormFinder, and geNorm software. Due to the differences in statistical algorithms and analytical procedures, it is understandable that the rankings of candidate reference genes vary depending on the software being used (delta-CT, BestKeeper, NormFinder, geNorm). To determine gene expression stabilities, the average cycle threshold (CT) values from different samples were input into the comprehensive website tool RefFinder, which integrates the currently available major computational programs (delta-CT, BestKeeper, NormFinder, geNorm). According to the resulting overall ranking, CoA, RFI2, Tubby, SRP19, and V-ATPase were the top five ideal reference genes (Figure 3). Tubby, CoA, and ERprr were ranked as the top three stable genes in the stem tissues, and RFI2, ERprr, and SRP19 were the most stable genes in the roots. The identification of optimal reference genes largely contributes to transcript normalization in the invasive weed A. philoxeroides.
Acknowledgments
The authors declare that no conflict of interests exists. This research was supported by the Open Project Program of Engineering Research Center of Ecology and Agricultural Use of Wetland, Ministry of Education (no. KF201909).
Supplementary material
To view supplementary material for this article, please visit https://doi.org/10.1017/wsc.2021.32