


Introduction
Echinochloa spp., including barnyardgrass [Echinochloa crus-galli (L.) P. Beauv.), junglerice [Echinochloa colona (L.) Link], and rice barnyardgrass [Echinochloa phyllopogon (Stapf) Koso-Pol.] are important weeds in rice (Oryza sativa L.) production systems and other agronomic crops across the world (Bakkali et al. Reference Bakkali, Ruiz-Santaella, Osuna, Wagner, Fischer and De Prado2007; Holm et al. Reference Holm, Pancho, Herberger and Plucknett1991). Herbicides are the main tool available to control Echinochloa spp. and have been in use for several decades. As a result, Echinochloa spp. have evolved resistance to several herbicides. For example, E. colona populations in Argentina, Australia, Bolivia, Colombia, Costa Rica, Egypt, El Salvador, Guatemala, Honduras, Iran, Nicaragua, Panama, the United States, and Venezuela have been confirmed resistant to one or more herbicide mechanisms of action, including acetyl-CoA carboxylase inhibitors, acetolactate synthase inhibitors, photosystem II inhibitors, synthetic auxins (cellulose inhibitors), and 5-enolpyruvyl-shikimate-3-phosphate synthase (EPSPS) inhibitor (glyphosate) (Heap Reference Heap2018).
Since 2014, several incidents of failure of glyphosate on E. colona have been reported in the midsouthern U.S. states of Mississippi and Tennessee. Echinochloa colona plants, from populations in Tunica County, MS, that survived one or more field applications of glyphosate at 0.84 kg ae ha−1 (1X rate in Mississippi) were collected from the field and grown in a greenhouse in 2015. Progeny from these plants were screened with glyphosate at 0.84 and 1.68 kg ha−1. Eight plants survived the 0.84 kg ha−1 rate and produced seed (first generation), while none of the plants survived glyphosate at 1.68 kg ha−1. A second series of screening experiments revealed that all progeny of first-generation plants were resistant to the recommended field rate of glyphosate and produced viable seed (second generation), indicating resistance trait heritability. Henceforth, this population is labeled as MSGR.
Preliminary glyphosate dose–response studies under greenhouse conditions indicated that a putative resistant E. colona population from Tennessee, hereafter referred to as TNGR, was only controlled 55% and 84% with glyphosate at 1.92 and 3.85 kg ha−1, respectively, while a susceptible population (TNGS) was controlled 91% and 99% with 0.86 and 1.72 kg ha−1 rates, respectively (Steckel et al. Reference Steckel, Bond, Montgomery, Phillips and Nandula2017). TNGR plants treated with glyphosate at ≤1.72 kg ha−1 produced viable seed. Progeny from TNGR plants that were treated with glyphosate at 0.86 or 1.72 kg ha−1 were grown out to 15-cm height and treated with 1.72 kg ha−1. All of the treated plants survived to produce seed, providing evidence of heritability of the glyphosate-resistance trait in TNGR.
The objectives of this research were to measure the magnitude of resistance and determine the mechanism(s) of resistance to glyphosate in E. colona populations. Whole-plant glyphosate dose–response studies, [14C]glyphosate absorption and translocation studies, and EPSPS gene amplification, expression, and sequencing studies were conducted.
Materials and Methods
Echinochloa colona Populations
Glyphosate-resistant (GR) populations included in this research were MSGR and TNGR. Biotypes derived or selected from the second-generation MSGR population are designated as MSGR4, MSGR27, MSGR34, MSGR36, MSGR44A, MSGR44B, MSGR44C, and MSGR49. Populations susceptible to glyphosate are designated as KSGS and MSGS, which originated from Kansas and Mississippi, respectively.
Planting and Growth Conditions
Stoneville, MS
MSGR and MSGS E. colona seeds were germinated and 2-wk-old seedlings were transplanted into 6 by 6 by 6 cm pots containing a commercial potting mix (Metro-Mix® 360, Sun Gro Horticulture, Bellevue, WA 98008). Pots were maintained in a greenhouse set to 25/20±3 C day/night temperature and a 13-h photoperiod that was provided by high-pressure sodium lights (400 μmol m−2 s−1). Plants were fertilized once with a nutrient solution (Miracle-Gro®, Scotts Company, Marysville, OH 43040) 1 wk after transplanting and subirrigated as needed thereafter.
Manhattan, KS
Seed from nine E. colona accessions (MSGR4, MSGR27, MSGR34, GR44A, MSGR44B, MSGR44C, TNGR, KSGS, and MSGS) were germinated on trays (25 by 15 by 2.5 cm) containing a potting mix (Pro-Mix® Ultimate, Hummert International, Topeka, KS 66618). At 10 d after germination, seedlings (1 pot−1) at the 2-leaf stage (~4- to 5-cm tall) were transplanted into 6.4 by 6.4 by 7.6 cm pots containing the same potting mix. The seedlings were grown in a greenhouse maintained at 25/19 C (day/night) temperatures, 60±5% relative humidity, and 16/9-h day/night photoperiod supplemented with 120 μmol m−2 s−1 illumination provided with sodium-vapor lamps.
Herbicide Application
Stoneville, MS
All glyphosate (Roundup WeatherMax®, Monsanto, St Louis, MO 63167) treatments were applied with a moving nozzle sprayer (Research Track Sprayer, Generation III, De Vries Manufacturing, Hollandale, MN 56045) equipped with 8002E nozzles (Spraying Systems, P.O. Box 7900, Wheaton, IL 60139) delivering 190 L ha−1 at 280 kPa to E. colona plants that were 10-cm tall and at the 3- to 4-leaf stage. At 3 wk after treatment, injury was visually assessed for each plant on a scale of 0% to 100%. A rating of 0% indicated no injury, and 100% indicated plant death, with values in between assessing the degree of injury and growth inhibition.
Manhattan, KS
Ten- to twelve-centimeter tall (~4-leaf stage) uniformly sized seedlings (1 pot−1) were treated with glyphosate (Roundup WeatherMax®) at doses of 0.84 and 1.68 g ae ha−1 with 2% (g L−1) ammonium sulfate using the sprayer described earlier equipped with a flat-fan nozzle tip (80015LP) delivering 168 L ha−1 at 222 kPa at 4.8 km h−1 for resistance confirmation before conducting molecular studies.
Glyphosate Dose Response
Stoneville, MS
The plants of MSGR4 biotype and TNGR and MSGS populations were treated with glyphosate at 0, 0.21, 0.42, 0.84, 1.68, and 3.36 kg ae ha−1. To ensure enough data points for the dose–response curves, a higher rate of 6.72 kg ha−1 was also applied to MSGR4 and TNGR, while a lower rate of 0.11 kg ha−1 glyphosate was included for MSGS. There were three replications per treatment, a replication being 1 pot−1, and the experiment was performed three times. Dose–response work for the other MSGR biotypes was conducted only once and is not reported here.
[14C]Glyphosate Absorption, Translocation, and Phosphorimaging
Stoneville, MS
Three-leaf-stage TNGR and MSGS E. colona plants were transferred from the greenhouse to a growth chamber 7 d before [14C]glyphosate application for acclimatization. The growth chamber was maintained at 25/20 C with a 13-h photoperiod (300 µmol m−2 s−1) provided by fluorescent and incandescent bulbs. Plants were left in the growth chamber until harvest. Plants were not treated with nonradioactive glyphosate. Overspray with glyphosate is recommended when differences between resistant and susceptible weed biotypes are expected to be significant (Shaner Reference Shaner2009). While treatment with nonradioactive glyphosate has been reported before (Lorraine-Colwill et al. Reference Lorraine-Colwill, Powles, Hawkes, Hollinshead, Warner and Preston2003), it has also been omitted elsewhere (Koger and Reddy Reference Koger and Reddy2005).
A solution containing glyphosate at a final concentration of 0.84 kg in 190 L ha−1 was made using [14C]glyphosate ([14C]methyl labeled with 2.0 GBq mmol−1 specific activity; American Radiolabeled Chemicals, 101 Arc Drive, St Louis, MO 63146), a commercial potassium salt formulation of glyphosate, and distilled water. A 10-µl volume of the solution was applied to the adaxial surface of the second fully expanded leaf blade in the form of tiny droplets with a micro-applicator. Each plant received approximately 2.08 kBq of [14C]glyphosate in a total volume of 10 µl. Plants were harvested at 1, 4, 24, and 48 h after treatment (HAT). Thereafter, standard procedures to measure absorption and translocation (Nandula and Vencill Reference Nandula and Vencill2015; Nandula et al. Reference Nandula, Ray, Ribeiro, Pan and Reddy2013) of [14C]glyphosate in E. colona plants were followed as described below.
At each harvest, the treated leaf (TL) was removed and rinsed in 10 ml of 10% methanol for 20 s to remove the nonabsorbed [14C]glyphosate from the leaf surface. Two 1-ml aliquots of the leaf wash were mixed with separate 10-ml scintillation cocktail (Ecolume, ICN, Costa Mesa, CA 92626) volumes to measure nonabsorbed [14C]glyphosate. After the TL was removed, each plant was further divided into shoot above treated leaf (SATL), shoot below treated leaf (SBTL), and roots for measuring translocation. The four plant parts were dried and combusted in a biological oxidizer (Packard Instruments, Downers Grove, IL 60515), and the evolved 14CO2 was trapped in a scintillant cocktail. Radioactivity from leaf washes and oxidations was quantified using liquid scintillation spectrometry (Packard Tri-Carb 2100TR, Packard Instruments). The average recovery of applied [14C]glyphosate was 95%, based on the sum of the radioactivity measured in all plant parts (absorption, expressed as percent of applied 14C) and leaf washes. The total radioactivity recovered in all plant parts except the TL was designated as translocated 14C and expressed as percent of absorbed. There were three replications (1 pot−1) per HAT per population, and the experiment was repeated once.
A separate set of plants from both populations was treated with [14C]glyphosate as described earlier and used for phosphorimaging analysis. At similar HAT time points, the TLs from the plants were removed to wash off unabsorbed radioactivity and set aside. The rest of the plant, including the aboveground parts and roots, was mounted between layers of plain white paper and paper towels, frozen, dried, and cooled to room temperature. The plant was placed in a 20 by 40 cm exposure cassette (GE Healthcare Bio-Sciences, Piscataway, NJ 08854) and brought into contact with a storage phosphor screen (BAS IPSR 2025 E, GE Healthcare Bio-Sciences) under diffused lighting. The apparatus was placed in a dark cabinet for 24 h. A phosphorimager (Typhoon FLA 7000, GE Healthcare Bio-Sciences) was used to detect distribution of [14C]glyphosate and develop an image. There were two replications (a replication being 1 pot−1) per harvest time per population, and the experiment was repeated once.
Genomic DNA Extraction and EPSPS Gene Sequencing
Manhattan, KS
To determine whether any of the known glyphosate resistance–conferring amino acid substitutions at position 102 or 106 of the EPSPS protein were present in the MSGR or TNGR populations, a segment of the EPSPS gene was sequenced. The genomic DNA (gDNA) from MSGR, TNGR, MSGS, and KSGS plants (3 plants per biotype/population) was isolated using Plant DNAzol™ Reagent (Invitrogen™, Thermo Fisher Scientific, 168 Third Avenue, Waltham, MA 02451) according to the manufacturer’s protocol. The quality of gDNA was determined by gel electrophoresis, and the quantity was measured using a NanoDrop 1000 spectrophotometer (Thermo Fisher Scientific, Wilmington, DE 19810). To amplify the EPSPS gene, a polymerase chain reaction (PCR) was performed using a T100™ Thermal Cycler (Bio-Rad, Hercules, CA 94547) on a 50-μl total reaction mixture containing 100 ng of gDNA (2 μl), 0.5 μM each (5 μl) of forward primer (AWF-5′-AACAGTGAGGAYGTYCACTACATGCT-3′) and reverse primer (EC2R1-5′-CCATGAAGGTTTTTCTGCGACT-3′) (Alarcón‐Reverte et al. Reference Alarcón‐Reverte, García, Watson, Abdallah, Sabaté, Hernández, Dayan and Fischer2015; Latasa Reference Latasa2014; Nguyen et al. Reference Nguyen, Malone, Boutsalis, Shirley and Preston2016), 25 μl of Taq 2X PCR Master Mix (Promega, Fitchburg, WI 53711), and 13 μl nuclease-free water to make up the final volume. The following PCR conditions were used: initial denaturation at 95 C for 7 min, followed by 32 cycles of denaturation at 95 C for 45 s, annealing at 58 C for 30 s and extension at 72 C for 1 min, and then a final extension at 72 C for 10 min. The PCR product was purified using a Thermo Scientific™ GeneJET™ PCR Purification Kit following the manufacturer’s guidelines. The purified gene fragment was Sanger sequenced by Genewiz (South Plainfield, NJ 07080). The gene sequences were analyzed and aligned using SnapGene® software (GSL Biotech, Chicago, IL 60615; available at snapgene.com) and MultAlin software (Corpet Reference Corpet1988).
Stoneville, MS, and Urbana-Champaign, IL
Procedures like those described earlier were used in Stoneville, MS, and Urbana-Champaign, IL, to extract genomic DNA, amplify the EPSPS gene, and sequence amplicons. Briefly, leaf tissue was collected, freeze-dried, and ground to a fine powder. DNA was extracted using a Maxwell A Maxwell 16™ (Promega) automated DNA-isolation machine employing Promega AS1030 Tissue DNA Purification Kits. Agarose gel–purified amplicons were cloned using a TOPO TA Cloning® Kit (Invitrogen, Carlsbad, CA 92008) and sequenced at the USDA-ARS Southeast Area Genomics Facility at Stoneville, MS. Sequences were analyzed using Sequencher (v. 5.4.5, Gene Codes, Ann Arbor, MI 48108) software. Partial EPSPS gene of E. colona plants from MSGR (first generation; see “Introduction”) and MSGS populations was amplified using a forward primer (EleuEPSPSF-5′-GCGGTAGTTGTTGGCTGTGGTG-3′) and reverse primer (EleuEPSPSR-5′-TCAATCCGACAACCAAGTCGC-3′) (Han et al. Reference Han, Yu, Widderick and Powles2016). The primers were intended to amplify the regions covering the Pro-106 codon in susceptible and resistant plants. The same primers were also used for analyses of second-generation MSGR biotypes, TNGR, and MSGS populations.
Quantitative PCR to Determine Relative EPSPS Copy Number
Manhattan, KS
To determine whether any amplification of the EPSPS gene is present in MSGR or TNGR populations, real-time quantitative PCR (qPCR) was performed. The gDNA extracted from all GR or GS E. colona (the same samples described earlier) was used to perform a quantitative PCR (StepOnePlusTM real-time detection system, Life Technologies, Grand Island, NY 14072) with β-tubulin as a reference gene (Godar et al. Reference Godar, Varanasi, Nakka, Prasad, Thompson and Mithila2015) in a 96-well microtiter plate containing a Master Mix of 8 µl of Power SYBR Green (Life Technologies), 2 µl each of forward and reverse primers (5 µM), 2 µl of gDNA (16 ng µl−1), for a total reaction volume of 14 µl. The gene-specific forward primer (EPSPS LOLF-5′-CTGATGGCTGCTCCTTTAGCTC-3′) and reverse primer (EPSPS LOLR-5′-CCCAGCTATCAGAATGCTCTGC-3′) (Salas et al. Reference Salas, Dayan, Pan, Watson, Dickson, Scott and Burgos2012) that are expected to amplify a 136-bp fragment were used. The following primer sequences for the reference gene β-tubulin (forward: -5′ATGTGGGATGCCAAGAACATGATGTG3′; and reverse: -5′-TCCACTCCACAAAGTAGGAAGAGTTCT-3′) were used. A minimum of three technical replicates of each sample was used in each experiment, and each experiment was repeated. The following qPCR conditions were maintained: initial denaturation at 94 C for 10 min, followed by denaturation at 94 C for 30 s and annealing at 60 C for 45 s repeated for 40 cycles. To determine the primer specificity in the reaction, a melt-curve analysis was included at the end of the procedure. Single curves were observed for both the β-tubulin and EPSPS primers. The relative copy number of EPSPS was determined by the comparative Ct method (as 2−ΔCt) (Schmittgen and Livak Reference Schmittgen and Livak2008), where △Ct=[Ct EPSPS – Ct β-tubulin]. β-tubulin was used as a reference gene for normalizing the copy number data (Pfaffl Reference Pfaffl2001). The glyphosate-susceptible (MSGS1) sample, which has a single copy of EPSPS, was used for calibrating the copy number. The copy number was averaged across the replications, and the standard deviation was calculated for each plant sample.
Statistical Analysis
All experiments were conducted using a completely randomized design. Data from all experiments, with the exception of the EPSPS sequence analysis and gene copy number, were analyzed by ANOVA via the PROC GLM statement using SAS software (v. 9.2, SAS Institute, 100 SAS Campus Drive, Cary, NC 27513). Data from repeated experiments were pooled due to a nonsignificant experiment effect. Nonlinear regression analysis was applied to fit a sigmoidal log-logistic curve of the form:
 $$y{\equals}a\,/\,\left\{ {1{\plus}{\rm exp}\left[ {{\minus}\left( {x{\minus}x_{0} } \right)\,/\,b} \right]} \right\}$$
where a is an asymptote, x and x 0 are the upper and lower response limits with the latter approaching 0, and b is the slope of the curve around x 0, to relate the effect of glyphosate dose on E. colona control. Equation parameters were computed using SigmaPlot (v. 11.0, Systat Software, 1735 Technology Drive #430, San Jose, CA 95110). Treatment means in selected experiments were separated using Fisher’s protected LSD at P=0.05.
Results and Discussion
Whole-Plant Response to Glyphosate
Stoneville, MS
Response of E. colona biotypes and populations to glyphosate dose is presented in Figure 1. ED50 (dose required to reduce plant growth by 50%) values for the MSGR4 biotype, TNGR, and MSGS populations were 0.8, 1.62, and 0.23 kg ha−1 of glyphosate, respectively. The resistance index calculated from the above ED50 values indicated that the MSGR4 biotype and TNGR population were 4- and 7-fold resistant, respectively, relative to the MSGS population. The resistance levels reported here are higher than those reported from northeastern Australia (2- to 2.5-fold) (Han et al. Reference Han, Yu, Widderick and Powles2016), but lower than those reported from northwestern Australia (8.3-fold) (Gaines et al. Reference Gaines, Cripps and Powles2012). Echinochloa colona accessions from a corn (Zea mays L.) field in California were 6.6-fold (Alarcón‐Reverte et al. 2013) and 4- to 9-fold (Alarcón‐Reverte et al. Reference Alarcón‐Reverte, García, Watson, Abdallah, Sabaté, Hernández, Dayan and Fischer2015) resistant to glyphosate. Response of E. colona to glyphosate has been shown to be dependent on temperature and growing conditions (Han et al. Reference Han, Yu, Widderick and Powles2016; Nguyen et al. Reference Nguyen, Malone, Boutsalis, Shirley and Preston2016). Therefore, the level of resistance to glyphosate in E. colona is better measured under conditions similar to the natural environment when E. colona emerges and is at the correct growth stage for labeled applications of glyphosate.
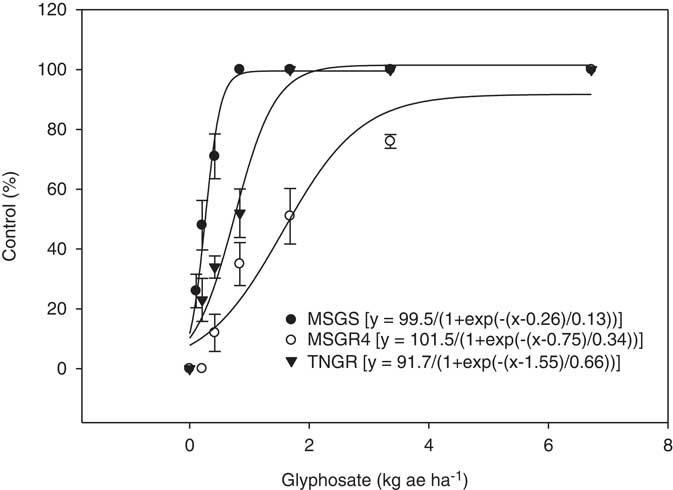
Figure 1 Glyphosate dose response on control of glyphosate-resistant (TNGR population and MSGR4 biotype) and glyphosate-susceptible (MSGS) Echinochloa colona populations 3 wk after treatment. Vertical bars represent standard error of mean.
[14C]Glyphosate Absorption, Translocation, and Phosphorimaging
Stoneville, MS
The absorption patterns of [14C]glyphosate in the TNGR and MSGS populations were similar throughout the time course of the experiment. About 55% and 53% of applied [14C]glyphosate was detected at 48 HAT for the TNGR and MSGS biotypes, respectively (Table 1). Nguyen et al. (Reference Nguyen, Malone, Boutsalis, Shirley and Preston2016) reported similar levels of [14C]glyphosate absorption between resistant and susceptible E. colona populations from Australia within each of two temperature regimes. Further, there were no differences in [14C]glyphosate uptake between resistant and susceptible E. colona plants from California (Alarcón‐Reverte et al. 2013).
Table 1 Absorption, translocation, and distribution of [14C]glyphosate in resistant and susceptible Echinochloa colona populations.Footnote a , Footnote b

a Abbreviations: HAT, h after treatment; SATL, shoot above treated leaf; SBTL, shoot below treated leaf; TL, treated leaf.
b Similar and different letters indicate no difference and significant difference, respectively, between population means for the same parameter (absorption, translocation, or distribution) within the same harvest time according to Fisher’s LSD at 5% level of probability. For example, translocation of absorbed [14C]glyphosate between the two populations is different at 48 HAT.
c Distribution represents partitioning of absorbed [14C]glyphosate between the TL, SATL, SBTL, and roots.
d [14C]glyphosate outside of TL (SATL, SBTL, and roots) was considered as translocation.
The translocation pattern of [14C]glyphosate was similar between the TNGR and MSGS plants up to 24 HAT (Table 1). Thereafter, the MSGS population (30.2% of absorbed) translocated nearly 13% more [14C]glyphosate out of the TL compared with the TNGR population (17.3% of absorbed) at 48 HAT. Alarcón‐Reverte et al. (2013) reported no difference in translocation levels of [14C]glyphosate between resistant and susceptible E. colona populations from California.
The above pattern is indicative of a mechanism of glyphosate resistance because of reduced translocation, which was reported in several resistant weed species such as hairy fleabane [Erigeron bonariensis L.] (Dinelli et al. Reference Dinelli, Marotti, Catizone, Bonetti, Urbano and Barnes2008), horseweed (Erigeron canadensis L.) (Dinelli et al. Reference Dinelli, Marotti, Bonetti, Minelli, Catizone and Barnes2006; Feng et al. Reference Feng, Tran, Chiu, Sammons, Heck and CaJacob2004; Koger and Reddy Reference Koger and Reddy2005), Italian ryegrass [Lolium perenne L. ssp. multiflorum (Lam.) Husnot] (Nandula et al. Reference Nandula, Reddy, Poston, Rimando and Duke2008; Perez-Jones et al. Reference Perez-Jones, Park, Polge, Colquhoun and Mallory-Smith2007), rigid ryegrass (Lolium rigidum Gaudin) (Lorraine-Colwill et al. Reference Lorraine-Colwill, Powles, Hawkes, Hollinshead, Warner and Preston2003; Wakelin et al. Reference Wakelin, Lorraine-Colwill and Preston2004), and waterhemp [Amaranthus tuberculatus (Moq.) J. D. Sauer] (Nandula et al. Reference Nandula, Ray, Ribeiro, Pan and Reddy2013). The glyphosate translocation model proposed by Shaner (Reference Shaner2009), which hypothesized the existence of a barrier at the cellular level preventing glyphosate loading into the phloem, may have a role in the resistant TNGR population. The glyphosate in the TNGR plants could possibly be loaded into vacuoles via a system akin to the sequestration mechanism described in E. canadensis (Ge et al. Reference Ge, d’Avignon, Ackerman and Sammons2010) and Lolium spp. (Ge et al. Reference Ge, d’Avignon, Ackerman, Collavo, Sattin, Ostrander, Hall, Sammons and Preston2012).
Distribution of absorbed [14C]glyphosate in the TNGR and MSGS populations is summarized in Table 1. The quantity of [14C]glyphosate that accumulated in various parts of the plant was similar between the TNGR and MSGS populations at respective harvest times after treatment, except for the TL, SATL, and roots at 48 HAT, and SBTL and roots at 24 HAT. At 48 HAT, the TNGR plants (82.7% of absorbed) had more [14C]glyphosate remaining in the TL than the MSGS plants (69.8% of absorbed). Additionally, the level of [14C]glyphosate that translocated to the SATL was lower in the TNGR population (1.7% of absorbed) compared with the MSGS population (3.7% of absorbed). It was intriguing to realize that the resistant TNGR population accumulated more [14C]glyphosate in the SBTL tissues (11.1% of absorbed) than the MSGS population (7.5% of absorbed). This could have been due to an inherent machinery in the TNGR plants to divert glyphosate away from the growing point (part of SATL) and prevent its accumulation at phytotoxic levels. Whether the accumulated glyphosate was being loaded into vacuoles is unknown, but an interesting possibility. The MSGS roots acquired more [14C]glyphosate than the TNGR roots, resulting in 11% and 15.8% of absorbed compared with 4.5% and 3.6% of absorbed at 24 and 48 HAT, respectively. Overall, the distribution data support the translocation data, in that the TNGR population translocated more [14C]glyphosate at 48 HAT than the MSGS population, as reflected in the differences between the respective TL, SATL, and roots at 48 HAT.
Phosphorimaging results (Figure 2) also corroborate the translocation and especially the distribution results at 48 HAT. The phosphorimages of the TNGR (Figure 2A and B) and MSGS plants (Figure 2E and F) were similar at 1 and 4 HAT. At 24 HAT, [14C]glyphosate had accumulated throughout the MSGS plant (Figure 2C), whereas the TNGR plant exhibited movement of glyphosate from the TL to SBTL and roots only. At 48 HAT, the TNGR plant (Figure 2H) clearly had restricted movement of [14C]glyphosate compared with the MSGS plant (Figure 2D), where even the leaf and root tips seemed to have gathered glyphosate.
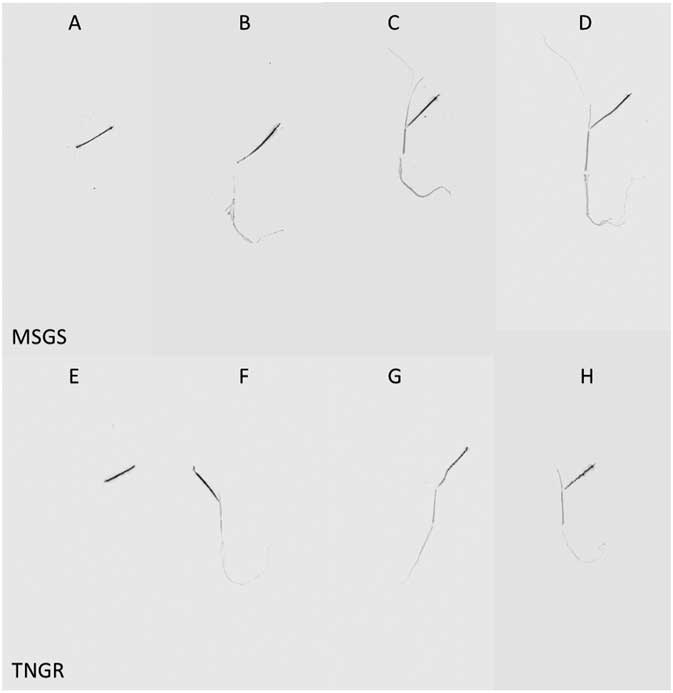
Figure 2 Phosphorimages of Echinochloa colona plants from the susceptible MSGS (top row) and resistant TNGR (bottom row) populations treated with [14C]glyphosate at 1 (A, E), 4 (B, F), 24 (C, G), and 48 (D, H) HAT (left to right columns). The darkest areas indicate the treated area of the second fully expanded leaf.
EPSPS Gene Sequencing
Manhattan, KS
Single-nucleotide mutation(s) at residues 102 or 106 in the EPSPS protein resulting in the substitution of amino acids has been reported to reduce glyphosate binding at the target site, conferring low- or high-level glyphosate resistance, respectively (Powles and Preston Reference Powles and Preston2006; Yu et al. Reference Yu, Jalaludin, Han, Chen, Sammons and Powles2015). The EPSPS gene sequence analyses of TNGR E. colona (NCBI accession number: JN004269.1, JN004268.1) indicated no evidence of any point mutation(s) at 102 or 106 (Figure 3). However, in all MSGR biotypes, a single-nucleotide substitution of T for C at codon 106 position was identified, conferring a predicted proline-to-serine substitution (CCA to TCA) (Figure 3).

Figure 3 Nucleotide sequence alignment of EPSPS gene fragment from glyphosate-susceptible (KSGS and MSGS) and glyphosate-resistant (MSGR and TNGR) Echinochloa colona. Known resistance-conferring mutations at codons 102 and 106 are indicated (codon numbering based on the Arabidopsis thaliana EPSPS gene sequence). Three plants from each population were used for sequence analysis. ACT, threonine; CCA, proline; TCA, serine.
Urbana-Champaign, IL, and Stoneville, MS
Similar results were obtained in Urbana-Champaign, where the Pro-106-Ser change was detected in the MSGR4, MSGR27, MSGR34, MSGR36, MSGR49, and MSGR44A biotypes (unpublished data). Further, in Stoneville, several first-generation accessions were found to have one or more alleles corresponding to the EPSPS gene with the serine replacement at the 106 position (unpublished data). These results suggest that the EPSPS enzyme may not be sensitive to glyphosate in MSGR biotypes, confirmable by an EPSPS assay, and that another mechanism of resistance to glyphosate is in play in the TNGR population. The first case of a Pro-106-Ser target-site mutation associated with glyphosate resistance in E. colona was reported from California (Alarcón-Reverte et al. Reference Alarcón-Reverte, García, Urzúa and Fischer2013). In a newer report, two mutations, Pro-106-Ser and Pro-106-Thr, were reported in an E. colona population, also from California (Alarcón-Reverte et al. 2015). Han et al. (Reference Han, Yu, Widderick and Powles2016) confirmed Pro-106-Thr and Pro-106-Leu in E. colona from Australia. It is interesting that our report and all other previously documented Pro-106 substitutions have occurred in the past 5 yr.
EPSPS Gene Copy Number
Manhattan, KS
The results of qPCR analyses suggest that there is no variation in relative EPSPS gene copies between resistant and susceptible E. colona (Figure 4). Amplification of the EPSPS gene does not confer resistance to glyphosate in these populations.

Figure 4 The EPSPS gene copy numbers of glyphosate-resistant (MSGR and TNGR) and glyphosate-susceptible (MSGS1 and KSGS1) Echinochloa colona. The relative EPSPS gene copy numbers were calculated using sample MSGS1. Error bars represent the standard error of the mean (n=3 technical replicates). The β-tubulin gene was used as a reference to normalize the qPCR data.
In summary, E. colona populations from Mississippi and Tennessee have been confirmed to be 4- and 7-fold resistant to glyphosate, respectively. The mechanism of resistance in the MSGR population (and associated biotypes) is, at least in part, due to a mutation at the 106th loci of the EPSPS protein, resulting in replacement of proline with a serine residue. Other glyphosate-resistance mechanisms such as sequestration and differential translocation could have a role but were not investigated in the MSGR population. The TNGR population exhibited a reduced translocation mechanism of resistance to glyphosate. An E. colona population from Mississippi was recently reported to be resistant to herbicides spanning four unique mechanisms of action, but not glyphosate (Wright et al. Reference Wright, Nandula, Grier, Showmaker, Bond, Peterson, Ray and Shaw2016, Reference Wright, Rodriguez-Carres, Sasidharan, Koski, Peterson, Nandula, Ray, Bond and Shaw2018), thereby indicating the expanding problem of resistance to a broad spectrum of herbicides in E. colona populations from the midsouthern U.S. states of Mississippi, Tennessee, and Arkansas. Han et al. (Reference Han, Yu, Widderick and Powles2016) observed that a field use rate of glyphosate at 0.45 kg ha−1 controlled E. colona plants resistant to glyphosate and carrying two EPSPS mutations under day/night temperatures of 25/20 C, but not at 35/30 C, wherein 68% of mutant resistant plants survived. The reports cited and research results presented here indicate the necessity of developing E. colona management strategies that include chemical, cultural, and mechanical tools.
Acknowledgments
This work was supported by USDA–ARS project number 6066-21000-060-00D. The technical assistance of Earl Gordon is very much appreciated. This work was also partially supported by the Tennessee Soybean Promotion Board and Cotton Incorporated (for partial support of a technician). No conflicts of interest have been declared.


