


Introduction
Rice (Oryza sativa L.) is a staple food for 4 billion people. Conventionally, rice is grown under season-long flooded conditions with 7.12 million kg of herbicide application per year in the United States alone (Gianessi and Reigner Reference Gianessi and Reigner2007; Gianessi and Sankula Reference Gianessi and Sankula2003). Thus, weeds and water are two important factors, along with other stressors such as disease, insects, and poor soil health and nutrition, that limit sustainable rice production worldwide. Among all pests, weeds have been estimated to be the greatest threat to rice worldwide, having the potential to inflict an average crop loss of 37% (Oerke Reference Oerke2006). In a landmark review of crop losses due to weeds in the United States, Bridges and Bauman (Reference Bridges, Bauman and Bridges1992) estimated that annual losses to weeds in the South were $45 million when best practices were employed and that these losses could increase more than 10-fold (to $640 million) if herbicides were eliminated entirely from these systems. In a recent study, Brim-DeForest et al. (Reference Brim-DeForest, Al-Khatib and Fischer2016) found that, among three major groups of weeds (grasses, sedges, and broadleaves) that infest rice crops, the grasses were highly associated with rice grain yield loss. Barnyardgrass [Echinochloa crus-galli (L.) P. Beauv.] is among the most problematic of these grass species (Bridges and Bauman Reference Bridges, Bauman and Bridges1992; Webster Reference Webster2000). Controlling weeds in rice fields, especially E. crus-galli, is a major cost to farmers in the southern United States every year, due to both expenditures for herbicide application and grain yield losses when the weeds are not controlled. In the United States, the most common herbicides used to control E. crus-galli are: quinclorac, propanil, fenoxaprop, cyhalofop, and clomazone. Recent studies have suggested that some agricultural chemicals might alter the soil microbiome in unexpected ways (Newman et al. Reference Newman, Hoilett, Lorenz, Dick, Liles, Ramsier and Kloepper2016; Soil Association 2018), potentially affecting the environment, especially in the vicinity of rice fields (Bzour et al. Reference Bzour, Zuki and Mispan2018), thus emphasizing the need for supplemental or alternative weed management practices such as integrated weed management (IWM).
Rice genotypes that suppress weeds naturally through either allelopathic mechanisms or increased competitiveness have the potential to contribute to IWM systems that would reduce reliance on synthetic herbicides while maintaining adequate management of weeds. Many such genotypes have been investigated throughout the world (Chen et al. Reference Chen, Hu and Kong2008; Kato-Noguchi and Ino Reference Kato-Noguchi and Ino2005; Khanh et al. Reference Khanh, Xuan and Chung2007; Kong et al. Reference Kong, Li, Hu, Xu and Wang2006, Reference Kong, Chen, Hu and Zhang2011; Seal and Pratley Reference Seal and Pratley2010; Thi et al. Reference Thi, Lin, Smeda, Leigh, Wycoff and Fritschi2014; Worthington and Reberg-Horton Reference Worthington and Reberg-Horton2013), and a few have been evaluated in the southern United States (Gealy et al. Reference Gealy, Wailes, Estorninos and Chavez2003, Reference Gealy, Estorninos, Gbur and Chavez2005, Reference Gealy, Moldenhauer and Duke2013a; Gealy and Moldenhauer Reference Gealy and Moldenhauer2012; Watkins et al. Reference Watkins, Gealy, Anders and Mane2018). However, none of these has been tested under alternate-wetting-and-drying(AWD) irrigation systems in the southern United States.
A current challenge with rice is to improve grain yields while confronting reduced water resources and attempting to minimize use of herbicides and other agricultural chemicals. According to a study conducted with conventional flood (FLD) irrigation, the water usage for Arkansas rice production was 822 mm per growing season (Henry et al. Reference Henry, Hirsh, Anders, Vories, Reba, Watkins and Hardke2016). Such heavy use of water for rice production has contributed to a rapid decline in the water table of underground aquifers and is causing rice producers to modify their irrigation practices to include methods such as AWD (Reba et al. Reference Reba, Daniels, Chen, Sharpley, Bouldin, Teague, Daniel and Henry2013). For sustainable production of rice, farmers need to grow more rice per hectare while pumping far less water from underground aquifers and using more rainwater. Countries such as India, Indonesia, Vietnam, Thailand, Myanmar, and the Philippines, use substantially larger fractions of recyclable water compared with the United States, where the irrigation water for rice production is pumped heavily from aquifers. Thus, to improve the sustainability of rice production, an innovative research focus on developing new germplasm adapted to reduced irrigation management has emerged. AWD is an irrigation system that can reduce the water footprint of rice production, reduce methane emission from rice paddies, and reduce arsenic levels in rice grains (Yang et al. Reference Yang, Zhou and Zhang2017). In recent years, AWD irrigation systems have been gaining popularity among rice farmers in the United States and the rest of the world, due to their efficient water management potential and ability to meet sustainable rice production demands (de Avila et al. Reference de Avila, Martini, Mezzomo, Refatti, Campos, Cezimbra, Machado, Massey, Carlesso and Marchesan2015; Massey et al. Reference Massey, Walker, Anders, Smith and Avila2014).
Certain indica-type rice genotypes from Asia have been shown to suppress E. crus-galli effectively under FLD irrigation systems in the southern United States (Gealy et al. Reference Gealy, Moldenhauer and Duke2013a), but little is known about their weed-suppression potential under AWD or other reduced irrigation systems (Gealy et al. Reference Gealy, Anders, Watkins and Duke2014). Moreover, most of the rice cultivars currently grown commercially in the United States are tropical japonica (TRJ) types with desirable traits such as high grain yield and milling quality or blast disease resistance and were not bred to grow profitably or sustainably under either AWD or with significant competition from weeds.
Considering the situation described earlier, a major current focus of rice improvement programs in the United States is identification and selection of superior-performing germplasm and cropping practices that can withstand weed competition and deficit irrigation systems with the least reduction in grain yield. Rice cultivar development and changing rice production practices employed by rice breeders and growers in the near future will greatly benefit from the availability of suitable germplasm and varieties that can withstand and perform comparatively better under deficit irrigation systems, while at the same time, maintaining levels of weed control and grain yield potential that are similar to or better than those presently attainable in conventional flooded systems. Several reports were published recently that addressed these two problems separately (Carrijo et al. Reference Carrijo, Lundy and Linquist2017, Reference Carrijo, Akbar, Reis, Li, Gaudin, Parikh, Green and Linquist2018; de Avila et al. Reference de Avila, Martini, Mezzomo, Refatti, Campos, Cezimbra, Machado, Massey, Carlesso and Marchesan2015; Gealy and Duke Reference Gealy and Duke2017). Our study addresses this existing knowledge gap for combined water and weed stress management. This study was initiated with the objective to compare efficiency of rice genotypes from diverse genetic backgrounds for weed suppression and grain yield potential under FLD and AWD water management.
Materials and Methods
Replicated field experiments on seven diverse rice genotypes (Table 1) were conducted in 2012, 2013, and 2014 at the Dale Bumpers National Rice Research Center and University of Arkansas Rice Research and Extension Center located near Stuttgart, AR (34.49°N, 91.55°W). The soil was a DeWitt silt loam (fine smectitic, thermic, Typic Albaqualfs) with 1.2% organic matter and a pH of 5.8, as described previously (Gealy and Fischer Reference Gealy and Fischer2010; Gealy and Moldenhauer Reference Gealy and Moldenhauer2012).
Table 1. Details of the pedigrees and basic agronomic traits of the rice genotypes that were used in this study.

a TRJ, tropical japonica; indica-TRJ line (STG06L-35-061) resulted from a bulk of selected F5 plants.
All rice entries were grown in paired, adjacent plots with E. crus-galli and without E. crus-galli, hereafter called “weedy” and “weed-free,” respectively. The plot layout was similar to what was previously described (Gealy and Fischer Reference Gealy and Fischer2010). Briefly, the plots were 3-m long with nine rows spaced 18-cm apart. Each genotype was drill seeded approximately 2-cm deep at a density of 430 seeds m−2, except for XP753, which was seeded at a recommended density of 111 seeds m−2. In weedy plots, the E. crus-galli plants emerged from a combination of a natural infestation and supplemental E. crus-galli seeds that were collected previously from local research plots and broadcast on the soil surface at the time of rice planting (Gealy and Yan Reference Gealy and Yan2012). Although other grass weed species such as sprangletop (Diplachne spp.) were sometimes present in the weedy plots, E. crus-galli comprised more than 95% of total weed biomass and was by far the most dominant weed species in this study. We did not observe any perennial weed species in the research plots. Weed-suppression ability of the seven rice genotypes was evaluated under weedy and weed-free treatments and with either FLD or AWD irrigation management. Daily rainfall, minimum and maximum air temperatures at the experiment station, and the timeline and details of the agronomic practices used in each of the 3 yr of the study are presented in Supplementary Table S1.
Herbicides were applied POST for weed-free plots to control E. crus-galli and other weeds as necessary (Supplementary Table S1). For these chemical treatments, one or more herbicides were applied at the pre-flood stage, including quinclorac, propanil, cyhalofop, clomazone, and fenoxaprop. Herbicides were delivered using a CO2-powered backpack sprayer with 8001 flat-fan nozzles on 51-cm centers, calibrated to deliver 94 L ha−1 at 159 kPa and a speed of 0.894 m s−1 and enclosed in a shielded boom. Bentazon (0.55 kg ai ha−1) was also applied pre-flood as necessary to control broadleaf weeds in all plots. To lightly suppress grass weed growth in weedy plots, suboptimal rates of propanil were sprayed POST on these plots. In 2012, the rate was 2.2 kg ai ha−1, chosen because of an unusual burst of the weed population (pre-flood E. crus-galli plant density >180 m−2) in weedy plots. In 2013 and 2014, which had no such burst in the weed population, the rate was reduced to 1.1 kg ai ha−1.
After rice planting and before establishing the permanent flood, flush irrigation was applied to establish a healthy and uniform crop stand across the study. A onetime application of urea at a rate of 110 kg nitrogen ha−1 was applied in all plots just before establishing the permanent flood (Supplementary Table S1). The FLD plots were subsequently maintained fully flooded to a depth of approximately 10 cm by adding makeup water periodically as needed until physiological maturity of rice, whereas the AWD plots were left to deplete their irrigation water by percolation and evapotranspiration. Soil moisture was determined using transmission line oscillator probes that measure the dielectric permittivity of soil and expressed as volumetric water content (VWC; averaged over the 0- to 11-cm soil depth). After the soil surface had dried but was not excessively cracked and rice plants were not exhibiting visual symptoms of severe moisture stress such as curled leaves, the AWD plots were reflooded to a depth of 10 cm. These treatments corresponded with a target soil VWC of approximately 20% to 25% (which equates to a soil water potential of −26 to −19 kPa in these soils). Reflooding was repeated intermittently as needed throughout the growing season. Average soil VWC in AWD plots was measured continuously in weed-free plots planted with the variety ‘Cheniere’ (Supplementary Figure S1) using buried soil moisture probes connected to a data logger (Campbell Scientific, Logan, UT). Additional VWC measurements (four per plot) were taken manually in the weed-free plots of Cheniere, ‘Rondo’, and XP753 using a handheld 11-cm-long moisture probe (HydroSense, Campbell Scientific) during the driest part of the dry-down phases (Supplementary Figure S1). This facilitated greater overall accuracy of VWC measurements across the AWD plots, allowing reflooding events to be scheduled more precisely.
Midseason measurements included agronomic measurements, recorded approximately 1 mo after application of the initial flood, which corresponded with 9 to 10 wk after rice emergence and 2 to 2.5 wk before the 50% heading date of Cheniere, an early-heading genotype. The agronomic measurements were obtained from two quadrats (0.25 m by 0.25 m) located near the respective ends of each plot that were destructively sampled from outside the area that was reserved for late-season measurements. The measurements included rice dry biomass (g m−2), number of tillers (no. m−2), and E. crus-galli dry biomass (g m−2). Days to heading were determined individually for each genotype, and canopy temperature (C) was measured only on August 27, 2014. Physiological measurements, which included gas-exchange parameters, net photosynthesis (P n), transpiration (E), and stomatal conductance (C), were recorded on August 28, 2014 (near maximum dryness during the second AWD dry-down cycle; 1 d before reflooding) and September 5, 2014 (AWD recovery; 7 d after reflooding) for the diverse genotypes, ‘Katy’ (TRJ) and PI 312777 (indica), under AWD and FLD treatments in weed-free plots. The goal was to determine differential physiological responses between these genotypes during the most water-stressed time of the AWD dry-down phase and, again, after reflooding during the AWD recovery phase. P n, E, and C of single, fully-expanded leaves near the top of the plant were determined using an open-system, CI-340 portable infrared gas analyzer operated at an airflow rate of 0.3 L min−1 and equipped with a 65-mm-long by 10-mm-wide (6.25 cm2) CI-301-LC-3 acrylic assimilation chamber that contained a photosynthetically active radiation sensor and an infrared leaf temperature sensor (CID Bio-Science, Camas, WA). Typically, leaves from two individual plants per replicate were subsampled from interior rows of each plot (omitting rows 1 and 9 on the edge of each plot) under cloudless skies. Leaves were illuminated with natural sunlight at a constant photosynthetic photon flux density (PPFD) ranging from 1,500 to 2,000 µmol m−2 s−1, which is near the light-saturated levels for rice P n under field conditions in Stuttgart, AR (DRG, unpublished data). PPFD was held constant within a single day by slightly tilting the leaf chamber toward or away from the sun as needed. Canopy temperature (C) was measured using the CI-340 (inverted to direct the infrared thermometer toward the canopy from above) in AWD and FLD plots 1 d before P n measurements to assess the leaf temperature response of the two genotypes to water stress during the dry-down phase. At harvest, the agronomic measurements included: rice dry biomass (g m−2), number of tillers (no. m−2), number of panicles (no. m−2), and grain yield (kg ha−1) and E. crus-galli dry biomass (g m−2). Owing to the earlier maturity of E. crus-galli relative to rice, and its tendency to lose significant dry weight due to decay in the floodwater by the time rice is harvested (and therefore be underestimated), the weed dry biomass at midseason was preferred over late season in this study and is presented.
Statistical Analysis
The experimental design for rice data was a split-split plot, with irrigation method as the main plot, rice genotypes as subplots, and weed levels as sub-subplots, with four replications. The study was conducted for 3 yr. ANOVA was performed on data from all the measurements in this study using a general linear mixed model using JMP v. 13.2 (SAS Institute, Cary NC). Plots of residuals from ANOVA were used to assess the assumption of normality. Least-squares means from ANOVA were compared and differentiated at the 5% probability level (P < 0.05) using Fisher’s Protected LSD.
Preliminary ANOVAs were performed by year with irrigation treatment, genotype, weed level (weedy or weed-free), and all two- and three-way interactions as fixed effects. Random effects were included as appropriate for a split-split-plot design. Because the weed-level effect was always extremely high and further investigation indicated problems with homogeneity of variances between the two weed levels for all variables involving rice measurements, separate analyses were computed for each weed level. The final ANOVA was performed separately for weedy and weed-free data by combining data over the 3 yr and treating year and treatment interactions with year as additional random effects.
Midseason rice dry biomass and tiller number and grain yield for all combinations of irrigation and weed treatment were expressed as a proportion of the conventional standard, FLD:weed-free, with each replication having an independently measured standard. This created a separate response for each combination of irrigation and weed treatment that provides insights into possible differences among rice genotypes with the addition of biological stresses. The ANOVA for these data used a general linear mixed model with fixed effect for variety and random effects for year, replications within year, and year by variety. Proportion data were analyzed using log-transformed and nontransformed data, and outcomes were similar, so we present only nontransformed results.
In addition to pairwise comparisons between the seven genotypes, contrast statements were used to compare the means of various groups of genotypes, such as the two indica genotypes and the three TRJ genotypes. When the LSD value indicated no differences in genotypes within the two groups, a contrast provided a more powerful test for picking up differences between genotypes.
The experimental design for weed data was similar to that for rice data, except that it was considered a split-plot design, with irrigation method as the main plot and rice genotypes as subplots, because weeds were present in the weedy plots only. A separate set of weedy main plots (AWD or FLD) with no rice planted (weedy-no rice) was also maintained in each replication to serve as a standard for comparison with weeds present in rice plots.
To identify which trait variables might best predict rice grain yield or midseason E. crus-galli dry biomass, multiple regression models that included each of these as the dependent variable and all other trait variables individually and as two-way interactions as independent variables were considered. A stepwise regression procedure in JMP was used to reduce the models. If an interaction between two independent traits was identified as important, then each independent variable was retained in the model as an individual term.
Results and Discussion
Potential of Rice Genotypes for Echinochloa crus-galli Suppression under FLD and AWD
At the onset of the cropping season and before differential irrigation treatments or weed control treatments had been implemented, E. crus-galli seedling density was similar in the FLD and AWD plots. Due to warm temperatures and plentiful rainfall after the 2012 planting, early-season pre-flood E. crus-galli densities were quite high, averaging ~182 plants m−2. In 2013, pre-flood E. crus-galli densities were ~134 plants m−2, but due to unseasonably cold temperatures after planting, rice emergence was delayed 6 d compared with 2012 (Supplementary Table S1). Thus, early-season weed competition was severe in the first 2 yr of the study, which contributed to the average midseason E. crus-galli biomass of 1,898 g m−2 and correspondingly low midseason visual weed control ratings ranging from only 5% to 31% (unpublished data). In 2014 pre-flood E. crus-galli densities were lower than in the previous 2 yr (~120 plants m−2), and the midseason. E. crus-galli dry biomass was correspondingly lower (1,225 g m−2), with weed control ratings sometimes exceeding 50% (unpublished data).
In this 3-yr study, the E. crus-galli dry biomass at midseason in rice-free (weedy-no rice) plots containing only E. crus-galli was similar under both FLD (1,791 g m−2) and AWD (1,751 g m−2) irrigation treatments (Table 2). This indicates that the level of water scarcity imposed by AWD did not reduce growth and development of E. crus-galli. However, in rice plots, the dry biomass of E. crus-galli at midseason was higher under FLD (1,674 g m−2) by an average of 16% when compared with AWD (1,438 g m−2) (Table 2), indicating that E. crus-galli was under stress from rice genotypes when grown under AWD.
Table 2. Midseason Echinochloa crus-galli dry biomass in weedy plots across 3 yr as affected by irrigation system.a

a Abbreviations: AWD, alternate-wetting-and-drying irrigation; FLD, conventional flood irrigation; sdf, single degree of freedom.
b In addition to the least-squares means differences shown by LSD, the following contrasts (sdf) indicate differences between selected groups of genotypes. All contrasts for FLD only were highly nonsignificant. AWD only: Contrast 1, [PI 312777] < [Bengal, Cheniere, Katy], P = 0.0209; Contrast 2, [PI 312777, Rondo] < [Bengal, Cheniere, Katy], P = 0.0939; Contrast 3, [PI 312777, XP753] < [Katy], P = 0.0015.
c Dry biomass values shown are least-squares means. The means followed by the same lowercase letter are not different at P = 0.05 according to an LSD test. Within a data column, LSD (P ≤ 0.05) = 340 for comparisons among rice genotypes, and LSD (P ≤ 0.05) = 306 for comparing the weedy-no rice standard to any rice genotype.
Echinochloa crus-galli dry biomass at midseason differed among the rice genotypes depending on the irrigation treatment. Under FLD treatments, E. crus-galli dry biomass was similar among genotypes, whereas under AWD treatments, E. crus-galli dry biomass was greatest in Katy and least in PI 312777 and XP753, which averaged about 30% less than Katy, a significant decrease (single degree of freedom [sdf] contrast, P = 0.0015) (Table 2). Echinochloa crus-galli dry biomass under AWD was also lower in PI 312777 when contrasted with all three TRJ cultivars (significant sdf contrast, P = 0.0209) (Table 2). This result stresses the challenge that E. crus-galli poses for Katy and other TRJ nonsuppressive genotypes, particularly under the additional stress from AWD, and the potential for weed-suppressive genotypes such as PI 312777 to partially overcome the E. crus-galli stress. These results are consistent with previous studies in which PI 312777 exhibited superior weed-suppression ability when tested with several indica and TRJ cultivars in a conventionally flooded system (Gealy and Duke Reference Gealy and Duke2017).
Potential of Rice Genotypes to Maintain Grain Yield under AWD and Echinochloa crus-galli Stress
Grain yield of the seven genotypes under the conventional system (FLD:weed-free), along with grain yields under the remaining three combinations of irrigation and E. crus-galli level expressed as proportions of this conventional standard (determined by dividing each grain yield by the FLD:weed-free grain yield in the same replication), are presented in Table 3. Calculating these proportions relative to a conventional standard provides insights into differential responses among genotypes with the addition of successively greater biological stress from AWD and weeds. These results demonstrate that some genotypes were better able to resist one or both of these stresses compared with the other genotypes (Table 3).
Table 3. Rice grain yield for genotypes under conventional standard conditions (FLD:weed-free) and their proportions relative to this standard as affected by irrigation system and presence or absence of Echinochloa crus-galli.a, b

a Abbreviations: AWD, alternate-wetting-and-drying irrigation; FLD, conventional flood irrigation; prop., proportion; sdf, single degree of freedom; TRJ, tropical japonica; indica-TRJ line, STG06L-35-061.
b Calculating the grain yield proportions (shown in columns two, four, and six) relative to the conventional standard (first data column) provides insights into differential grain yield responses among genotypes with the addition of successively greater biological stress. Data columns from left to right depict generally increasing levels of stress that result in lower and lower grain yields (AWD:weed-free > FLD:weedy > AWD:weedy). Yield values shown are least-squares means of nontransformed data across 3 yr. Actual yields of the FLD:weed-free plots were analyzed using nontransformed data. Proportion data were analyzed using log-transformed and nontransformed data, and outcomes were similar, so we present only nontransformed results. Means followed by the same lowercase letter are not different at P = 0.05 according to an LSD test.
c In addition to the least-squares means differences shown by LSD, the following contrasts (sdf) indicate differences between selected groups of genotypes. AWD:weed-free/FLD:weed-free (yield proportion): Contrast 1, [PI 312777, Rondo, indica-TRJ line] > [Bengal, Cheniere, Katy], P = 0.0087; Contrast 2, [PI 312777, Rondo] > [Bengal, Cheniere, Katy], P = 0.0058; Contrast 3, [PI 312777, Rondo, indica-TRJ line, hybrid] > [Bengal, Cheniere, Katy], P = 0.0032; Contrast 4, [PI 312777, Rondo, indica-TRJ line] > [Cheniere, Katy], P = 0.0445; Contrast 5, [PI 312777, Rondo, indica-TRJ line] > [Bengal], P = 0.0090. FLD:weedy/FLD:weed-free (yield proportion): Contrast 6, [PI 312777, Rondo] > [Bengal, Cheniere], P = 0.0029; Contrast 7, [PI 312777, Rondo] > [Cheniere], P = 0.0274; Contrast 8, [PI 312777, Rondo, Katy, indica-TRJ line, Hybrid] > [Bengal, Cheniere], P = 0.0013; Contrast 9, [PI 312777, Rondo, indica-TRJ line, hybrid, Bengal, Katy] > [Cheniere], P = 0.0383. AWD:weedy/FLD:weed-free (yield proportion): Contrast 1, [PI 312777, Rondo, indica-TRJ line] > [Cheniere, Katy, Bengal], P = 0.0186; Contrast 2, [PI 312777, Rondo] > [Bengal, Cheniere, Katy], P = 0.0105.
d The P-values presented in columns four, six, and eight of the table are used to test whether the proportion in the column to the left is significantly different from 1.0. P-values ≤ 0.05 indicate that the proportion is significantly less than 1.0 and, therefore, less than the FLD:weed-free conventional standard.
Under FLD:weed-free treatments, the average grain yield of XP753, ‘Bengal’, and Cheniere were 39% greater than the average grain yields of the indica-TRJ line (STG06L-35-061), PI 312777, and Katy, with Rondo at an intermediate level (Table 3). This emphasizes the relatively high grain yield potential of XP753 and commercial TRJs such as Bengal and Cheniere in conventional, nonstressed treatment. Although Katy is also a TRJ, it was released for commercialization almost 30 yr ago and has been replaced by newer varieties with higher yield.
AWD constituted the only source of imposed stress in the AWD:weed-free treatment. Averaged over all AWD cycles and all 3 yr at the driest stage of the AWD cycle, soil VWC was 21.7 ± 0.7% (represents a soil water potential of −24 kPa in these soils) with soil surfaces dry and cracked in appearance and rice plants appearing healthy and not under moisture stress. With the addition of the AWD stress, the overall average grain yield loss was 12% (Table 3, AWD:weed-free column). However, grain yield of Bengal fell markedly (about 30%; significant sdf contrast, P = 0.0090), and the average yield loss of Bengal, Cheniere, and Katy as a group was 23% (significant sdf contrast, P = 0.0087) compared with PI 312777, Rondo, and the indica-TRJ line as a group, which on average remained within about 2% reduction of the conventional standard of FLD:weed-free. Thus, grain yields of the TRJs were challenged by AWD stress under weed-free treatments, particularly Bengal, which had been among the top-yielding genotypes in the conventional system but was the least tolerant under AWD. In previous studies, low to moderate levels of AWD stress similar to those imposed in our study have resulted in similar minimal effects on rice yield in weed-free systems. Linquist et al. (Reference Linquist, Anders, Adviento-Borbe, Chaney, Nalley, da Rosa and Kessel2015) reported that AWD reduced yields by <1% to 13% and that yields generally declined as the severity of AWD increased with greater soil dry-out between refloodings. In a meta-analysis of 56 studies, Carrijo et al. (Reference Carrijo, Lundy and Linquist2017) showed that under mild AWD (soil water potential ≥ −20 kPa), yields typically were not reduced, but under severe AWD (soils dried to <−20 kPa), they were reduced an average of 23%. Carrijo et al. (Reference Carrijo, Akbar, Reis, Li, Gaudin, Parikh, Green and Linquist2018) imposed different levels of AWD (as low as 25% VWC), showing that yield was not reduced by any of the treatments, in part because deep soil moisture at 25 to 35 cm below the soil surface was similar across the AWD treatments. Yang et al. (Reference Yang, Zhou and Zhang2017) reported that yields were not reduced under moderate AWD (photosynthesis not severely inhibited or rewatering at soil water potentials of −10 to −15 kPa). In commercial fields, Massey et al. (Reference Massey, Walker, Anders, Smith and Avila2014) showed that intermittent flooding coupled with multiple-inlet irrigation resulted in yields equal to or greater than those of continuously flooded controls for six of seven varieties tested.
Overall grain yield loss from the FLD:weedy and AWD:weedy treatments averaged 90% and 93%, respectively, versus the FLD:weed-free standard, compared with 12% for AWD:weed-free (Table 3). Thus, weed stress was far more inhibitory than AWD to grain yield in this study, but both contributed to the inhibition. The indica genotypes clearly tolerated the stresses imposed better than the TRJs in terms of yield reductions, whether considering AWD, E. crus-galli, or the combination of both. Under the AWD:weedy treatment, the two indica genotypes and the indica-TRJ line, which contains introgressions from an indica, tended to maintain the highest grain yield proportions, with Cheniere being lowest and other genotypes being intermediate (Table 3). These trends for grain yield generally were similar to those in the FLD:weedy treatment. Of the TRJs, Bengal appeared to be relatively more inhibited by the AWD stress, whereas Cheniere was severely inhibited by both AWD and E. crus-galli stress.
The indica genotypes (PI 312777 and Rondo), which were among the most tolerant to yield reductions under combined stresses of AWD and E. crus-galli, also tended to maintain the highest proportions of tillers and dry biomass, suggesting that these traits might be associated with the differences seen in grain yield among the seven genotypes evaluated in this study (Tables 4 and 5, respectively).
Table 4. Midseason tiller number for genotypes under conventional standard conditions (FLD:weed-free) and their proportions relative to this standard as affected by irrigation system and presence or absence of Echinochloa crus-galli.a, b

a Abbreviations: AWD, alternate-wetting-and-drying irrigation; FLD, conventional flood irrigation; prop., proportion; sdf, single degree of freedom.
b Values shown are least-squares means of nontransformed data across 3 yr. Actual tiller numbers of the weed-free plots were analyzed using nontransformed data. Proportion data were analyzed using log-transformed and nontransformed data, and outcomes were similar, so we present only nontransformed results. Means followed by the same lowercase letter are not different according to an LSD test.
c In addition to the least-squares means differences shown by LSD, the following contrasts (sdf) indicate differences between selected groups of genotypes.FLD: weed-free conventional standard, actual number of tillers: Contrast 2, [PI 312777, Rondo] > [Cheniere, Bengal, Katy], P < 0.001.AWD: weedy/FLD: weed-free: Contrast 1, [PI 312777, Rondo, XP753] > [Cheniere, Bengal, Katy], P = 0.0068; Contrast 2, [PI 312777, Rondo] > [Cheniere, Bengal, Katy], P = 0.0183.
d The P-values presented in columns four, six, and eight of the table are used to test whether the proportion in the column to the left is significantly different from 1.0. P-values ≤ 0.05 indicate that the proportion is significantly less than 1.0 and, therefore, less than the FLD:weed-free conventional standard.
Table 5. Midseason rice dry biomass for genotypes under conventional standard conditions (FLD:weed-free) and their proportions relative to this standard as affected by irrigation system and presence or absence of Echinochloa crus-galli.a, b
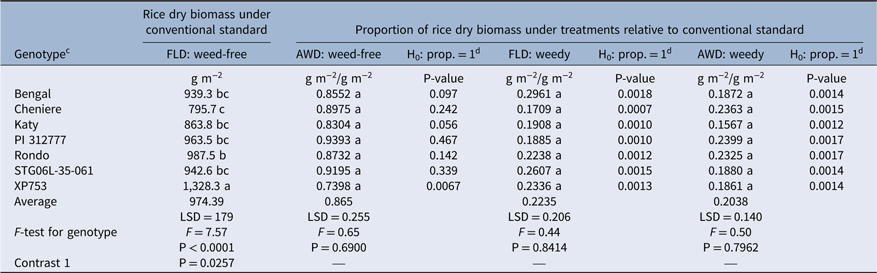
a Abbreviations: AWD, alternate-wetting-and-drying irrigation; FLD, conventional flood irrigation; prop., proportion; sdf, single degree of freedom.
b Values shown are least-squares means of nontransformed data across 3 yr. Rice dry biomass values of the weed-free plots were analyzed using nontransformed data. Proportion data were analyzed using log-transformed and nontransformed data, and outcomes were similar, so we present only nontransformed results. Means followed by the same lowercase letter are not different according to an LSD test.
c In addition to the least-squares means differences shown by LSD, the following contrasts (sdf) indicate differences between selected groups of genotypes. FLD:weed-free conventional standard: Contrast 1, [PI 312777, Rondo, Bengal] > [Cheniere, Katy], P = 0.0257.
d The P-values presented in columns four, six, and eight of the table are used to test whether the proportion in the column to the left is significantly different from 1.0. P-values ≤ 0.05 indicate that the proportion is significantly less than 1.0 and, therefore, less than the FLD:weed-free conventional standard.
Midseason rice tiller number in the conventional standard of the FLD:weed-free system was greatest in the two indica genotypes, PI 312777 (838 tillers m−2) and Rondo (735 tillers m−2), and lower in the remaining genotypes (Table 4). Tiller production for all genotypes in the AWD:weed-free treatment was unchanged relative to the conventional standard but was reduced by an average of 65% and 62% in the FLD:weedy and AWD:weedy treatments, respectively, which indicated that weeds imparted a high degree of stress to tiller production in this study. The AWD:weedy treatment inhibited tiller production by 52% on average in PI 312777, Rondo, and XP753, and by 70% on average in Cheniere, Bengal, and Katy (significant sdf contrast, P = 0.0068), indicating that indica and hybrid genotypes had better tolerance for the combination of AWD and weed stress compared with the commercial TRJ genotypes (Table 4).
Midseason rice dry biomass production in the conventional FLD:weed-free system, was greatest in XP753 (1,328.3 g m−2), averaging 45% more than the average of all other genotypes (Table 5). The dry biomass was similar for Bengal, Katy, PI 312777, Rondo, and STG06L-35-061 (Table 5). The average dry biomass of PI 312777, Rondo, and Bengal (significant sdf contrast, P = 0.0257) was also 16% greater than that of Cheniere and Katy (Table 5). The AWD:weed-free treatment, however, reduced dry biomass of XP753 by 26% (P = 0.0067) compared with conventional standard levels (Table 5). This treatment did not reduce the dry biomass of the other genotypes significantly, although values for Katy and Bengal were nearly significant (P = 0.056 and P = 0.097, respectively) with an average reduction of 16% (Table 5). This suggests that the hybrid and possibly the more sensitive TRJs might be particularly susceptible to midseason biomass reduction with the imposition of AWD stress, whereas other genotypes such as PI 312777 are not. In the FLD:weedy and AWD:weedy treatments, rice dry biomass of all genotypes was reduced below the conventional FLD:weed-free level by an average of 77% and 79%, respectively (P < 0.002) (Table 5), thus demonstrating that although E. crus-galli stress severely impacted rice biomass production, its impact on rice grain yield was more severe (Table 3).
In an analysis investigating the effects of rice weed-suppressive ability and tolerance to late watergrass [Echinochloa phyllopogon (Stapf) Koss.], de Vida et al. (Reference de Vida, Laca, Mackill, Fernández and Fischer2006) showed that competition reduced rice yield 32% to 48% and E. phyllopogon biomass 44% to 77%. Path analysis suggested that traits enhancing weed-suppressive ability and weed tolerance of rice while minimizing possible productivity trade-offs include early growth and light capture, moderate growth rates before heading, and a vigorous grain filling. Crop growth rate after heading helped determine yield and was positively correlated with weed tolerance; however, late-season rice biomass accumulation was negatively correlated with harvest index and crop growth rate during ripening, suggesting that late-season competitiveness might lower productivity.
Potential associations between grain yield and other variables such as days to heading and final plant height were used to perform backward stepwise regression that resulted in a model that included five variables and their interaction terms (midseason rice dry biomass, days to heading, final height, late-season rice dry biomass, late-season rice panicle number, and interactions between days to heading and midseason rice biomass, final height and late-season rice biomass, and late-season rice dry biomass and late-season rice panicle number) with an R2 value of 0.75 (Supplementary Table S2). In the developed model, rice grain yield was found to be associated with five main factors: midseason rice dry biomass, days to heading, final plant height, late-season rice dry biomass, late-season rice panicle numbers; and three interaction terms: days to heading by midseason rice dry weight, final height by late-season rice dry biomass, and late-season rice dry biomass by late-season rice panicle number (unpublished data). The resulting model equation is:
 $$\eqalign{ 	{\rm{Yield = - 5}}{\rm{.70031 + }}\left( {{\rm{midseason \ rice \ dry \ biomass}}} \right){\rm{ }}\left( {{\rm{0}}{\rm{.00504}}} \right){\rm{ }} \cr 	 \hskip 32pt{\rm{ + }}\left( {{\rm{days \;to \;heading}}} \right){\rm{ }}\left( {{\rm{0}}{\rm{.03149}}} \right){\rm{ + }}\left( {{\rm{final \;rice \;plant \;height}}} \right)\cr	\hskip 40pt{\rm{ }}\left( {{\rm{0}}{\rm{.05096}}} \right){\rm{ }} \cr 	 \hskip 2.6pc{\rm{ + }}\left( {{\rm{late {\hbox-} season \;rice \;dry \;biomass}}} \right){\rm{ }}\left( {{\rm{0}}{\rm{.00441}}} \right)\cr	\hskip 2.6pc{\rm{ + }}\left( {{\rm{late {\hbox-} season \;rice \;panicle \;number}}} \right){\rm{ }}\left( {{\rm{0}}{\rm{.00233}}} \right){\rm{ }} \cr 	 \hskip 2.6pc{\rm{ + }}\left( {{\rm{days \;to \;heading \times midseason \;rice \;dry \;biomass}}} \right)\cr	\hskip 3.2pc{\rm{ }}\left( {{\rm{ - 0}}{\rm{.00005024}}} \right) \cr 	 \hskip 2.6pc{\rm{ + }}\left( {{\rm{final \;rice \;plant \;height \times late {\hbox-} season \;rice \;dry \;biomass}}} \right)\cr	\hskip 3.2pc{\rm{ }}\left( {{\rm{ - 0}}{\rm{.00003542}}} \right){\rm{ }} \cr 	 \hskip 2.6pc{\rm{ + }}( {{\rm{late {\hbox-} season \;rice \;dry \;biomass}}} \cr	\hskip 2.6pc\times {{\rm late {\hbox-} season \;rice \;panicle \;number}} ) \;{\rm{ }}\left( {{\rm{ - 0}}{\rm{.00000162}}} \right){\rm{}} \cr} $$
Final rice heights as affected by irrigation and E. crus-galli are shown in Supplementary Table S3.
A backward stepwise regression approach similar to that used to model rice grain yield was also used to model the midseason E. crus-galli dry biomass. The resulting model equation is:
 $$\\ Echinochloa\;crus {\hbox-} galli\;{\rm{dry biomass }} = {\rm{ }}2,666.3116{\rm{ }} + {\rm{ }}\left( {{\rm{early {\hbox-} season \;rice \;height}}} \right) \\ \;\left( - 24.87618} \right){\rm{ }} + {\rm{ (early \hbox- season}}\;E.crus {\hbox-} galli\;{\rm{plant density)\; }}\left( { - 0.125369} \right) \\ + {\rm{ }}({\rm{midseason \;rice \;tiller \;number}}){\rm{ }}\left( { - 1.418502} \right){\rm{ }} + \\ [({\rm{early {\hbox-} season }}\;E.crus {\hbox-} galli\;{\rm{plant \;density }} - 181.429) \\ *{\rm{ }}({\rm{midseason \;rice \;tiller \;number}} - 235.718)]{\rm{ }}\left( {0.0337197} \right)$$
The R2 value is 0.41 (Supplementary Table S4). It shows that early-season (pre-flood) rice height, early-season E. crus-galli plant density, midseason rice tiller number, and the interaction of early-season E. crus-galli plant density and midseason rice tiller number impacted the midseason E. crus-galli dry biomass. Substituting different input levels of these key variables in the model (while holding others constant) produced predictions showing that increased early-season rice height tends to reduce midseason E. crus-galli dry biomass (slope = −24.876; P = 0.0648), especially for lower early-season E. crus-galli plant density levels and higher midseason rice tiller numbers. This prediction is consistent with our biological expectation that taller rice plants generally are associated with greater reductions in weed biomass, but if the initial density of weeds in the field is too high, this expected rice height effect can break down, and weed biomass would be high regardless. Another prediction of the model was that when early-season E. crus-galli plant density and midseason rice tiller numbers were interacting, higher numbers of midseason rice tillers tended to decrease the midseason E. crus-galli dry biomass, especially at the lower range of tillers; and the regression response became significantly different from zero at an early-season E. crus-galli plant density of ~≤195 plants m−2 (P = 0.0336, as calculated using a “custom” t-test; unpublished data). This predicted response is consistent with our biological expectation that greater tiller numbers often are associated with reduced weed biomass, but if the beginning weed density is too high, then the expected response can break down, and the midseason weed density can be high regardless of tiller number. In earlier work, de Vida et al. (Reference de Vida, Laca, Mackill, Fernández and Fischer2006) also found that early-season rice growth affected weed biomass production, but contrary to our findings, they did not observe a significant influence from rice tillering.
Physiological Response of Contrasting indica and TRJ Rice Genotypes during Irrigation Dry-down and Recovery Phase
Based on the results for Katy and PI 312777 from the first 2 yr of our study and our interest in these contrasting genotypes (TRJ and indica, respectively) as parents for a mapping population, we compared them for water-stress tolerance under AWD. As potential indicators of physiological responses to AWD stress, three common gas-exchange parameters of these genotypes were measured under FLD:weed-free and AWD:weed-free treatments 1 d before and 7 d after reflooding (dry-down and recovery phases, respectively) during the second AWD cycle in 2014 (Table 6).
Table 6. Physiological gas-exchange parameters of PI 312777 (indica) and Katy (tropical japonica) leaves in weed-free plots during dry-down and recovery phases under AWD irrigation in 2014.a

a Abbreviations: AWD, alternate-wetting-and-drying irrigation; FLD, conventional flood irrigation; VWC, volumetric water content.
b Measurements for the dry-down phase were taken August 28, 1 d before reflooding (near-maximum drying), during the second AWD cycle of 2014. Measurements for the recovery phase were taken September 5, 7 d after reflooding during the same AWD cycle. When averaged over the experiment 1 d before P n measurements on August 27, 2014, the VWC of AWD plots was 24% (20 kPa). Values presented for physiological measurements are least-squares means.
During the stress of the AWD dry-down, P n was nearly 40% greater for PI 312777 than for Katy, and the other gas-exchange measurements followed a similar trend (Table 6). These results suggest that Katy was initially the less AWD tolerant of the two genotypes. Furthermore, AWD canopy temperatures of these two genotypes generally mirrored the P n values, in that the temperature of the more-stressed Katy was about 2 C greater than that of PI 312777 (29.7 ± 0.9 C vs. 27.5 ± 0.7 C) compared with the FLD canopy temperatures (27.7 ± 0.6 C vs. 27.5 ± 0.5 C) on August 27, 2014. During the recovery phase of AWD 7 d after reflooding, gas-exchange parameters for both PI 312777 and Katy had risen to the levels of their FLD standards, but interestingly, the P n of Katy had increased to 6% above that of PI 312777 (Table 6). This phenomenon might be an indication of differential stress tolerance mechanisms between the two genotypes and should be investigated in more depth. Conceivably, it could indicate the variable response of the different physiology, metabolism, and homeostatic mechanisms of these two genotypes to the soil moisture–deficit stress conditions brought about by the AWD treatment over time. As reported earlier, under reduced soil moisture content, stomatal conductance, leaf water potential, and root hydraulic conductance decline and could directly affect a plant’s phenology, growth, development, and grain yield (Araus et al. Reference Araus, Slafer, Reynolds and Royo2002; Kulkarni et al. Reference Kulkarni, Soolanayakanahally, Ogawa, Uga, Selvaraj and Kagale2017; Nguyen et al. Reference Nguyen, Pham, Nguyen and Mochizuki2015).
Published reports suggest that stresses during either the vegetative stage or reproductive stage can affect rice yield potentials (Boonjung and Fukai Reference Boonjung and Fukai1996; Fageria Reference Fageria2007). Thus, in this study, we evaluated the effects of E. crus-galli and irrigation system on rice in the field at midseason and at harvest to partition the effects of these biotic and abiotic stresses to obtain a better understanding of their influences on rice. By midseason, under FLD irrigation, the E. crus-galli biomass among genotypes was generally similar but was lower in XP753 than in Cheniere (LSD P ≤ 0.05) (Table 2).
When AWD stress was combined with weed stress (Table 2), the E. crus-galli dry biomass was clearly greater for the TRJs (particularly Katy) and lower for PI 312777 and XP753 (significant sdf contrast, P = 0.0209). Interestingly, the use of AWD in weedy plots provided an increased advantage in the suppression of weed biomass for PI 312777 (and, to a lesser extent, XP753) over many other genotypes (Table 2). In weed-free treatments, grain yield of Bengal was 32% lower in AWD than in FLD compared with yields of PI 312777, Rondo, and the indica-TRJ line, which were all similar in the two systems (within 5% of one another) (Table 3), suggesting that these genotypes may be better adapted than the others to AWD systems.
The results further showed that weeds can dramatically reduce grain yield of both suppressive and nonsuppressive rice genotypes (90% to 95%) under AWD and FLD systems. This demonstrates the very heavy burden on grain yield that is imposed by the high levels of weed pressure in this study. Echinochloa crus-galli–imposed grain yield losses may have been exacerbated because of the high initial weed population densities (182, 134, and 120 plants m−2 in 2012, 2013, and 2014, respectively) in the study. Smith (Reference Smith1988) has considered 100 plants m−2 to be a high density for E. crus-galli. These high weed densities and the delay in crop emergence that sometimes occurred during this study probably imparted a competitive advantage to the weeds during the initial stages of crop growth. This natural, inconsistent, and unpredictable weed pressure that occurs from year to year points out an important challenge for any rice cropping system that endeavors to reduce or eliminate herbicide use.
The present study explored the interactions of AWD and weed stress on grain yield and the influence of AWD on weed suppression over a 3-yr period. Under AWD, the indica genotypes and the hybrid tended to suppress E. crus-galli biomass better than the TRJs. However, the E. crus-galli biomass for all genotypes in both irrigation systems always exceeded 1,000 g m−2, demonstrating the high weed pressure in the study, which greatly reduced grain yields. The indica genotypes had the greatest overall tolerance to grain yield reduction under both AWD and E. crus-galli stresses, while the TRJs were found to be the least tolerant. The hybrid had good tolerance to grain yield reduction under AWD, but its tolerance to the combination of AWD and E. crus-galli stresses appeared to be less than for the indica genotypes. Overall, the TRJs Cheniere and Bengal had the least grain yield tolerance to both AWD and E. crus-galli stresses, while the PI 312777 indica had the best tolerance. The combination of AWD and reduced-herbicide inputs reduced grain yield more than 90% and severely compromised weed control in this study. Reflooding at higher VWC levels might be a means to prevent some of the yield loss attributed to the AWD system under weed-free conditions.
Stepwise regression identified five main agronomic factors associated with grain yield that explained 75% of the variability in the study, including midseason rice dry biomass, days to heading, final rice plant height, late-season rice dry biomass, and late-season rice panicle numbers as main factors, and three interaction terms among these factors (Supplementary Table S2). The interaction of rice height and late-season rice dry biomass is important and has a negative regression coefficient. This indicates that as late-season rice dry biomass increases, the effect of rice height on grain yield will decrease (and vice versa). Similarly, stepwise regression identified three main factors associated with midseason E. crus-galli dry biomass that explained 41% of the variability in the study, including early-season rice height, early-season E. crus-galli plant density, and midseason rice tiller number, and the interaction between the last two (Supplementary Table S4 and Supplementary Figure S2). For both of these regression models, however, we must note that larger numbers of genotypes would need to be evaluated in future studies to better establish the biological importance and consistency of these agronomic factors and further refine the regression models.
The indica genotypes, and to some extent the indica-TRJ line, produced relatively higher grain yield when under stress from both E. crus-galli and AWD, suggesting that these genotypes, which were not consistently greater in height or biomass compared with the other genotypes, might possess mechanisms that enable them to tolerate both stresses. Allelopathic activity in roots or high root mass production are traits that have been suggested or observed for these indica genotypes or other weed-suppressive genotypes (Chen et al. Reference Chen, Hu and Kong2008; Gealy et al. Reference Gealy, Moldenhauer and Duke2013a, Reference Gealy, Moldenhauer and Jia2013b; Khanh et al. Reference Khanh, Xuan and Chung2007; Kong et al. Reference Kong, Chen, Hu and Zhang2011; Thi et al. Reference Thi, Lin, Smeda, Leigh, Wycoff and Fritschi2014). The identification of genotypes with extreme responses to these stresses suggests that one or more pairs of such genotypes could be useful in creating mapping populations from which quantitative trait loci could be mapped for weed suppression and water-stress tolerance under AWD management systems. Additional studies that include higher levels of AWD stress or lower levels of E. crus-galli stress will be useful in differentiating yield and weed-suppression responses among larger groups of genotypes.
In conclusion, our 3-yr study provided valuable insights into genetic differences among diverse rice genotypes for weed suppression under AWD irrigation management. Overall, it was interesting to note that the AWD management was able to reduce the midseason weed biomass by 11% compared with the FLD. Further, among seven tested rice genotypes, the two indica varieties and the hybrid demonstrated genetic potential for limiting weed biomass development in rice plots under AWD. The two indica genotypes, PI 312777 and Rondo, could be good choices as parental candidates for either AWD breeding programs or for future in-depth studies to identify useful genes for yield and natural weed competitiveness/suppressiveness under AWD irrigation management.
Supplementary material
To view supplementary material for this article, please visit https://doi.org/10.1017/wsc.2019.24
Author ORCIDs
David R. Gealy https://orcid.org/0000-0002-8084-2595; Jai S. Rohila https://orcid.org/0000-0002-4041-5804.
Acknowledgments
The authors thank Bill Luebke of the U.S. Department of Agriculture–Agricultural Research Service for technical assistance, Howard Black of the U.S. Department of Agriculture–Agricultural Research Service for technical assistance and data analysis, and RiceTec, Inc., for providing the hybrid seed for this study. No conflicts of interest have been declared. The USDA is an equal opportunity provider and employer.


