


Rice is a staple food for people in Asia and is an important source of nutrition throughout the world (Coats Reference Coats2003). Although a large number of countries cultivate rice, 80% to 90% of rice is still grown in Asia (Coats Reference Coats2003; FAOSTAT 2011). In the conventional method of growing rice, the rice seedlings are transplanted by hand or machine under flooded field conditions (Peng et al. Reference Peng, Tang and Zou2009). This conventional planting method requires large amounts of water, but frequent irrigation often leads to water wastage (Bouman Reference Bouman2001). As a result of global climate change, the increase in frequency of drought events has led to a shortage of water in agricultural areas. Hence, there has been a need to develop alternative methods that use less water to grow rice (Peng et al. Reference Peng, Shen, Wang, Liu, Luo and Wu1999).
An aerobic cultivation method for rice known as non-flooded plastic film mulching cultivation (PM) was introduced to China in the 1970s (Fan et al. Reference Fan, Liu, Jiang, Zhang, Lu, Zeng and Christie2005; Peng et al. Reference Peng, Shen, Wang, Liu, Luo and Wu1999; Zhang et al. Reference Zhang, Zhang, Yang and Zhang2008). This cultivation method has showed great potential for use in the southwestern and mountainous areas of China, where natural water resources have been limited. Aerobic rice cultivation uses 50% lesser water than the conventional method (Belder et al. Reference Belder, Bouman, Spiertz, Peng, Castañeda and Visperas2005). The use of plastic film also increased the soil temperature and root growth of rice seedlings (Liu et al. Reference Liu, Ai, Zhang, Lu, Zeng and Fan2005). However, as the plastic film is mulched at the beginning, this method is not suitable for topdressing with nitrogen fertilizer.
Controlled-release fertilizers with special release mechanisms can be used when rice is cultivated with PM (Du et al. Reference Du, Zhou and Shaviv2006; Shaviv Reference Shaviv2001). Polymer-coated urea (PCU) products use a specific nutrient-release pattern to meet the nutritional requirements of crops (Shaviv Reference Shaviv2001). Thus, the combined use of PCU and PM for aerobic rice cultivation is beneficial. Compared with research on traditional rice cultivation, studies on the effects of PCU on rice with PM were rare, with most research focused on uncoated urea (Fan et al. Reference Fan, Liu, Jiang, Zhang, Lu, Zeng and Christie2005, Reference Fan, Lu, Jiang, Six and Zhang2012; Li et al. Reference Li, Wu, Lu, Zhao, Fan and Zhang2006, Reference Li, Wu, Zhao, Lu, Fan and Zhang2007; Liu et al. Reference Liu, Wang, Lu, Zhang, Zeng, Ai, Peng and Christie2003, Reference Liu, Ai, Zhang, Lu, Zeng and Fan2005; Tian et al. Reference Tian, Lu, Fan, Li and Kuzyakov2013).
Field management practices influenced the growth of weeds on agricultural land (Armengot et al. Reference Armengot, Blanco-Moreno, Bàrberi, Bocci, Carlesi, Aendekerk, Berner, Celette, Grosse, Huiting, Kranzler, Luik, Mäder, Peigné, Stoll, Delfosse, Sukkel, Surböck, Westaway and Sans2016; Yin et al. Reference Yin, Cai and Zhong2005). Long-term management strategies for cultivation and fertilization altered soil fertility, and in turn affected the crop’s growth and the growth of associated weeds (Derksen and Swanton Reference Derksen and Swanton1993,Reference Derksen and Swanton1994; Yin et al. Reference Yin, Cai and Zhong2006). Long-term field experiments can provide insights into the effects of crop management practices. An 8-yr-long experiment was conducted to investigate the effect of the combined use of PCU and PM on rice yield. Different cultivation methods and the effects of various nitrogen fertilizers on weed diversity were also evaluated. Thus, the objective of our study was to determine the effect of different cultivation methods on rice yield, soil properties, and weed diversity in the fallow period.
Materials and Methods
Experimental Design for Field Experiments
The experiment for evaluating long-term fertilization was carried out in Duntou Town (29.32°N, 119.72°E; 72.8-m elevation) in Lanxi, Zhejiang province, China. The soil type at the start of the experiment in 2008 was sandy loam with a pH of 5.52 and approximately 22.6 g kg−1 soil organic matter (SOM), 114.6 g kg−1 Alkali-hydrolyzable N, 22.9 mg kg−1 available P, and 135 mg kg−1 NH4OAc exchangeable K (EK).
Treatments were carried out in triplicate in a split-plot design. The main plot treatments consisted of two different cultivation methods: traditional flooded cultivation (TF) and PM. Three N treatments were considered for the split plots: no N fertilizer, urea (135 kg N ha−1), and polymer-coated urea (135 kg N ha−1). Split plots were separated by 20-cm-wide and 30-cm-high soil ridges with plastic film buried to a depth of 25 cm to keep them hydrologically isolated. Thus, a total of six treatments were evaluated: TF0, traditional flooded cultivation without N fertilizer; TP, traditional flooded cultivation with PCU; TU, traditional flooded cultivation with urea; PM0, PM without N fertilizer; PP, PM with PCU; and PU, PM with urea. Prior to planting of rice, N together with 450 kg triple superphosphate ha−1 (72 kg P2O5 ha−1) and 112.5 kg potassium chloride ha−1 (67.5 kg K2O ha−1) was incorporated in the top 15 cm of soil. P and K fertilizers were the same for all plots each year.
The area of each plot was 30 m2 (6-m long by 5-m wide). Plastic film (0.005-mm thick, 1.7-m wide) was used to cover the soil during PM treatments. Holes were made in the plastic for each rice transplant. Every year, 37-d-old rice seedlings were transplanted within a 20 by 28 cm space in the middle of June. The depth of surface water was maintained at 3 cm for TF treatments, whereas soil moisture was maintained at 80% through intermittent irrigation for PM treatments. In the rice-growing season, irrigation was carried out at a rate of approximately 7,500 m3 ha−1 for TF treatments and 3,500 m3 ha−1 for PM treatments. The irrigation management was similar each year. The variety of rice was ‘IIYou-92.’ During the fallow period from November to May, the experimental plots had no additional inputs. The plastic film was removed after rice was harvested. All the rice in the plot was harvested to calculate yield. Yield components of fertile panicle, filled grain, filled grain rate, and 1,000-grain weight were evaluated.
Soil Sampling and Analyses
During the fallow period in 2016, samples were collected on March 23 from the 0- to 5-, 5- to 10-, and 10- to 20-cm soil layers for each plot from six locations and were mixed to obtain composite samples. Soil samples were air-dried for several weeks. Subsamples were analyzed to determine pH (1:2.5 in water), SOM (K2Cr2O7-H2SO4), total N (TN, micro-Kjeldahl method), Bray P1 method (NH4F-HCl), and EK (NH4OAc) based on the methods of Bremner (Reference Bremner1996).
Winter Weed Community and Spring-germinating Weed Seedlings
From March 19 to 22 in 2016, three 0.25-m2 quadrats were randomly set in the middle of each plot to avoid border effects. All weeds present in the quadrats were recorded, classified, counted by species, and then cut and dried at 80°C for 96 h before being weighed.
After the weeds were removed, the quadrats were maintained to determine the density of spring-germinating weed seedlings. Weeds in the quadrats were recorded, classified, and counted by species on April 22, 2016.
Statistical Analysis
ANOVA of yield, yield components, and soil quality was based on a split-plot design with cultivation as the main factor and nitrogen source as the subfactor. This process was finished in Statistica v. 5.5, while the multiple comparisons used LSD at a significance level of 0.05. Average weed density of the three quadrats per plot were used to calculate three diversity indices: H′ (Shannon-Wiener index), E (Shannon’s evenness index), and D MG (Margalef’s richness index) (Derksen et al. Reference Derksen, Thomas, Lafond, Loeppky and Swanton2006; Kenkel et al. Reference Kenkel, Derksen, Thomas and Watson2009; Yin et al. Reference Yin, Cai and Zhong2006).
The Shannon-Wiener index was calculated as follows:
 $$H\prime={\minus}\mathop{\sum}\nolimits_1^s {Pi{\times}{\rm ln}Pi} $$
where S was species number in each quadrat, and Pi=n/N, where N represents all the individuals present in the quadrat and n is the weed density by species in the quadrat. Shannon’s evenness diversity was estimated by the Shannon-Wiener index:
 $$E=H\prime\left( {{\rm ln}S} \right)^{{{\minus}1}} $$
Margalef’s D MG was used to calculate species richness as follows:
 $$D_{{{\rm MG}}} =\left( {S{\minus}1} \right)({\rm ln}N)^{{{\minus}1}} $$
Weed species diversity indices, biomass, and total weed seedlings were compared using LSD a significance level of 0.05 in Statistica v. 5.5. Principal components analysis (PCA) of the weed community composition was performed using the community ecology package ‘vegan’ in R (Oksanen et al. Reference Oksanen, Blanchet, Kindt, Lengdre, O’Hara, Simpson, Solymos and Stevens2011; R Development Core Team 2010). Based on Kenkel et al. (Reference Kenkel, Derksen, Thomas and Watson2009), weed density data were scaled to meet the assumptions of parametric analysis, and the species that did not conform to normal distribution were discounted.
Results and Discussion
Effect of PM on Rice Yield and Soil Properties
The average data across the 8 yr suggested significant differences among different treatments on rice yield (Table 1). The yield of PP treatment was the greatest with an average yield of 8570 kg ha−1. The yield for rice in the PP treatment was similar to the yield for TP treatment, which suggests PCU increased rice yield in both cultivation systems. Yield components had significant differences between control plot and N fertilizer–treated plot, except filled grain rate. Fertile panicle number and filled panicle were lower only in the TP0 and PP0 treatments.
Table 1 Effect of different cultivation methods and nitrogen sources on the average value of rice yield, plant height, and yield components across 8 yr.Footnote a

a Significant differences are indicated by different lowercase letters within columns (P<0.05).
b Abbreviations: TF0, traditional flooded cultivation without nitrogen (N) fertilizer; TP, traditional flooded cultivation with polymer-coated urea (PCU); TU, traditional flooded cultivation with urea; PM0, non-flooded plastic film mulching cultivation without N fertilizer; PP, non-flooded plastic film mulching cultivation with PCU; PU, non-flooded plastic film mulching cultivation with urea.
The soil pH in the top layer of PM soil (0 to 5 cm and 5 to 10 cm) remained stable (Table 2). TF led to a distinct decline in the pH of the top layer of soil (0 to 5 cm), soil pH in TF0 and TP was only 5.0, whereas no adverse effect was observed in the 10- to 20-cm soil layer. Different sources of N had no major effect on soil pH. The different methods of cultivation and sources of N affected the content of SOM in the soil layers (0 to 5 cm and 5 to 10 cm) after 8 yr. Compared with TF, PM led to a distinct decline of SOM. SOM in the uppermost soil layer (0 to 5 cm) was 22±1.3 g kg−1 (n=9) and 20±0.9 g kg−1 (n=9) for TF and PM, respectively. Varying the source of N also affected SOM content. However, the use of different cultivation methods or application of different N fertilizers did not lead to any major differences in the deep soil layer (10 to 20 cm).
Table 2 Effect of cultivation and nitrogen (N) sources on pH, soil organic matter (SOM), total nitrogen (TN), Bray P1 method, exchangeable K (EK) in different soil layers after 8 yr.Footnote a

a Data collected in 2016. Values are repoorted as±SE (n=9). **, P<0.05; NS, nonsignificant (P>0.05).
b TF0, traditional flooded cultivation without nitrogen (N) fertilizer; TP, traditional flooded cultivation with polymer-coated urea (PCU); TU, traditional flooded cultivation with urea; PM0, non-flooded plastic film mulching cultivation without N fertilizer; PP, non-flooded plastic film mulching cultivation with PCU; PU, non-flooded plastic film mulching cultivation with urea.
c Abbreviations: C, cultivation; N, N sources; CV, coefficient of variance.
The amount of total nitrogen (TN) in the 0 to 20 cm soil layer was also affected by cultivation. TN levels obtained for PM cultivation were lower than those obtained for TF cultivation. The source of nitrogen had no major effect on TN in the 0- to 10-cm soil layer, but differences were observed between TF and PM treatments in the 10- to 20-cm soil layer. The amount of P in the 0- to 10-cm layer was higher than that in the 10- to 20-cm layer. The concentration of available P was 22.4 mg kg−1, 19.1 mg kg−1, and 3.8 mg kg−1 in the 0- to 5-cm, 5- to 10-cm, and 10- to 20-cm soil layers, respectively. The cultivation methods and nitrogen sources affected soil P content. The average levels of EK in the 0- to 5-cm (50 to 84 mg kg−1), and 5- to 10-cm (32 to 57 mg kg−1) soil layers were also affected by different cultivation methods, and PM led to a decrease of soil EK. The EK contents obtained for different treatments in the 10- to 20-cm (28 to 41 mg kg−1) soil layer were not different. Application of different N fertilizers did not affect soil EK content. However, soil treated with PCU had lower EK in the same soil layer of TF or PM cultivation. Soil nutrients were decreased by long-term PM.
Diversity in Winter Weed Community and Biomass of the Most Abundant Species
Thirteen weed species were observed in the experimental plots (Table 3). Hairy bittercress, Asian mazus, and shortawn foxtail were the most abundant weed species. Densities of the other 11 species were relatively small. Weed species and their densities varied among the treatments. The PU treatment had the richest weed species, with 11 species recorded. But only six species were found in the TU plots. Growth of cucumber herb [Trigonotis peduncularis (Trev.) Benth. ex Baker & S. Moore], Ixeris polycephala Cass., and Bothriospermum zeylanicum (J. Jacq.) was recorded in the plots with PM treatment. However, Jersey cudweed (Gnaphalium affine D. Don.) was only found in plots with TF0 treatment. Total weed density obtained for TF0 was more than 200plantsm−2, whereas the lowest density was obtained for the TU treatment.
Table 3 Weed species density under different treatments.Footnote a

a Abbreviations: TF0, traditional flooded cultivation without nitrogen (N) fertilizer; TP, traditional flooded cultivation with polymer-coated urea (PCU); TU, traditional flooded cultivation with urea; PM0, non-flooded plastic film mulching cultivation without N fertilizer; PP, non-flooded plastic film mulching cultivation with PCU; PU, non-flooded plastic film mulching cultivation with urea.
The diversity index, Shannon’s H′, indicated the diversity among the weed species. Data in Table 4 indicate that the diversity decreased under TP and TU treatments, whereas higher species diversity was observed for the other treatments. Shannon’s E followed the same trend. There were no differences among TF0, PM0, and PP, while Shannon’s E of PM0 was 0.86. The species richness index, Margalef’s D MG, decreased under the TU and PM0 treatments, but increased under the other treatments.
Table 4 Mean of weed species diversity index under different treatments.Footnote a

a Significant differences indicated by different lowercase letters within columns (P<0.05).
b Abbreviations: TF0, traditional flooded cultivation without nitrogen (N) fertilizer; TP, traditional flooded cultivation with polymer-coated urea (PCU); TU, traditional flooded cultivation with urea; PM0, non-flooded plastic film mulching cultivation without N fertilizer; PP, non-flooded plastic film mulching cultivation with PCU; PU, non-flooded plastic film mulching cultivation with urea.
The aboveground biomass of hairy bittercress, Asian mazus, and shortawn foxtail accounted for approximately 86.3% to 99.3% of the total biomass (Table 5). Hairy bittercress grew less vigorously under the TF0 treatment but to a similar extent under the other treatments. Asian mazus showed the greatest growth under PM0 treatment. Shortawn foxtail had high aboveground biomass under all treatments. The other nine species had relatively smaller biomass (Table 5).
Table 5 Aboveground biomass of dominant and total species under different treatments.Footnote a

a Abbreviations: TF0, traditional flooded cultivation without nitrogen (N) fertilizer; TP, traditional flooded cultivation with polymer-coated urea (PCU); TU, traditional flooded cultivation with urea; PM0, non-flooded plastic film mulching cultivation without N fertilizer; PP, non-flooded plastic film mulching cultivation with PCU; PU, non-flooded plastic film mulching cultivation with urea.
b Significant differences indicated by different lowercase letters within columns (P<0.05).
The high densities of some abundant species influenced the overall analysis of community compositional differences (Table 3). PCA was conducted for the weed density data of eight species under different treatments, while the other five species did not conform to the normal distribution, including smallflower umbrella sedge (Cyperus difformis L.), Jersey cudweed, Trigonotis peduncularis, Ixeris polycephala, and Bothriospermum zeylanicum (Figure 1). The results from PCA indicated some significant associations, particularly those between sparrow false pimpernel [Lindernia antipoda (L.) Alston] and PP, and between shortawn foxtail and Asian mazus and TU. Weed communities under the TP, PP, and PU treatments were separated along the first canonical axes, and accounted for 45.5% of the total variance. The rest of the treatments were separated from each other by PC2 and accounted for 28.8% of the total variance. Correlation analyses showed that EK had a significant relationship with the first canonical variable (Figure 2).
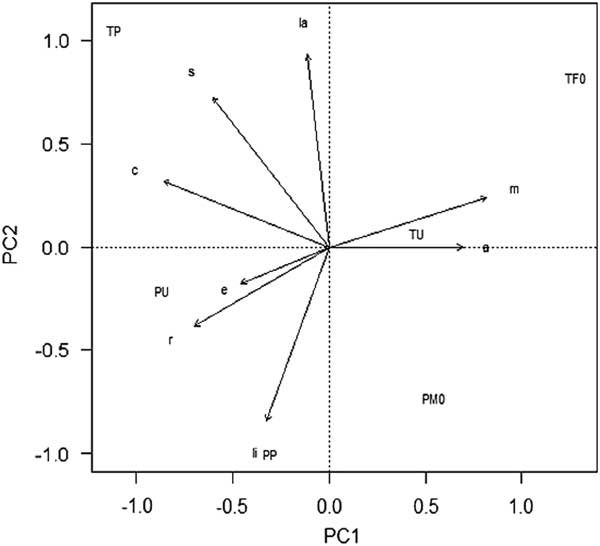
Figure 1 Principal components analysis ordination diagram of weed species and weed communities under different treatments. a, Alopecurus aequalis; c, Cardamine hirsuta; e, Erigeron canadensis; la, Lapsanastrum apogonoides; li, Lindernia antipoda; m, Mazus pumilus; r, Rumex japonicus; s: Stellaria media.
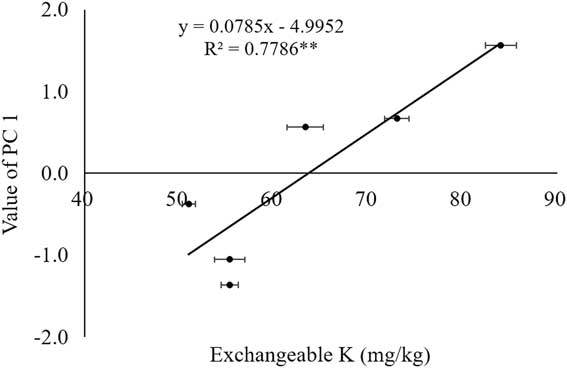
Figure 2 Relationship between exchangeable K in 0- to 5-cm soil layer and the first canonical variable (PC 1) of principal components analysis.
Seedlings of Spring-germinating Weeds
Seedlings of four abundant spring-germinating species were counted individually, except some germinating species that were too small to be identified. Smallflower umbrella sedge, Ludwigia prostrata Roxb., prostrate false pimpernel, and Asian mazus were germinated under a range of treatments. The total density of spring-germinating seedlings was the highest (more than 3,500 plants m−2, Figure 3) in TF0. The second-highest total weed density was obtained for PM0, while the densities of spring-germinating seedlings were low for the other treatments. Seedlings of smallflower umbrella sedge accounted for a large proportion of the total spring-germinating seedlings. For TF0 treatment, approximately 1,800 seedlings of smallflower umbrella sedge, 1,075 seedlings of Ludwigia prostrata Roxb., 800 seedlings of prostrate false pimpernel, and 23 seedlings of Asian mazus were observed per square meter. Approximately 500 seedlings of smallflower umbrella sedge and more than 850 seedlings of prostrate false pimpernel were observed in PM0. Lower number of spring-germinating seedlings were observed for the other four treatments. The seedlings of prostrate false pimpernel were only present when flooded cultivation methods were used and were absent when PM cultivation methods were employed.
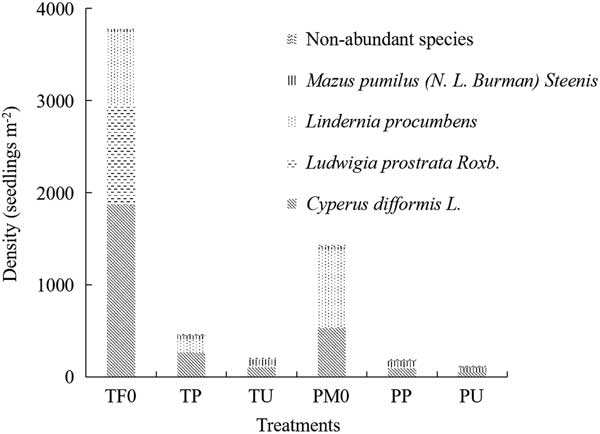
Figure 3 Seedling density of spring-germinating weeds under different treatments.
PM is an alternative method for rice cultivation and has been used in China for decades (Peng et al. Reference Peng, Shen, Wang, Liu, Luo and Wu1999; Wu et al. Reference Wu, Zhu, Liang and Zhang2001). In contrast to the traditional flooded method for rice cultivation, this method does not require a stable water layer. Previous studies have indicated that PM has a positive effect on crop yield, efficiency of water use, and nitrogen use efficiency (Li et al. Reference Li, Wu, Zhao, Lu, Fan and Zhang2007; Liu et al. Reference Liu, Wang, Lu, Zhang, Zeng, Ai, Peng and Christie2003; Zhang et al. Reference Zhang, Zhang, Yang and Zhang2008). We found that combination of PM and PCU increased rice yield (Table 2). The plastic film aided in maintaining the soil moisture content and increased soil temperature (Li et al. Reference Li, Wu, Zhao, Lu, Fan and Zhang2007; Liu et al. Reference Liu, Wang, Lu, Zhang, Zeng, Ai, Peng and Christie2003). The effects of the plastic film on soil properties have been documented for different crop systems. Fan et al. (Reference Fan, Liu, Jiang, Zhang, Lu, Zeng and Christie2005) reported that the plastic film helped in maintaining soil’s organic carbon content and TN levels in an experimental system consisting of rice and wheat (Triticum aestivum L.). Compared with TF, PM did not alter soil quality. Our results show that soil properties in the 0- to 10-cm soil layer were influenced by PM, and SOM declined after 8 yr (Table 2). This result is consistent with the results obtained by Hu et al. (Reference Hu, Yang, Liang, Liu and Chen1999), who reported that PM led to an 8% decline in SOM. Li et al. (Reference Li, Wu, Zhao, Lu, Fan and Zhang2007) also reported a decline in SOM in the 0- to 15-cm soil layer during a 3-yr experiment conducted in the same area as the present study. Li et al. (Reference Li, Wu, Zhao, Lu, Fan and Zhang2007) found 70% of rice roots were distributed in the top soil layer of PM-treated plots, which might have led to an increase in the absorption of nutrients in the top soil layer. Liu et al. (Reference Liu, Ai, Zhang, Lu, Zeng and Fan2005) pointed out that environmental factors, moisture, and temperature of soil surface were affected by the plastic film, and these factors influenced the rice root growth. Compared with initial soil nutrition in 2008, soil EK declined in all plots (Table 2), which was similar to the results of Liu et al. (Reference Liu, Ai, Zhang, Lu, Zeng and Fan2005).
Crop management can alter weed community composition (Andersson and Milberg Reference Andersson and Milberg1998; Derksen and Swanton Reference Derksen and Swanton1993, Reference Derksen and Swanton1994; Yin et al. Reference Yin, Cai and Zhong2005, Reference Yin, Cai and Zhong2006). We observed that the plastic film controlled weed growth during the rice-growing period. However, the film was removed after the rice was harvested. Our results showed that the weed density was also high in PM plots in the fallow period (Table 3). Some species such as hairy bittercress, Asian mazus, and shortawn foxtail were more abundant than other species. The weeds Trigonotis peduncularis, Ixeris polycephala, and Bothriospermum zeylanicum were recorded when PM was used for cultivation, while Jersey cudweed growth was observed when TF was used for cultivation. An E close to 1 means that a species is present at about the same density; an E value lower than 1 indicates that some species are more dominant than others. Our results suggest that distribution of winter weeds was more even in PM0 than TP (Table 4). Different methods of crop management influenced soil fertility, and soil fertility influenced weed diversity. However, we only present 1 yr of data for weed diversity after 8 yr of application of different farming practices; it is unclear what the variation would be across a series of years. Nitrogen is the most important element for weed growth and diversity (Freyman et al. Reference Freyman, Kowalenko and Hall1989). Yin et al. (Reference Yin, Cai and Zhong2005) reported that phosphorus also played an important role in the composition of weed communities. Here our results suggest that EK level in the 0- to 5-cm soil layer had a significant effect on the weed community (Figure 2).
The emergence of spring weed seedlings was determined by the spring seedbank. Smallflower umbrella sedge, prostrate false pimpernel, and Asian mazus were the major spring-germinating species. The evaluation of spring weed seedlings indicated that plots without N fertilizer had higher weed density than those that had long-term N treatments. Many factors such as light, temperature, and nutrients in the soil influence seed germination (Freyman et al. Reference Freyman, Kowalenko and Hall1989). Rice plants do not grow as large in a plot with no N fertilizer, leaving more space for weeds (Yin et al. Reference Yin, Cai and Zhong2006). So a plot with no N fertilizer may have a richer soil seedbank, which will determine the number of weed seedlings. The next step is to address the soil seedbank.
Acknowledgments
We thank Genxing Ni for his support during the management of the field experiment. This research was supported by the National Natural Science Foundation of China (No. 31172032) and the National Basic Research Program of China (No. 2015CB150502).


