


Introduction
Waterhemp [Amaranthus tuberculatus (Moq.) J. D. Sauer] (Sauer Reference Sauer1955), a small-seeded, summer annual weed species, is controlled by most Group 15 very-long-chain fatty-acid (VLCFA)-inhibiting herbicides (Loux et al. Reference Loux, Doohan, Dobbels, Reeb, Johnson, Young, Ikley and Hager2018). Amaranthus tuberculatus is one of the most problematic weed species in corn (Zea mays L.) and soybean [Glycine max (L.) Merr.] production across the midwestern United States. This species is capable of producing thousands of seeds per female plant under suboptimal conditions (Steckel et al. Reference Steckel, Sprague, Hager, Simmons and Bollero2003), and these seeds can be viable as early as 9 d after pollination (Bell and Tranel Reference Bell and Tranel2010). In addition, seed dormancy allows A. tuberculatus seedlings to emerge continually throughout the growing season (Buhler and Hartzler Reference Buhler and Hartzler2001; Hartzler et al. Reference Hartzler, Buhler and Stoltenberg1999). High reproductive output and prolonged emergence make residual chemical control essential for A. tuberculatus management (Steckel et al. Reference Steckel, Sprague and Hager2002).
More troublesome than ecological factors is the inherent ability of A. tuberculatus to evolve resistance to herbicides from multiple sites of action (SOAs). Amaranthus tuberculatus is dioecious and an obligate-outcrossing species (Murray Reference Murray1940; Sauer Reference Sauer1955), which increases intraspecific genetic variability compared with monoecious Amaranthus species. This high degree of genetic variability allows weediness traits, including herbicide resistance, to spread among and within populations (Steckel Reference Steckel2007; Tranel et al. Reference Tranel, Riggins, Bell and Hager2011). To date, A. tuberculatus is resistant to herbicides from six SOAs, including herbicides that inhibit 4-hydroxyphenylpyruvate dioxygenase (HPPD), photosystem II (PSII), acetolactate synthase (ALS), protoporphyrinogen oxidase (PPO), and 5-enolpyruvylskikimate-3-phosphate synthase and the synthetic auxin 2,4-D (Heap Reference Heap2018). In addition, resistance to herbicides from various SOAs has stacked within A. tuberculatus populations, resulting in plants with resistance to herbicides from three, four, five, and six SOA groups (Bell et al. Reference Bell, Hager and Tranel2013; Evans Reference Evans2016; Patzoldt et al. Reference Patzoldt, Tranel and Hager2005; Shergill et al. Reference Shergill, Barlow, Bish and Bradley2018).
The biology of A. tuberculatus makes it well suited to compete with summer annual crops such as corn, soybean, and sorghum [Sorghum bicolor (L.) Moench] (Steckel Reference Steckel2007). In corn, the greatest yield losses result from interference up to the V6 growth stage, with the potential for more than 50% yield loss (Steckel and Sprague Reference Steckel and Sprague2004). In total, 74% yield loss in corn is possible if season-long competition occurs (Steckel and Sprague Reference Steckel and Sprague2004). Amaranthus tuberculatus interference can also cause more than 40% yield reduction in soybean (Hager et al. Reference Hager, Wax, Stoller and Bollero2002b). Given the increasing frequency of populations with resistance to herbicides from multiple SOAs, integrated strategies are essential for A. tuberculatus management (Hager et al. Reference Hager, Wax, Simmons and Stoller1997; Tranel et al. Reference Tranel, Riggins, Bell and Hager2011). Incorporating multiple, effective SOAs each season is one strategy to reduce the frequency of resistant plants that survive and further contribute to the soil seedbank (Evans et al. Reference Evans, Tranel, Hager, Schutte, Wu, Chatham and Davis2016). VLCFA-inhibiting herbicides are labeled for use in many crops and remain an effective way to incorporate an additional SOA with residual activity into integrated management programs.
Chloroacetamide herbicides have been used for PRE control of grass and small-seeded dicot weeds since their discovery and commercialization in the 1950s (Hamm Reference Hamm1974). Active ingredients from this family belong to the Group 15 class of herbicides and control sensitive species by inhibiting the VLCFA elongase complex, resulting in depletion of VLCFAs in excess of 18 carbons (Bach and Faure Reference Bach and Faure2010; Böger Reference Böger2003). Sensitive dicot weed seedlings either fail to emerge or remain in an arrested state of growth soon after cotyledon expansion (Deal and Hess Reference Deal and Hess1980; Dhillon and Anderson Reference Dhillon and Anderson1972; Fuerst Reference Fuerst1987; Pillai et al. Reference Pillai, Davis and Truelove1979).
Resistance to VLCFA inhibitors is a relatively rare occurrence. To date, only five species of grasses worldwide are resistant to herbicides from this class, with resistance in dicot weed species yet to be documented (Heap Reference Heap2018). The low level of resistance to these PRE herbicides could be explained by naturally less intense selection pressure than POST herbicides, such as glyphosate, and the inability of surviving weeds to overcome subsequent POST herbicides (Somerville et al. Reference Somerville, Powles, Walsh and Renton2017). In addition, mutations in VLCFA elongases are unlikely, as any change in the target site might alter the ability of normal substrates to bind (due to competitive inhibition kinetics) and, more likely, multiple enzymatic detoxification processes must be present in order to confer resistance (Böger Reference Böger2003). In nearly all cases, resistance to VLCFA-inhibiting herbicides occurs in multiple herbicide–resistant (MHR) populations, potentially through cross-resistance mechanisms or indirect selection through the use of herbicides from other SOAs (Burnet et al. Reference Burnet, Barr and Powles1994; Busi and Powles Reference Busi and Powles2016).
Research results from investigating a population of A. tuberculatus resistant to HPPD-inhibiting herbicides in Mclean County, IL (Hausman et al. Reference Hausman, Singh, Tranel, Riechers, Kaundun, Polge, Thomas and Hager2011), indicated that S-metolachlor provided significantly less PRE control than anticipated (Hausman et al. Reference Hausman, Tranel, Riechers, Maxwell, Gonzini and Hager2013). This population (designated MCR) was subsequently characterized as resistant to HPPD-, ALS-, and PSII-inhibiting herbicides (Hausman et al. Reference Hausman, Singh, Tranel, Riechers, Kaundun, Polge, Thomas and Hager2011, Reference Hausman, Tranel, Riechers, Maxwell, Gonzini and Hager2013, Reference Hausman, Tranel, Riechers and Hager2016). During research conducted on a separate population from Champaign County, IL, with resistance to HPPD, ALS, PSII, and PPO inhibitors and 2,4-D (designated CHR), similar observations in regard to less than expected control were made with S-metolachlor (Evans Reference Evans2016). In both cases, another herbicide from the same class, acetochlor (Figure 1), remained relatively effective (Evans Reference Evans2016; Hausman et al. Reference Hausman, Tranel, Riechers, Maxwell, Gonzini and Hager2013). Based on similarities between these MHR populations, experiments were designed to explore the consistent differences in PRE control among various VLFCA-inhibiting herbicides. The objectives of this research were to investigate the response of the CHR population to VLCFA-inhibiting herbicides and specifically compare acetochlor and S-metolachlor at different rates under field conditions. Experiments were subsequently initiated under greenhouse conditions to compare the response of CHR to VLCFA inhibitors with that of other populations, including the MCR population, for which the initial field observations of reduced efficacy had been made (Hausman et al. Reference Hausman, Tranel, Riechers, Maxwell, Gonzini and Hager2013).

Figure 1. Chemical structures and physical properties of select very-long-chain fatty-acid–inhibiting active ingredients. Chemical structures generated via ACD ChemSketch Freeware v. 17.01 (Advanced Chemistry Development, Toronto, ON, Canada; www.acdlabs.com). Chemical properties obtained from Shaner (Reference Shaner2014) or Jhala (Reference Jhala2017).
Materials and methods
Characterization of a multiple herbicide–resistant Amaranthus tuberculatus population response to VLCFA-inhibiting herbicides under field conditions
General field methods
Field experiments were conducted in 2016 and 2017 at a site in Champaign County, IL, where the CHR population with multiple resistance to HPPD-, PPO-, PSII-, and ALS-inhibiting herbicides plus the synthetic auxin 2,4-D was documented (Evans Reference Evans2016). Past row-crop history of the field included an annual rotation of non-GMO corn and glyphosate-resistant soybean.
The soil at the site is a Flanagan silt loam (fine, smectitic, mesic Aquic Argiudolls) with a pH of 5.5 and 4.8% organic matter. The soil was tilled before herbicide application to control existing vegetation, and experiments were established in nonplanted stale seedbeds. The natural A. tuberculatus population was evenly distributed across the location. Individual plots measured 3 by 7.6 m and were arranged in a randomized complete block design with four replications in 2016 and three replications in 2017. Cumulative precipitation during field experiments in 2016 and 2017 is presented in Table 1.
Table 1. Cumulative precipitation recorded at the Champaign County, IL, field location during 2016–2017 field experiments.

Two field experiments included a VLCFA-inhibitor comparison and a herbicide rate titration. For the herbicide-comparison experiment, eight commercially available VLCFA-inhibiting herbicides were selected and compared at 1X doses based on manufacturers’ labeled recommendations for the soil type (Table 2). The rate titration experiment included three VLCFA inhibitors (nonencapsulated acetochlor, S-metolachlor, and pyroxasulfone), each applied at 0.5X, 1X, 2X, and 4X doses based on the 1X manufacturer recommended rate (Table 2). Pyroxasulfone is a pyrazole and is applied at a much lower use rate; it was included in experiments due to having the same SOAs and target weed spectrum as chloroacetamide herbicides (Nakatani et al. Reference Nakatani, Yoshihiro, Honda and Uchida2016; Tanetani et al. Reference Tanetani, Kaku, Kawai, Fujioka and Shimizu2009, Reference Tanetani, Fujioka, Kaku and Shimizu2011). Treatments were applied on May 23, 2016, and June 14, 2017 with a pressurized CO2 backpack sprayer calibrated to deliver 187 L ha−1 at 276 kPa with a 3-m boom consisting of six AI110025VS nozzles (TeeJet® Technologies, P.O. Box 7900, Wheaton, IL 60187) spaced 51 cm apart.
Table 2. Very-long-chain fatty-acid–inhibiting herbicides, rates, and source information for field studies at the Champaign County, IL, site (2016–2017).a

a Herbicides were applied to bare ground before weed emergence.
b Encapsulated formulation.
c Contains the herbicide safener benoxacor.
Visual ratings of A. tuberculatus control were recorded at 28 and 42 d after treatment (DAT) using a scale of 0% (no control) to 100% (complete control). Ratings considered A. tuberculatus injury, biomass reduction, and emergence compared with a nontreated control. Amaranthus tuberculatus density was recorded within two 0.25-m2 quadrats at 28 and 42 DAT. Quadrats were randomly placed in the center of each plot, and counts were taken within the same area both times. Amaranthus tuberculatus biomass was harvested from each quadrat at 42 DAT, samples were combined and dried in a forced-air dryer at 65 C, and dry biomass was recorded.
Statistical analysis
Statistical analysis was conducted with SAS v. 9.4 (SAS Institute, 100 SAS Campus Drive, Cary, NC 27513). Biomass, density, and control ratings were analyzed by ANOVA in PROC MIXED. Amaranthus tuberculatus density measurements were analyzed as a repeated measure. For the VLCFA-inhibitor comparison study, treatment was considered a fixed effect, while in the rate titration study, treatment, rate, and their interactions were considered fixed effects. Year and block within year were considered random effects in both experiments. Initial analysis revealed a significant treatment by days after treatment interaction for A. tuberculatus density in the herbicide-comparison study. Mean estimates were separated by LSD using the SAS macro %pdmix800 (Saxton Reference Saxton1998) with α = 0.05. The assumption of normally distributed residuals was reviewed with PROC UNIVARIATE, and homogeneous variance was verified with PROC GLM. Density values were subject to a square-root transformation to meet assumptions, and back-transformed data are presented as plants per square meter.
VLCFA-inhibitor greenhouse dose–response experiments
Amaranthus tuberculatus populations
Four A. tuberculatus populations were selected to characterize their response to S-metolachlor, acetochlor, dimethenamid-P, and pyroxasulfone. CHR-M6 is the progeny of greenhouse crosses and was confirmed resistant to atrazine and HPPD-, PPO-, and ALS-inhibiting herbicides plus 2,4-D (Evans Reference Evans2016). Similarly, MCR-NH40, analogous to the HPPD inhibitor–resistant and atrazine-resistant NH41 population described in Hausman et al. (Reference Hausman, Tranel, Riechers, Maxwell, Gonzini and Hager2013), was included for comparison with CHR-M6 (Evans Reference Evans2016). Two HPPD inhibitor–sensitive populations (ACR, WUS) were included to calculate R:S ratios. ACR is resistant to atrazine (due to rapid metabolism; Ma et al. Reference Ma, Kaundun, Tranel, Riggins, McGinness, Hager, Hawkes, McIndoe and Riechers2013) and ALS- and PPO-inhibiting herbicides (Patzoldt et al. Reference Patzoldt, Tranel and Hager2005), while WUS is not resistant to any herbicide. All seeds were stratified according to methods previously described (Bell et al. Reference Bell, Hager and Tranel2013) and stored at 4 C for at least 20 d before experiment initiation to improve germination.
Plant culture
Plastic cell-pack inserts (384 cm3 per cell) were filled halfway with growth medium (1:1:1 mixture of soil, peat, and sand, with a pH of 6.4 and 3.5% organic matter) and slow-release fertilizer (Scotts Osmocote® Classic 13-13-13, Scotts Company, 14111 Scottslawn Road, Marysville, OH 43041) was added. Each cell was then filled to the top, lightly tamped, and then soaked in water for 12 h to provide a uniformly moist seedbed. Fifteen seeds from each population were sown on the soil surface in a 3 by 5 grid with 1 cm between each of the outside rows and the side of the insert. After sowing, 10 ml of the same growth medium was passed through a 3.5-mm sieve and spread evenly across the surface. Plants were supplied weekly with water-soluble fertilizer (Peters® 20-20-20, Everris NA, P.O. Box 3310, Dublin, OH 43016) and greenhouse conditions were maintained at 28/22 C day/night with a 16-h photoperiod. Natural sunlight was supplemented with mercury-halide lamps to provide 800 µmol m−2 s−1 photon flux at the soil surface.
Herbicide application
All herbicides were applied PRE at increasing rates on a base 3.16 logarithmic scale. Each population was treated with S-metolachlor at rates ranging 8.4 to 8,390 g ai ha−1, acetochlor at rates ranging from 2.5 to 2,530 g ai ha−1, dimethenamid-P at rates ranging from 3.4 to 3,470 g ai ha−1, or pyroxasulfone at rates ranging from 0.8 to 780 g ai ha−1. Herbicides were applied with a compressed-air research sprayer (Generation III Research Sprayer, DeVries Manufacturing, 86956 State Highway 251, Hollandale, MN 56045) fitted with a single TeeJet® 80015EVS nozzle set 46 cm above the medium surface and calibrated to deliver 187 L ha−1 at 275 kPa. After herbicide application, a method modified from Busi and Powles (Reference Busi and Powles2016) was used to add an additional 25 ml of sieved growth medium on top of the treated medium to simulate mechanical incorporation of the herbicide. Pots were then returned to the greenhouse and maintained beneath an overhead misting system. The mister was equipped with 0.4 L min−1 nozzles (Netafim™ USA, 5470 East Home Avenue, Fresno, CA 93727) and programmed to cycle three times daily in order to maintain adequate soil moisture.
Data collection and statistical analysis
In all experiments, each treatment by population combination consisted of three replications. Dose–response experiments with acetochlor and S-metolachlor were performed simultaneously and conducted twice. Dose–response experiments with dimethenamid-P and pyroxasulfone were performed simultaneously and conducted three times. At 21 DAT, surviving seedlings were counted, and aboveground biomass was harvested. Harvested plants were placed in a forced-air dryer set at 65 C for 7 d, and dry biomass was recorded. Statistical analysis was performed using R software v. 3.4.2. Pooled biomass and survival data were then analyzed using nonlinear regression in the DRC package in R (Knezevic et al. Reference Knezevic, Streibig and Ritz2007). Data derived from plant population effects within acetochlor, S-metolachlor, dimethenamid-P, and pyroxasulfone herbicide treatments were analyzed separately. The four-parameter dose–response logistic function was fit using the following equation:
 $y = c + {{d - c} \over {1 + {\rm{exp}}\left\{ {b\left[ {\log \left( x \right) - {\rm{log}}({\rm{L}}{{\rm{D}}_{50}}/{\rm{G}}{{\rm{R}}_{50}})} \right]} \right\}}}$
where b is the slope of the curve, c is the lower asymptote, d is the upper asymptote, and LD50 and GR50 are the 50% reduction in seedling survival and plant biomass, respectively. Initially LD50 and GR50 values were calculated for each individual experimental run. Effective dose values were then analyzed by ANOVA via a general linear mixed-effects model in the NLME package in R to test the main effects of treatment, population, and their interactions. Experimental run was considered a random effect in order to test the significance of main effects across both experimental runs.
Results and Discussion
Characterization of a multiple herbicide–resistant Amaranthus tuberculatus population response to VLCFA-inhibiting herbicides under field conditions
VLCFA-inhibitor comparison
Amaranthus tuberculatus control was 75% or less at 28 DAT for all herbicides tested (Table 3). Nonencapsulated acetochlor, alachlor, and pyroxasulfone provided the greatest control of the CHR population, providing 75%, 67%, and 56% control, respectively. Control did not exceed 27% for all other treatments. In addition, nonencapsulated acetochlor, alachlor, and pyroxasulfone provided the greatest density reduction at 28 DAT (12, 21, and 34 plants m−2, respectively), which corresponds with visual estimations of control. Amaranthus tuberculatus densities among other treatments were not different from those of nontreated plots.
Table 3. Mean estimatesa of Amaranthus tuberculatus control at 28 and 42 d after treatment (DAT), density at 28 and 42 DAT, and recovered biomass at 42 DAT of very-long-chain fatty-acid–inhibiting herbicides (2016–2017).

a Mean estimates followed by the same letter within a column are not significantly different at α = 0.05 (separated by LSD using the SAS macro %pdmix800).
b Encapsulated formulation.
c Contains the herbicide safener benoxacor.
Results at 28 DAT are similar to previous studies conducted from 2014 to 2015 at the CHR location. In previous studies, a labeled rate of nonencapsulated acetochlor provided 88% control of CHR, while S-metolachlor did not exceed 46% control at 28 DAT (Evans Reference Evans2016). At the MCR location, where a large difference in efficacy between S-metolachlor and nonencapsulated acetochlor was initially documented (Hausman et al. Reference Hausman, Tranel, Riechers, Maxwell, Gonzini and Hager2013), greater than 83% control was measured with a labeled rate of nonencapsulated acetochlor, while S-metolachlor provided less than 18% control at 30 DAT. In contrast, A. tuberculatus control greater than 98% and 95% with nonencapsulated acetochlor and S-metolachlor, respectively, has been reported at 28 d after planting (DAP) (Steckel et al. Reference Steckel, Sprague and Hager2002), which is much greater than control documented in the present research.
In addition to the differences noted between nonencapsulated acetochlor and S-metolachlor, pyroxasulfone provided less control of CHR than demonstrated with other HPPD inhibitor–resistant and atrazine-resistant populations. Greater than 87% control was recorded for the MCR A. tuberculatus population (Hausman et al. Reference Hausman, Tranel, Riechers, Maxwell, Gonzini and Hager2013) and 83% to 95% control was reported for an HPPD inhibitor–resistant population from Nebraska (Oliveira et al. Reference Oliveira, Jhala, Gaines, Irmak, Amundsen, Scott and Knezevic2017). Control of MCR with alachlor was 62% to 78% at 30 DAT (Hausman et al. Reference Hausman, Tranel, Riechers, Maxwell, Gonzini and Hager2013), which is consistent with the results from the present research.
No PRE treatment exceeded 42% control at 42 DAT (Table 3). Control with nonencapsulated acetochlor was 42%, while alachlor and pyroxasulfone provided 31% and 21% control, respectively. All other treatments provided less than 10% control. Plots treated with nonencapsulated acetochlor, alachlor, and pyroxasulfone provided the greatest density reduction at 42 DAT (14, 26, and 36 plants m−2, respectively), similar to results at 28 DAT. Amaranthus tuberculatus densities among other treatments were not different from those of nontreated plots. Only two treatments (nonencapsulated acetochlor and alachlor) reduced biomass more than the nontreated control at 42 DAT. Biomass from plots treated with nonencapsulated acetochlor and alachlor was 135 and 241 g m−2, respectively.
In previous studies conducted at the CHR location from 2014 to 2015, control with labeled rates of nonencapsulated acetochlor and S-metolachlor was 70% and 5%, respectively, at 42 DAT (Evans Reference Evans2016). Control with nonencapsulated acetochlor was greater than that recorded in the present research at 42 DAT, but the difference in control with nonencapsulated acetochlor and S-metolachlor remained similar. In contrast, 57% control of A. tuberculatus with S-metolachlor and 61% control with nonencapsulated acetochlor at 56 DAP has been reported (Steckel et al. Reference Steckel, Sprague and Hager2002). Moreover, greater than 80% control of A. tuberculatus has been achieved with S-metolachlor at 8 wk after planting (Johnson et al. Reference Johnson, Chahal and Regehr2012), and 80% control with racemic metolachlor has been documented at 4 wk after planting (Hager et al. Reference Hager, Wax, Bollero and Simmons2002a).
Results at 28 and 42 DAT also revealed a large difference in PRE control with encapsulated and nonencapsulated acetochlor. The dissimilar control of CHR could be due to the extended-release characteristics of the encapsulated formulation. Initially, emerging seedlings in plots treated with encapsulated acetochlor were likely exposed to less active herbicide than those in plots treated with nonencapsulated acetochlor, resulting in less control and higher plant densities at 28 and 42 DAT.
VLCFA-inhibitor rate titration
Nonencapsulated acetochlor provided greater control of CHR at 28 DAT when compared with 0.5X or 1X rates of pyroxasulfone or any rate of S-metolachlor (Table 4). A 1X rate of nonencapsulated acetochlor controlled CHR 67%, which is slightly less than control reported for the comparison study (Table 3). Treatments providing the greatest control were nonencapsulated acetochlor at 2X (85%) and 4X (94%) rates and pyroxasulfone at 2X (63%) and 4X (74%) rates. S-metolachlor, regardless of rate, did not provide greater than 45% control of CHR. Previous studies at the CHR location at 28 DAT reported 79% to 95% control with nonencapsulated acetochlor, 48% to 84% control with pyroxasulfone, and 20% to 62% control with S-metolachlor applied at 0.5 to 2X rates (Evans Reference Evans2016).
Table 4. Mean estimatesa of Amaranthus tuberculatus control at 28 and 42 d after treatment (DAT) from the very-long-chain fatty-acid–inhibitor rate titration study (2016–2017).

a Mean estimates followed by the same letter within a column are not significantly different at α = 0.05 (separated by the SAS macro %pdmix800).
b Relative rate based on manufacturers’ labeled recommendations.
In general, A. tuberculatus density (plants m−2) at 28 DAT decreased as herbicide rate increased (Figure 2). Densities in plots treated with nonencapsulated acetochlor were 4 to 73 plants m−2. Pyroxasulfone-treated plots had densities ranging from 32 to 117 plants m−2, and plots treated with S-metolachlor had plant densities ranging from 52 to 204 plants m−2. Selected 1 df contrasts were performed between increasing rates of nonencapsulated acetochlor and a 4X rate of S-metolachlor (Table 5). Amaranthus tuberculatus densities at 28 DAT in plots treated with 0.5X, 1X, and 2X rates of nonencapsulated acetochlor were not significantly different from those of plots treated with a 4X rate of S-metolachlor.

Figure 2. Relationship of Amaranthus tuberculatus density at 28 DAT at the Champaign County, IL, location in response to increasing rates of three very-long-chain fatty-acid inhibitors (2016–2017). A continuous line with solid squares signifies treatments of S-metolachlor; a discontinuous line with solid triangles signifies treatments of pyroxasulfone; and a continuous line with solid circles represents treatments of acetochlor. Symbols on each line signify the mean ± SE.
Table 5. Select contrasts of Amaranthus tuberculatus density at 28 and 42 d after treatment (DAT) and recovered biomass at 42 DAT between a rate of S-metolachlor compared with increasing rates of acetochlor from the very-long-chain fatty-acid–inhibitor rate titration study (2016–2017).

All treatments, regardless of rate, provided less control of the CHR population by 42 DAT than at 28 DAT (Table 4). Overall, the highest levels of control were achieved with nonencapsulated acetochlor or pyroxasulfone at 2X and 4X rates. S-metolachlor at a 4X rate provided 23% control at 42 DAT, and all other rates provided less than 10% control. Previous studies at the CHR location at 42 DAT reported 54% to 85% control with nonencapsulated acetochlor, 17% to 75% control with pyroxasulfone, and 5% to 39% control with S-metolachlor applied at 0.5 to 2X rates (Evans Reference Evans2016).
In general, A. tuberculatus density (plants m−2) at 42 DAT decreased as herbicide rate increased (Figure 3). Densities in plots treated with nonencapsulated acetochlor were 7 to 71 plants m−2. Pyroxasulfone-treated plots had densities ranging from 31 to 118 plants m−2, and plots treated with S-metolachlor had plant densities ranging from 56 to 137 plants m−2. Selected 1 df contrasts between increasing rates of nonencapsulated acetochlor and a 4X rate of S-metolachlor are presented (Table 5). Amaranthus tuberculatus densities at 42 DAT in plots treated with 0.5X, 1X, and 2X rates of nonencapsulated acetochlor were not significantly different from plots treated with a 4X rate of S-metolachlor.

Figure 3. Relationship of Amaranthus tuberculatus density at 42 DAT at the Champaign County, IL, location in response to increasing rates of three very-long-chain fatty-acid inhibitors (2016–2017). A continuous line with solid squares signifies treatments of S-metolachlor; a discontinuous line with solid triangles signifies treatments of pyroxasulfone; and a continuous line with solid circles represents treatments of acetochlor. Symbols on each line signify the mean ±SE.
In all treatments at 42 DAT, biomass decreased in response to 1X to 4X rates of each herbicide (Figure 4). Biomass from plots treated with nonencapsulated acetochlor ranged from 356 to 38 g m−2 and pyroxasulfone ranged from 393 to 104 g m−2 as rates increased. Overall, reduction in plant biomass was variable, and S-metolachlor–treated plots had biomass ranging from 417 to 285 g m−2 as rates increased. Surprisingly, 1X rates of all treatments had slightly greater biomass than plots treated with 0.5X rates. Plots treated with 1X rates had lower A. tuberculatus densities than plots treated with 0.5X rates (Figure 3). This unusual observation may be explained by lower intraspecific competition or, potentially, hormesis (Belz and Duke Reference Belz and Duke2014). Selected 1 df contrasts between increasing rates of acetochlor and a 4X rate of S-metolachlor at 28 and 42 DAT (Table 5) showed that biomass recovered from plots treated with 0.5X, 1X, and 2X rates of nonencapsulated acetochlor were not significantly different from that recovered from plots treated with a 4X rate of S-metolachlor.

Figure 4. Relationship of accumulated biomass per square meter (g m−2) at 42 DAT at the Champaign County, IL, location in response to increasing rates of three very-long-chain fatty-acid inhibitors (2016–2017). A continuous line with solid squares signifies treatments of S-metolachlor; a discontinuous line with solid triangles signifies treatments of pyroxasulfone; and a continuous line with solid circles represents treatments of acetochlor. Symbols on each line signify the observed mean ±SE.
The VLCFA inhibitors included at the CHR site possess different physicochemical properties, such as water solubility and soil-binding characteristics (Figure 1), and their efficacy can be affected by environmental factors and the timing of A. tuberculatus emergence. Greenhouse dose–response experiments were designed to compare VLCFA-inhibiting herbicides with a uniform soil type and watering regimen. Limiting environmental variability allowed comparison of the responses of CHR and other A. tuberculatus populations to various VLCFA-inhibiting herbicides.
VLCFA-inhibitor greenhouse dose–response experiments
Following herbicide application, A. tuberculatus seedlings had emerged consistently in each insert by 5 DAT. Plants from each population initially appeared healthy, but by 7 DAT, treated plants began exhibiting less vigor than nontreated plants. This pattern continued throughout the entire experiment, and affected plants remained in an arrested state of growth or died during the 21-d period (unpublished data). Similar symptomology has been previously reported for various dicot species following treatment with VLCFA-inhibiting herbicides (Deal and Hess Reference Deal and Hess1980; Dhillon and Anderson Reference Dhillon and Anderson1972; Fuerst Reference Fuerst1987). Initial ANOVA analysis of LD50 and GR50 values revealed significant population, treatment, and population by treatment interactions across experimental replications.
Dose response to S-metolachlor
Both HPPD inhibitor–sensitive populations (ACR and WUS) were controlled at 270 g ha−1 or less by 21 DAT (Figures 5 and 6). In contrast, both CHR-M6 and MCR-NH40 survived 2.7 kg ha−1 (Figure 5), and on occasion, replications (individual containers) of either population survived 8.4 kg ha−1. Survivors from replicates treated with 2.7 or 8.4 kg ha−1 were severely stunted, but plants continued growing with at least one true leaf. Extra inserts treated with 2.7 kg ha−1 were allowed to persist past 21 DAT and eventually progressed through full reproductive development (unpublished data).

Figure 5. Response of four Amaranthus tuberculatus populations at 14 DAT to (A) 25 g acetochlor ha−1, (B) 800 g acetochlor ha−1, (C) 270 g S-metolachlor ha−1, and (D) 2,650 g S-metolachlor ha−1. In each frame, outside columns are nontreated (signified by “U”) and treated containers are located in the center below the labeled rate. Populations (1, CHR-M6; 2, MCR-NH40; 3, WUS; 4, ACR) are displayed with nontreated nearest number and corresponding treatment directly adjacent. Herbicide treatments were applied directly to the soil PRE.
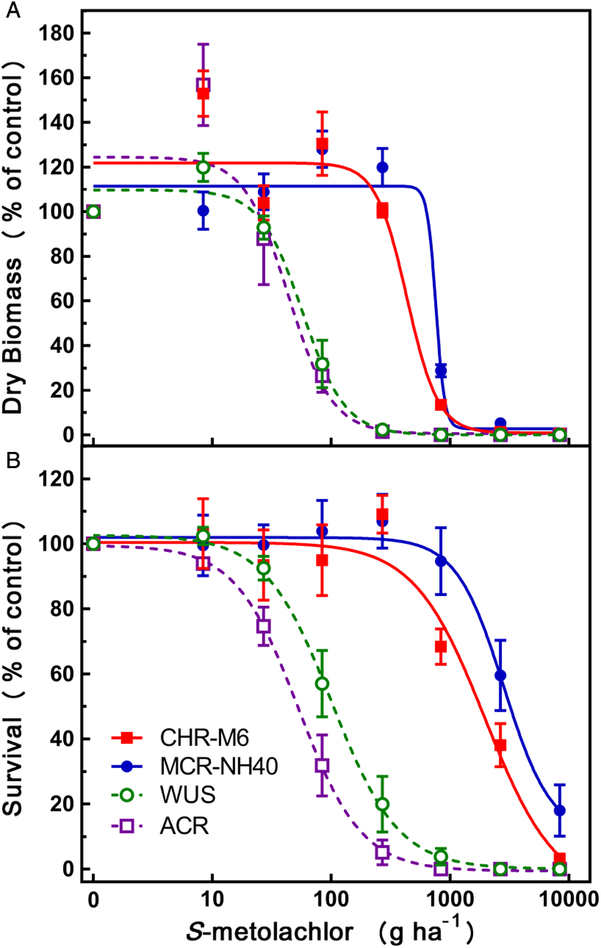
Figure 6. Herbicide dose–response experiments of four Amaranthus tuberculatus populations treated with soil-applied S-metolachlor. Data were collected at 21 DAT. (A) Dry biomass as a percentage of nontreated control, and (B) mean survival of A. tuberculatus seedlings as a percentage of nontreated control. Lines in each graph were fit using Equation 1:  $(y = c + {{d - c} \over {1 + {\rm{exp}}\left\{ {b\left[ {\log \left( x \right) - {\rm{log}}({\rm{L}}{{\rm{D}}_{50}}/{\rm{G}}{{\rm{R}}_{50}})} \right]} \right\}}})$, and each symbol represents the observed mean ±SE. CHR-M6, continuous line and full squares; MCR-NH40, continuous line and full circles; WUS, discontinuous line and open circles; ACR, discontinuous line and open squares.
Dose–response curves to S-metolachlor (Figure 6) and LD50 values (Table 6) indicate a positive shift in rate needed to control either HPPD inhibitor–resistant and atrazine-resistant population (CHR-M6 or MCR-NH40). Based on LD50 values, calculated resistant to sensitive (R:S) values for CHR-M6 and MCR-NH40 are 17.9 and 33.3, respectively, when compared with WUS, and 34.3 and 63.8 in comparison with ACR, respectively. Similar to LD50 values, GR50 values also demonstrated a positive shift in the rate needed to reduce aboveground biomass. R:S values for CHR-M6 and MCR-NH40 were 7.5 and 12.9, respectively, in comparison with WUS, and 9.9 and 17.1 when compared with ACR, respectively. The large difference in GR50 R:S values and those calculated from LD50 estimates can be attributed to the low overall biomass recovered from containers treated with higher herbicide rates.
Table 6. Pooled greenhouse dose–response data to assess differences among Amaranthus tuberculatus populations.a

a Estimated LD50 and GR50 values followed by their standard errors of the mean in parentheses.
Dose response to acetochlor
Complete mortality of both HPPD inhibitor–sensitive populations (ACR and WUS) was achieved at lower rates of acetochlor (≤80 g ha−1) compared with either CHR-M6 or MCR-NH40. Both CHR-M6 and MCR-NH40 were completely controlled at 800 g ha−1 (Figure 5). Similar to S-metolachlor, dose–response curves for acetochlor indicate a positive shift in rate needed to reduce the aboveground biomass and surviving seedlings from CHR-M6 and MCR-NH40 (Figure 7), but complete control was achieved at rates lower than applied in the field. R:S ratios were 4.5 and 5.7 for CHR-M6 and MCR-NH40, respectively, when compared with WUS, and 14.1 and 17.9 when compared with ACR, respectively, based on calculated LD50 values (Table 6). R:S ratios calculated from GR50 values were 6.1 and 6.7 for CHR-M6 and MCR-NH40, respectively, when compared with WUS, and 13.2 and 14.6 when compared with ACR, respectively.

Figure 7. Herbicide dose–response experiments of four Amaranthus tuberculatus populations treated with soil-applied acetochlor. Data were collected at 21 DAT. (A) Dry biomass as a percentage of nontreated control, and (B) mean survival of A. tuberculatus seedlings as a percentage of nontreated control. Lines in each graph were fit using Equation 1:  $(y = c + {{d - c} \over {1 + {\rm{exp}}\left\{ {b\left[ {\log \left( x \right) - {\rm{log}}({\rm{L}}{{\rm{D}}_{50}}/{\rm{G}}{{\rm{R}}_{50}})} \right]} \right\}}})$, and each symbol represents the observed mean ±SE. CHR-M6, continuous line and full squares; MCR-NH40, continuous line and full circles; WUS, discontinuous line and open circles; ACR, discontinuous line and open squares.
Dose response to dimethenamid-P
CHR-M6 and MCR-NH40 survived higher rates of dimethenamid-P (1.1 kg ha−1) compared with either ACR or WUS, for which complete mortality was achieved at or below 350 g ha−1 (Figures 8 and 9). Surviving MCR-NH40 or CHR-M6 plants in replicates treated with 1.1 or 3.5 kg ha−1 dimethenamid-P were severely stunted but still actively growing at 21 DAT, similar to S-metolachlor treatments. Dose–response curves (Figure 9) also indicate a positive shift in rate for CHR-M6 and MCR-NH40 needed to reduce aboveground biomass and surviving seedlings. R:S ratios were 21.1 and 42.2 for CHR-M6 and MCR-NH40, respectively, when compared with WUS, and 28 and 56.1 when compared with ACR, respectively, based on calculated LD50 values (Table 6). R:S ratios calculated from GR50 values were 5.5 and 8.7 for CHR-M6 and MCR-NH40, respectively, when compared with WUS, and 11.9 and 18.8 when compared with ACR, respectively.

Figure 8. Response of four Amaranthus tuberculatus populations at 14 DAT to (A) 24 g pyroxasulfone ha−1, (B) 240 g pyroxasulfone ha−1, (C) 110 g dimethenamid-P ha−1, and (D) 1,100 g dimethenamid-P ha−1. In each frame, outside columns are nontreated (signified by “U”), and treated containers are located in the center below the labeled rate. Populations (1, CHR-M6; 2, MCR-NH40; 3, WUS; 4, ACR) are displayed with nontreated nearest number and corresponding treatment directly adjacent. Herbicide treatments were applied directly to the soil PRE.

Figure 9. Herbicide dose–response experiments of four Amaranthus tuberculatus populations treated with soil-applied dimethenamid-P. Data were collected at 21 DAT. (A) Dry biomass as a percentage of nontreated control, and (B) mean survival of A. tuberculatus seedlings as a percentage of nontreated control. Lines in each graph were fit using Equation 1:  $(y = c + {{d - c} \over {1 + {\rm{exp}}\left\{ {b\left[ {\log \left( x \right) - {\rm{log}}({\rm{L}}{{\rm{D}}_{50}}/{\rm{G}}{{\rm{R}}_{50}})} \right]} \right\}}})$, and each symbol represents the observed mean ±SE. CHR-M6, continuous line and full squares; MCR-NH40, continuous line and full circles; WUS, discontinuous line and open circles; ACR, discontinuous line and open squares.
Dose response to pyroxasulfone
Complete control of either HPPD inhibitor–sensitive population (ACR or WUS) was achieved at or below 78 g ha−1 pyroxasulfone, whereas CHR-M6 and MCR-NH40 survived 240 and occasionally 780 g ha−1 (Figures 8 and 10). Survivors from replicates treated with high rates of pyroxasulfone (≥240 g ha−1) were severely stunted, similar to plants treated with high rates of S-metolachlor or dimethenamid-P. Dose–response curves (Figure 10) demonstrate that CHR-M6 and MCR-NH40 require higher rates to reduce aboveground biomass and seedling survival, similar to all previously mentioned active ingredients. R:S ratios were 6.5 and 15.4 for CHR-M6 and MCR-NH40, respectively, when compared with WUS, and 7.2 and 17 when compared with ACR, respectively, based on calculated LD50 values (Table 6). R:S ratios calculated from GR50 values were 2.9 and 4.9 for CHR-M6 and MCR-NH40, respectively, when compared with WUS, and 4.0 and 6.8 when compared with ACR, respectively. The R:S ratios from the present research are similar to previous reports on several MHR rigid ryegrass (Lolium rigidum Gaudin) populations, for which 8.1-fold (Brunton et al. Reference Brunton, Boutsalis, Gurjeet and Preston2018) and 3.6-fold (Busi et al. Reference Busi, Gaines and Powles2017) resistances to pyroxasulfone were documented based on LD50 values.

Figure 10. Herbicide dose–response experiments of four Amaranthus tuberculatus populations treated with soil-applied pyroxasulfone. Data were collected at 21 DAT. (A) Dry biomass as a percentage of nontreated control, and (B) mean survival of A. tuberculatus seedlings as a percentage of nontreated control. Lines in each graph were fit using Equation 1:  $(y = c + {{d - c} \over {1 + {\rm{exp}}\left\{ {b\left[ {\log \left( x \right) - {\rm{log}}({\rm{L}}{{\rm{D}}_{50}}/{\rm{G}}{{\rm{R}}_{50}})} \right]} \right\}}})$, and each symbol represents the observed mean ±SE. CHR-M6, continuous line and full squares; MCR-NH40, continuous line and full circles; WUS, discontinuous line and open circles; ACR, discontinuous line and open squares.
Summary and management implications
Overall, field results indicate a wide range of efficacy among the VLCFA inhibitors compared at the CHR site. Greenhouse experiments corroborated field results, demonstrating an increase in VLCFA-inhibitor rates required to reduce biomass and survival of either MHR population with resistances to atrazine and HPPD inhibitors (CHR-M6 and MCR-NH40). Conversely, ACR, which shares only atrazine resistance with CHR-M6 and MCR-NH40, was the most sensitive to all VLCFA-inhibiting herbicides tested.
Natural crop tolerance to chloroacetamide herbicides is achieved through rapid conjugation to glutathione in corn or homoglutathione in soybean (Breaux Reference Breaux1987; Fuerst Reference Fuerst1987). Higher levels of glutathione S-transferase (GST) activity typically occur in tolerant crop seedlings versus sensitive weed species when assaying with chloroacetamide herbicide substrates (Hatton et al. Reference Hatton, Dixon, Cole and Edwards1996). Plants from the MCR population contain the metabolic capacity necessary for oxidative metabolism of mesotrione as well as GST-mediated detoxification of atrazine (Ma et al. Reference Ma, Kaundun, Tranel, Riggins, McGinness, Hager, Hawkes, McIndoe and Riechers2013). It is reasonable to hypothesize that either or both of these metabolic mechanisms could confer cross-resistance to certain VLCFA inhibitors or, alternatively, that multiple metabolic resistance could occur via distinct enzymes for each herbicide chemistry. As mentioned previously, it is interesting that the ACR population (metabolic atrazine-resistant only) was the most sensitive to all VLCFA-inhibiting herbicides tested. However, additional mechanistic research is required to directly test these hypotheses.
A similar detoxification process for VLCFA-inhibiting herbicides may occur in CHR and MCR, but it is unclear why acetochlor is less affected than other VLCFA inhibitors. One possibility is that acetochlor might be less affected because GST- and cytochrome P450–mediated detoxification mechanisms in plants are complex and substrate specific (Edwards and Owen Reference Edwards and Owen1989; Riechers et al. Reference Riechers, Kreuz and Zhang2010; Werck-Reichhart et al. Reference Werck-Reichhart, Hehn and Didierjean2000). Also, VLCFA-inhibiting herbicides target the VLCFA elongase encoded by the FAE1 gene (Böger Reference Böger2003), and previous research demonstrated that VLCFA-inhibiting herbicides can inhibit more than one VLCFA-elongase enzyme in Arabidopsis thaliana, including At5g43760, At104220, At1g25450, KCS1, KCS2, and FAE1 (Trenkamp et al. Reference Trenkamp, Martin and Tietjen2004). Acetochlor may inhibit more of these condensing enzymes (or different enzymes) than other VLCFA-inhibiting active ingredients tested on CHR and thus remains more effective.
Overall, this initial report of a dicot species with resistance to VLCFA-inhibiting herbicides will undoubtedly be followed by other species and poses serious management implications. Early POST applications or tillage may be needed to compensate for the reduced duration of PRE activity, along with the best management practices of using multiple effective SOAs per season (Evans et al. Reference Evans, Tranel, Hager, Schutte, Wu, Chatham and Davis2016) and sequential applications of residual herbicides (Steckel et al. Reference Steckel, Sprague and Hager2002). Further research including herbicide degradation studies in plants, target-site sequence analysis, or genetics and inheritance studies are needed to determine the underlying physiological mechanism(s) for the resistance of CHR and MCR to VLCFA-inhibiting herbicides. Understanding how these “old chemistries” perform in today’s agronomic systems will be crucial for maintaining them as effective SOAs for residual control of small-seeded broadleaves in the future.
Author ORCIDs
Seth A. Strom https://orcid.org/0000-0003-1675-2875; Dean E. Riechers https://orcid.org/0000-0002-6081-5629
Acknowledgments
We thank Syngenta Crop Protection for financial support of this research, as well as the Kraft and Brockson Graduate Fellowships awarded to SAS from the Department of Crop Sciences at the University of Illinois. No conflicts of interest have been declared.


