


Introduction
The northern frontier of the North American soybean [Glycine max (L.) Merr.]-growing region is located in western Canada between 49°N and 51°N in areas where the average frost-free period ranges between 110 and 130 d (Nadler Reference Nadler2007; Soy Canada 2018). The development of soybean varieties with reduced time to maturity has facilitated soybean production in shorter-season growing environments like western Canada. In the last decade, seeded hectarage of soybean in Manitoba, Canada, has grown 10-fold, making soybean the third most grown crop by hectarage following canola (Brassica napus L.) and wheat (Triticum aestivum L.) (Statistics Canada 2017). In Canada, transgenic glyphosate- or glufosinate-resistant or non-transgenic imidazolinone-resistant canola varieties currently are available for commercial production. Volunteer B. napus, originating from large canola seed losses at harvest (Cavalieri et al. Reference Cavalieri, Harker, Hall and Gulden2016), survives in a persistent seedbank (Gulden et al. Reference Gulden, Shirtliffe and Thomas2003) which can span short crop rotations. The most common crop rotation implemented in western Canada spans 2 yr and consists of canola and wheat (Beckie and Harker Reference Beckie and Harker2017). As a result, volunteer B. napus is the fourth most abundant weed species among western Canadian field crops following POST weed management (Leeson et al. Reference Leeson, Gaultier, Hall and Neeser2017b). The same genetically engineered herbicide-resistant (HR) traits in soybean and canola make POST herbicide management of volunteer B. napus particularly difficult in soybean. Adventitious presence of unsolicited HR traits in pedigreed canola seed lots (Friesen et al. Reference Friesen, Nelson and Van Acker2003), or pollen-mediated gene flow in canola resulting in multiple-HR gene stacking (Hall et al. Reference Hall, Topinka, Huffman, Davis and Good2000) are contributing to glyphosate-resistant volunteers in soybean fields, even where growers choose diligently to diversify HR traits among successive crops.
Integrated weed management (IWM) is a fundamental component of managing HR weeds. Limiting the number of weed seeds that enter the soil seedbank can reduce the source of weed seedling recruitment in subsequent years (Norsworthy et al. Reference Norsworthy, Ward, Shaw, Llewellyn, Nichols, Webster, Bradley, Frisvold, Powles, Burgos, Witt and Barrett2012). Canola harvest losses can be reduced by using agronomic techniques to promote synchronous maturation of the canola crop, reducing combine speed (Cavalieri et al. Reference Cavalieri, Harker, Hall and Gulden2016), using a direct harvest method (Haile et al. Reference Haile, Holzapfel and Shirtliffe2014), and growing canola varieties with reduced predisposition to pod shatter (Cavalieri et al. Reference Cavalieri, Lewis and Gulden2014). Yet seed losses during canola harvest in western Canada remain high (averaging about 4,300 seeds m−2) (Cavalieri et al. Reference Cavalieri, Harker, Hall and Gulden2016). This results in the persistence of volunteer B. napus populations throughout 3-yr crop rotations despite seedbank decline rates of roughly 90% per year (Gulden et al. Reference Gulden, Shirtliffe and Thomas2003). Persistence of volunteer B. napus in the seedbank also can be reduced by timely soil disturbance postharvest (Geddes and Gulden Reference Geddes and Gulden2017). However, even low densities of volunteer B. napus in soybean can cause significant yield loss and large seedbank contributions (Gregoire Reference Gregoire2017).
Following recruitment in May or June, volunteer B. napus grows rapidly and interferes with neighboring plants, resulting in crop yield loss (Gregoire Reference Gregoire2017; Seerey and Shirtliffe Reference Seerey and Shirtliffe2010). Canola plants exhibit high phenotypic plasticity (Gregoire Reference Gregoire2017), efficient resource uptake (Blackshaw et al. Reference Blackshaw, Brandt, Janzen, Entz, Grant and Derksen2003) and can adapt rapidly to their immediate environment. Interference from volunteer B. napus can reduce height and branching of soybean and contribute to greater than 5% yield loss at densities as low as 3 plants m−2 (Gregoire Reference Gregoire2017). In western Canada, the mean density of occurrence of volunteer B. napus midseason is 7 plants m−2 when averaged among field crops (Leeson et al. Reference Leeson, Gaultier, Hall and Neeser2017b).
Several studies have examined cultural, chemical, or physical tools for weed management in soybean; however, to date, no research has been conducted on candidate tools for the development of an IWM strategy for volunteer B. napus in soybean. In western Canada, IWM research in soybean is in its infancy, because widespread production of this crop was established only recently (Statistics Canada 2017). Northern soybean-growing regions in western Canada are dominated by cool-season C3 weed species (Leeson et al. Reference Leeson, Gaultier, Hall and Neeser2017b), such as volunteer B. napus. The effectiveness of management tools on cool-season weed species in soybean grown in a cool climate may differ from that observed in other regions.
Before glyphosate-resistant soybean, physical weed control was a primary method for late-season weed management in wide-row soybean (Harder et al. Reference Harder, Sprague and Renner2007). Since then, the ease of glyphosate use for broad-spectrum POST weed management in glyphosate-resistant soybean has led to widespread abandonment of interrow tillage as a management tool (Harder et al. Reference Harder, Sprague and Renner2007; Reddy Reference Reddy2001). Interrow tillage, however, may be an effective tool for management of glyphosate-resistant weeds such as volunteer B. napus.
Optimal soybean spatial arrangement, achieved using narrow-row spacing and/or adequate population densities, can increase the competitive ability of soybean with weeds that escape herbicide management. More uniform spatial arrangement in soybean contributes to decreased intraspecific competition, improved resource capture, rapid canopy closure (Légère and Schreiber Reference Légère and Schreiber1989; Willcott et al. Reference Willcott, Herbert and Zhi-Yi1984), more complete light interception throughout the growing season (Dalley et al. Reference Dalley, Kells and Renner2004; Taylor et al. Reference Taylor, Mason, Bennie and Rowse1982), reduced photosynthetic photon flux density beneath the soybean canopy (Green-Tracewicz et al. Reference Green-Tracewicz, Page and Swanton2012), and greater soybean interference with weeds (Yelverton and Coble Reference Yelverton and Coble1991). As a result, reduced soybean row spacing and/or increased seeding densities can reduce weed population densities (Nice et al. Reference Nice, Buehring and Shaw2001), late-season weed recruitment (Harder et al. Reference Harder, Sprague and Renner2007), biomass accumulation (Arce et al. Reference Arce, Pedersen and Hartzler2009; Rich and Renner Reference Rich and Renner2007), seed production (Butts et al. Reference Butts, Norsworthy, Kruger, Sandell, Young, Steckel, Loux, Bradley, Conley, Stoltenberg, Arriaga and Davis2016; Nice et al. Reference Nice, Buehring and Shaw2001), and seedbank inputs (Chandler et al. Reference Chandler, Shrestha and Swanton2001). For example, greater population densities of soybean (~676,000 plants ha−1) combined with narrow-row spacing (19 cm) reduced sicklepod [Senna obtusifolia (L.) H. S. Irwin & Barneby] population densities by up to 80% compared with low soybean densities (~245,000 plants ha−1) in wide rows (76 cm) (Nice et al. Reference Nice, Buehring and Shaw2001).
The response of plants to soil nutrient supply is species dependent (Blackshaw et al. Reference Blackshaw, Brandt, Janzen, Entz, Grant and Derksen2003), and fertilization management can be used to shift the competitive balance between crop and weed species in an IWM program (Di Tomaso Reference Di Tomaso1995). Soybean can acquire between 50% and 85% of its total nitrogen requirements from symbiotic nitrogen fixation (Rao and Reddy Reference Rao and Reddy2010; Salvagiotti et al. Reference Salvagiotti, Cassman, Specht, Walters, Weiss and Dobermann2008). Soybean response to nitrogen fertilization is often minimal (Salvagiotti et al. Reference Salvagiotti, Cassman, Specht, Walters, Weiss and Dobermann2008). In cooler-season production systems (about 44°N), however, seed-placed starter nitrogen fertilizer can facilitate early soybean establishment, resulting in about 6% greater soybean yield on average (Osborne and Riedell Reference Osborne and Riedell2006). Canola is highly responsive to inorganic nitrogen supply (Blackshaw et al. Reference Blackshaw, Brandt, Janzen, Entz, Grant and Derksen2003; Taylor et al. Reference Taylor, Smith and Wilson1991). In response to greater nitrogen, canola exhibits increased shoot and root biomass, leaf area index, branches per plant, fecundity, seed weight, and seed production. Planting soybean in fields with greater supply of inorganic nitrogen could increase interference from volunteer B. napus, resulting in greater yield loss.
The production of early-maturing soybean varieties in northern growing regions has resulted in more rapid growth and development of soybean compared with later-maturing varieties grown in southern regions. Likewise, many of the competitive short-season weed species present in northern growing regions (above about 49°N) are of limited presence in areas where weed management in soybean has been studied previously. Volunteer B. napus can evade herbicide management in soybean, making it the most abundant weed in soybean fields in western Canada (Gregoire Reference Gregoire2017; Leeson et al. Reference Leeson, Gaultier and Grenkow2017a). This study was designed to evaluate the effects of soybean row spacing, seeding density, nitrogen supply, and interrow tillage on volunteer B. napus interference in soybean and to compare the effectiveness of these tools on a competitive short-season weed that is well adapted to northern production systems. We compared the efficacy of these tools for weed management to determine which combination of tools would be most effective in an IWM program for volunteer B. napus in soybean. It was hypothesized that interrow tillage in wide-row soybean or reduced soybean row spacing and increased seeding densities would decrease interference of volunteer B. napus with soybean and reduce volunteer B. napus seed production. Nitrogen fertilization, simulating an environment with greater inorganic nitrogen supply, was expected to cause greater interference of volunteer B. napus with soybean and reduced soybean yield.
Materials and Methods
Field Experiment
Experimental Sites
Field experiments were established on cultivated wheat stubble at four sites in Manitoba, Canada. To prevent glyphosate-resistant B. napus volunteers from the ambient seedbank, sites with a history of glufosinate-resistant (glyphosate-susceptible) canola production were chosen. In 2013, one site was established at the Ian N. Morrison Research Station near Carman, MB (49.49°N, 98.04°W). In 2014, sites were established at the Ian N. Morrison Research Station near Carman, MB, the Richardson Kelburn Farm near Howden, MB (49.69°N, 97.12°W), and the Westman Agricultural Diversification Organization near Melita, MB (49.25°N, 101.02°W). Soil characteristics for each site can be found in Table 1.
Table 1 Soil characteristics and nutrient status in spring before seeding soybean at each site.

a Abbreviations: K, potassium; N, nitrate nitrogen; P, Olsen phosphorus; S, sulfate sulfur.
b Abbreviations: DHO, Deadhorse series; NWS, Newstead series; RGD, Rignold series; SOR, St Norbert series.
c Abbreviations: C, clay; CL, clay loam; L, loam; SCL, sandy clay loam.
d Indicates a different sample depth range than the other sites.
Experimental Design and Treatment Structure
A randomized complete block design with four replications (blocks) per site was used to study the nonchemical weed management treatments. The six treatments included soybean grown using (1) narrow-row spacing (19 cm) (NR), (2) narrow-row spacing with a high seeding density (1.5× recommended) (NR HD), (3) medium-row spacing (38 cm) (MR), (4) wide-row spacing (76 cm) (WR), (5) wide-row spacing with nitrogen fertilization (23 kg N ha−1, preseed broadcast urea) (WR NF), or (6) wide-row spacing with interrow tillage (two passes using a C-shank cultivator set for 5-cm depth at soybean stage BBCH 13 to 14 [Munger et al. Reference Munger, Bleiholder, Hack, Hess, Stauss, van den Boom and Weber1997]) (WR IRT) (Table 2). Each treatment was evaluated using a 2.5 by 4 m plot.
Table 2 Nonchemical weed management treatment descriptions and preformulated estimated differences between individual treatment means.Footnote a

a Abbreviations: HD, high seeding density (1.5 times recommended); IRT, interrow tillage; MR, medium-row (19 cm); NF, nitrogen fertilization (+23 kg N ha−1, urea); NR, narrow-row (19 cm); RS, row spacing; SD, seeding density; WR, wide-row (76 cm).
b A dash (—) indicates lack of additional management.
Before soybean was seeded, glyphosate-resistant volunteer B. napus ‘DKL 73-45 RR’ (F1 generation hybrid treated with Acceleron® containing: difenoconaxole, metalaxyl, fludioxonil, and thiamethoxam; Monsanto Canada, Winnipeg, MB, CA) was seeded along each experimental block at 1 cm depth and at a density of 80 seeds m−2 (19 cm row spacing). All soybean ‘DKL 23-10 RY’ (treated with Acceleron® containing: fluxapyroxad, pyraclostrobin, metalaxyl, imidacloprid; Monsanto Canada, Winnipeg, MB, CA) treatments were seeded perpendicular to volunteer B. napus rows using double disk openers at a depth of 2 cm. A soybean-seeding density of 455,000 seeds ha−1 (about 420,000 target plants ha−1) was used for all treatments except for the increased seeding density treatment. This seeding density was chosen because it spanned recommendations for soybean rows spaced 19 to 76 cm apart (Monsanto Canada, Winnipeg, MB, CA). The increased seeding density treatment was seeded at 682,500 seeds ha−1 (about 630,000 target plants ha−1), 1.5 times the seeding density of all other treatments. TagTeam® MultiAction® granular soybean inoculant (minimum of 1 × 10⁵ cfu Penicillium bilaii g−1 and 1 × 10⁸ viable Bradyrhizobium japonicum cells g−1; Monsanto BioAg and Design™, Monsanto, St Louis, MO, USA) was added in the soybean row (6.5, 4.0, and 1.6 kg ha−1 in 19-, 38-, and 76 cm row spacing, respectively). Glyphosate (Roundup WeatherMax®, 360 g ae ha−1; Monsanto Canada, Winnipeg, MB, CA) was applied at soybean stage BBCH 13 using AIXR 110015 TeeJet® nozzles (TeeJet Technologies, Wheaton, IL, USA) at 275 kPa and with a 100 L ha−1 water carrier.
Data Collection
Soybean seedling emergence was determined at stage BBCH 10 to 12 by counting the number of seedlings in 1 m of two adjacent soybean rows in each experimental unit. Volunteer B. napus seedling recruitment was determined at stage BBCH 12 to 13 by counting the number of seedlings in two randomly placed 50 by 50 cm quadrats oriented along the edge of a soybean row. The height of three randomly selected plants of volunteer B. napus and soybean was determined at 15, 30, 45, and 60 d after soybean emergence (DAE). Plant height was measured from the soil surface to the distal end of the fully extended shoot. At volunteer B. napus stage BBCH 82, aboveground biomass of volunteer B. napus and soybean (BBCH 77) was collected from one 50 by 50 cm quadrat placed along the edge of a soybean row. Collected plants were separated by species, and volunteer B. napus plants were counted to determine late-season plant densities. Late-season volunteer B. napus plant density was used to determine plant survival to maturity as a proportion of seedling recruitment. Following species separation, aboveground plant biomass was dried at 60 C until equilibrium, and dry weight was recorded for each species. Dry volunteer B. napus biomass samples were hand threshed and cleaned using a hand sieve (2.7 mm round hole, Can-Seed Equipment, Winnipeg, MB, CA) and a column seed cleaner (model CB-1, Agriculex, Guelph, ON, CA). The clean volunteer B. napus seed was weighed, and individual seed weight (g 1,000 seeds−1) was determined. Then total volunteer B. napus seed production per unit area (no. seeds m−2) was determined from the total weight of seed per unit area (g m−2) and individual seed weight. Volunteer B. napus plant fecundity (no. seeds plant−1) was determined using seed production per unit area (no. seeds m−2) and late-season plant densities (no. plants m−2) collected from the same biomass sample area.
At soybean maturity, the plots were harvested using a Kincaid 8-XP single-plot combine (concave clearance 18 mm, cylinder speed 625 rpm, fan speed 900 rpm, sieve 18 mm; Kincaid Equipment Manufacturing, St Haven, KS, USA). Yield samples were cleaned using a Clipper M2BC seed cleaner (Blount/Ferrell-Ross, Bluffton, IN, USA) and separated by species (soybean and volunteer B. napus) using a hand sieve (2.7 mm round hole, Can-Seed Equipment, Winnipeg, MB, CA). Cleaned and separated soybean and volunteer B. napus seeds were weighed and adjusted to 13.0% and 8.5% moisture, respectively. The total number of volunteer B. napus seeds collected with soybean at harvest (i.e., dockage) was expressed as the number of seeds per square meter (no. seeds m−2) using total seed weight per unit area (g m−2) and individual seed weight (g 1,000 seeds−1). Then, volunteer B. napus seed rain was determined using Equation 1 and expressed as a percentage of the total number of seeds produced.
 $$ \eqalignno { {\rm Volunteer}\, B. \, napus \, {\rm seed}\,{\rm rain } \ \left( {\rm \,\%\,} \right) \, {\equals} \cr { \left[ {\left( {({\rm no}.{\rm \,seeds \,m}^{{{\minus}2}} \,{\rm at}\,{\rm biomass}){\minus}({\rm no}.{\rm \,seeds\,m}^{{{\minus}2}} \,{\rm in}\,{\rm dockage})} \right)\, \over \,({\rm no}.{\rm\,seeds\, m}^{{{\minus}2}} \,{\rm at}\,{\rm biomass})} \right] {\times}100 } \cr $$
Statistical Analysis
The MIXED procedure (Littell et al. Reference Littell, Milken, Stroup, Wolfinger and Schabenberger2006) in SAS v. 9.4 (SAS Institute, Cary, NC, USA) was used for analysis of variance of all response variables. The soybean response variables included yield, aboveground biomass, plant height, and seedling emergence. The volunteer B. napus response variables included seed production per unit area, seed rain, plant fecundity, individual mature seed weight, aboveground biomass, plant height, seedling recruitment, and plant survival to maturity. The Shapiro-Wilk test was used to assess the assumption of normality, while visual inspection of residual versus predicted values was used to assess homogeneity of variance (Littell et al. Reference Littell, Milken, Stroup, Wolfinger and Schabenberger2006). Lund’s test (Lund Reference Lund1975) was used to remove extreme outliers, and the square root-transformation was used when necessary to meet the assumptions of normality and/or homoscedasticity (Littell et al. Reference Littell, Milken, Stroup, Wolfinger and Schabenberger2006).
In all analyses, excluding plant height, weed management treatment, experimental site, and their interaction were considered fixed effects, while experimental block nested within site was considered a random effect. The covariance structure of residuals was fit by selecting the R-matrix repeated group effect based on minimization of Akaike’s information criterion (AIC) to adjust the model for homoscedasticity (Littell et al. Reference Littell, Milken, Stroup, Wolfinger and Schabenberger2006). Plant height data were analyzed within site using a repeated-measures model (Littell et al. Reference Littell, Milken, Stroup, Wolfinger and Schabenberger2006). For the analysis of plant height, the main and interaction effects of weed management treatment, measurement date, and response species (soybean or volunteer B. napus) were considered fixed effects, while experimental block was considered a random effect. Volunteer B. napus and soybean (response species) were included as a factor in the analysis of plant height to estimate shade-avoidance response to interference in each species at each sampling date. Measurements of the individual experimental units were repeated in time, and a Toeplitz covariance structure was fit based on minimization of AIC (Littell et al. Reference Littell, Milken, Stroup, Wolfinger and Schabenberger2006).
To address each specific hypothesis, single degree of freedom estimated mean differences (Table 2) were designed to test for lack of difference among treatment means (Littell et al. Reference Littell, Milken, Stroup, Wolfinger and Schabenberger2006). The simulation-based procedure was used to control family-wise type 1 errors (α=0.05), which can be inflated when testing multiple hypotheses (Schaarschmidt and Vaas Reference Schaarschmidt and Vaas2009).
Results and Discussion
The initial combined analysis revealed two distinct categories of volunteer B. napus seedling recruitment among the four sites. Volunteer B. napus recruitment at Carman 2013 and Melita 2014 (39 and 38 plants m−2, respectively) was about half of that attained at Howden 2014 and Carman 2014 (80 and 99 plants m−2, respectively) (Table 3). At Carman 2014, greater volunteer B. napus recruitment than the density of volunteer B. napus seeded could have been due to the additional recruitment of volunteers from previous glufosinate-resistant volunteer B. napus crops. Carman 2014 also resulted in the lowest survival of volunteer B. napus plants (about 46% survival), which suggested that a portion of the recruited volunteer B. napus seedlings at Carman 2014 may have been susceptible to glyphosate. Despite lower volunteer B. napus survival at Carman 2014, the plant density of volunteer B. napus following glyphosate application was greater at Carman 2014 and Howden 2014 than at Carman 2013 and Melita 2014. This affected the efficacy of the management tools, where the magnitude of effects of weed management treatments on soybean and volunteer B. napus response variables were greater at the sites with higher volunteer B. napus densities. For this reason, all subsequent analyses were conducted by separating the sites into two groups with either lower (Carman 2013 and Melita 2014) or higher (Carman 2014 and Howden 2014) volunteer B. napus densities (Table 3).
Table 3 The main effect of experimental site on soybean and volunteer Brassica napus response variables separated by the sites with lower (Carman 2013 and Melita 2014) and higher (Carman 2014 and Howden 2014) volunteer Brassica napus densities.Footnote a

a Values are means.
b Indicates significant site by treatment interaction at sites with higher volunteer B. napus densities.
c Values followed by parenthetical values are back-transformed means with square root–transformed means in parentheses.
d Within volunteer B. napus density site classes, differences between sites at P<0.05, 0.01, and 0.001 are indicated by *, **, and ***, respectively. NS indicates lack of a significant difference (P≥0.05).
Crop Spatial Arrangement
Grain Yield
Manipulating soybean row spacing and seeding density to optimize soybean spatial arrangement increased crop tolerance to weed interference (Table 4) but did not affect total seed production, individual seed weight, biomass accumulation, seedling recruitment, and plant survival of volunteer B. napus (Tables 5 and 6). Integrating a high soybean-seeding density (648,500 seeds ha−1) with narrow-row spacing (19 cm) resulted in greater soybean yield (by 65% at the sites with higher volunteer B. napus densities) under volunteer B. napus interference compared with recommended seeding densities (455,000 seeds ha−1) at wide-row spacing (76 cm) (Table 4). This increase in soybean yield was driven primarily by the increased soybean-seeding density rather than the reduction in row spacing. In narrow rows, the increased soybean-seeding density resulted in 44% greater soybean yield (at the sites with higher volunteer B. napus densities) compared with the recommended seeding density. Manipulation of soybean row spacing alone did not influence soybean yield under volunteer B. napus interference. Similar trends in soybean yield were observed at the sites with lower volunteer B. napus densities; however, these effects were not significant (P-values≥0.366). The positive relationship between seeding density and crop competitiveness under weed interference is well documented in soybean (Arce et al. Reference Arce, Pedersen and Hartzler2009; Harder et al. Reference Harder, Sprague and Renner2007) and other crops like barley (Hordeum vulgare L.), wheat, and canola (O’Donovan et al. Reference O’Donovan, Blackshaw, Harker, Clayton, Moyer, Dosdall, Maurice and Turkington2007). At lower latitudes (42°N to 43°N), soybean tends to yield the greatest under weed interference when seeded at densities between about 300,000 and 550,000 seeds ha−1 (Arce et al. Reference Arce, Pedersen and Hartzler2009; Rich and Renner Reference Rich and Renner2007). In the presence of weeds, a significant yield benefit from increased soybean-seeding density is present most often in years with sufficient resource availability and when implemented in conjunction with narrow-row spacing (Harder et al. Reference Harder, Sprague and Renner2007).
Table 4 The effects of soybean row spacing, seeding density, nitrogen fertilization, and interrow tillage on soybean response variables under volunteer Brassica napus interference in combined analyses of the sites with higher (Carman 2014 and Howden 2014) or lower (Carman 2013 and Melita 2014) volunteer Brassica napus densities.Footnote a

a Abbreviations: HD, high seeding density (1.5 times recommended); IRT, interrow tillage; MR, medium-row (38 cm); NF, nitrogen fertilization (+23 kg N ha−1, urea); NR, narrow-row (19 cm); WR, wide-row (76 cm).
b Values are means.
c Indicates treatment main effect when a treatment by site interaction was present.
d Values are estimated differences between individual treatment means.
e Significant estimated differences between means at P<0.05, P<0.01, and P<0.001 are indicated by *, ** and ***, respectively.
Table 5 The effects of soybean row spacing, seeding density, nitrogen fertilization, and interrow tillage on volunteer Brassica napus response variables in a combined analysis of the sites with higher volunteer Brassica napus densities (Carman 2014 and Howden 2014).Footnote a

a Abbreviations: HD, high seeding density (1.5 times recommended); IRT, interrow tillage; MR; medium-row (38 cm); NF, nitrogen fertilization (+23 kg N ha−1, urea); NR, narrow-row (19 cm); WR, wide-row (76 cm).
b Values are means.
c Values followed by parenthetical values are back-transformed means with square root–transformed means in parentheses.
d Values are estimated differences between individual treatment means.
e Significant estimated differences between means at P<0.05 and P<0.001 are indicated by * and ***, respectively.
Table 6 The effects of soybean row spacing, seeding density, nitrogen fertilization, and interrow tillage on volunteer Brassica napus response variables in a combined analysis of the sites with lower volunteer Brassica napus densities (Carman 2013 and Melita 2014).Footnote a

a Abbreviations: HD, high seeding density (1.5 times recommended); IRT, interrow tillage; MR; medium-row (38 cm); NF, nitrogen fertilization (+23 kg N ha−1, urea); NR, narrow-row (19 cm); WR, wide-row (76 cm).
b Values are means.
c Values followed by parenthetical values are back-transformed means with square root–transformed means in parentheses.
d Values are estimated differences between individual treatment means.
e A significant estimated difference between means at P<0.05 is indicated by *.
Greater soybean yield under weed interference as a result of increased soybean-seeding density was likely due to enhanced resource capture (De Bruin and Pedersen Reference De Bruin and Pedersen2009) at the population level. In the present study, the effect of increased seeding density was studied in the narrow-row production system only, where more uniform plant spacing limited potential intraspecific interference in soybean. At the wider-row spacing, we may not have seen the same direct response of soybean yield to seeding density. The observed 44% increase in yield with a 50% increase in seeding density shows the importance of early space capture by soybean when volunteer B. napus is present at higher densities (Table 4). A similar trend was observed at the sites with lower volunteer B. napus densities; however, greater soybean plant densities did not manifest as greater soybean yield.
High seed costs have spurred interest in the reduction of soybean-seeding density recommendations as a possible strategy to reduce crop-input costs and increase net profit margins (Kratochvil et al. Reference Kratochvil, Pearce and Harrison2004; Norsworthy and Frederick Reference Norsworthy and Frederick2002). Recent research under weed-free conditions in the northern Great Plains region reported economic optimum soybean-seeding densities of 492,000 and 314,000 seeds ha−1 for early/mid (May 4 to 26) and late/very late (June 2 to 23) planting date groups, respectively (Tkachuk Reference Tkachuk2017). A rudimentary partial budgeting analysis using the same seed cost ($0.36 CAD thousand seeds−1) and grain prices ($0.37 CAD kg seed−1) as in Tkachuck (2017), indicated that the increased seeding density used in the present study resulted in greater net profit totaling $4 CAD ha−1 at sites with lower volunteer B. napus densities and $96 CAD ha−1 at sites with higher volunteer B. napus densities. Given the prevalence of volunteer B. napus in this region, these results suggest that soybean production in western Canada may be more profitable at soybean densities greater than current recommendations (about 395,000 plants ha−1).
Soybean yield and all volunteer B. napus response variables did not respond to changes in soybean row spacing when seeding density remained constant (Tables 4–6). Perhaps rapid growth of volunteer B. napus during the early part of the growing season negated any potential benefit of more rapid canopy closure in soybean using narrow-row spacing (Willcott et al. Reference Willcott, Herbert and Zhi-Yi1984). The difference in cool-season volunteer B. napus and warm-season soybean developmental patterns resulted in rapid growth and development of volunteer B. napus relative to soybean (Figure 1). Volunteer B. napus plants surpassed soybean in height shortly after 15 DAE and were taller than soybean before soybean canopy closure. This likely decreased the impact that shading would have had on soybean interference with volunteer B. napus. Research conducted at lower latitudes (41°N to 42°N) indicated that a reduction in soybean row spacing can increase early-season crop tolerance to weed interference, causing a shift in the critical time of weed removal to later stages of soybean growth and development (Knezevic et al. Reference Knezevic, Evans and Mainz2003). However, results from the present study indicate that that the effects of row spacing on early-season crop tolerance to weed interference in northern soybean production regions may be less effective in the presence of cool-season weed species that are competitive early in the growing season.
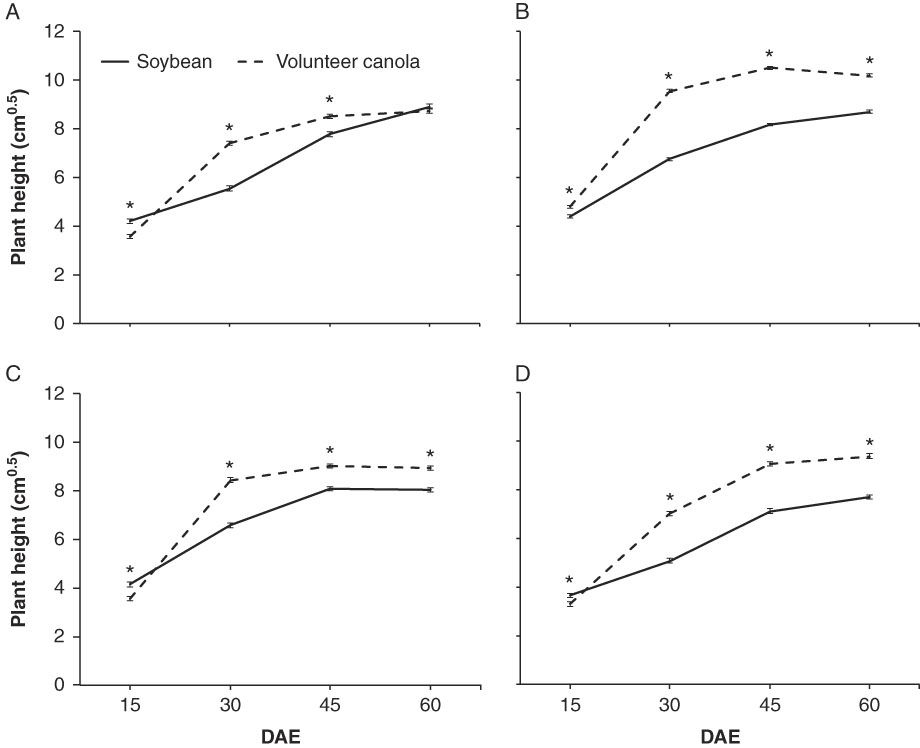
Figure 1 Mean plant heights of soybean or volunteer volunteer B. napus at 15, 30, 45, and 60 d after soybean emergence (DAE) at the (A) Carman 2013, (B) Carman 2014, (C) Melita 2014, and (D) Howden 2014 sites. Data points indicate response species means at each measurement date in each site in a combined analysis among management treatments. Error bars indicate ±SE. An asterisk (*) indicates a significant difference between species within site and measurement date using simulation-based multiple comparisons (α=0.05).
Crop Biomass
The integration of high soybean-seeding densities with narrow-row spacing resulted in 81% and 60% greater soybean biomass at the sites with higher and lower densities of volunteer B. napus, respectively, compared with recommended seeding densities using wide-row spacing (Table 4). In contrast with soybean yield, however, these increases in soybean biomass were driven primarily by the reduction in soybean row spacing, rather than increased soybean density. Inconsistent results in the literature have indicated that biomass of soybean can be either a good indicator (Carkner and Entz Reference Carkner and Entz2017; Egli Reference Egli2010) or a poor indicator (Taylor et al. Reference Taylor, Mason, Bennie and Rowse1982) of soybean yield. Under weed-free conditions, a decrease in soybean row spacing from 76 to 19 cm resulted in increased soybean biomass, leaf area index, number of pods per unit area, and yield by 20%, 15%, 16%, and 18%, respectively (Cox and Cherney Reference Cox and Cherney2011). In the present study, greater soybean biomass observed in narrow- and medium- compared with wide-row spacing likely was due to more uniform spatial arrangement, leading to increased resource capture (Dalley et al. Reference Dalley, Kells and Renner2004; Willcott et al. Reference Willcott, Herbert and Zhi-Yi1984) and reduced intraspecific competition (Duncan Reference Duncan1986).
Weed Growth and Development
When implemented alone, reduced soybean row spacing or increased soybean density did not affect volunteer B. napus growth and development (Tables 5 and 6). In combination, however, these weed management tools halved volunteer B. napus plant fecundity at the sites with lower volunteer B. napus recruitment but did not impact seed production per unit area compared with wide-row soybean at the recommended seeding density (Table 6). In previous studies, more optimal soybean spatial arrangement using narrow-row spacing (19 cm) and/or high soybean densities reduced seed production of single weed species like S. obtusifolia (Nice et al. Reference Nice, Buehring and Shaw2001) and whole weed communities composed predominantly of common lambsquarters (Chenopodium album L.) and witchgrass (Panicum capillare L.) by about half (Chandler et al. Reference Chandler, Shrestha and Swanton2001). In the present study, optimization of soybean spatial arrangement using narrow-row spacing with a high seeding density also increased seed rain of volunteer B. napus from 50% to 71% of the total number of seeds produced (at sites with higher volunteer B. napus densities) (Table 5). The reason for greater seed rain is unknown, but may have been due to the volume of plant biomass that needed to be processed by the combine at harvest, which could have facilitated increased travel of volunteer B. napus seed through and out the back of the machine.
Interrow Tillage
Interrow tillage in wide-row soybean resulted in 36% greater soybean yield and 55% greater soybean biomass at the sites with higher volunteer B. napus densities compared with the absence of interrow tillage in the same production system (Table 4). A similar response of soybean yield and biomass to interrow tillage was observed at the sites with lower volunteer B. napus densities; however, these differences were not significant (P-values=0.608 and 0.450, respectively) (Table 4). At the sites with higher volunteer B. napus densities, interrow tillage removed half of the volunteer B. napus plants (Table 5), which contributed to greater soybean yield and biomass. A similar trend was observed at the sites with lower volunteer B. napus densities (Table 6). Reduced efficacy of interrow tillage on volunteer B. napus at sites with lower volunteer B. napus densities explained the lack of difference in soybean yield and biomass between wide-row soybean with and without interrow tillage (Table 4).
Tillage between 76 cm soybean rows resulted in increased individual seed weight of volunteer B. napus by 8% and 11% at sites with higher and lower volunteer B. napus densities, respectively, compared with the absence of interrow tillage (Tables 5 and 6). A reduction in volunteer B. napus densities following interrow tillage likely altered the niche space and supply of resources for the remaining volunteer B. napus plants, resulting in greater individual seed weight (Taylor et al. Reference Taylor, Smith and Wilson1991).
Nitrogen Fertilization
Using a preseed nitrogen fertilization to simulate an environment with greater inorganic nitrogen supply resulted in greater volunteer B. napus seed production, biomass accumulation, and seed rain at the sites with higher volunteer B. napus densities (Table 5). At these sites, application of nitrogen fertilizer increased absolute volunteer B. napus seed production from about 37,000 to 65,500 seeds m−2. A 69% increase in volunteer B. napus biomass and about double the seed rain of volunteer B. napus also was observed in the nitrogen fertilization treatment compared with the unfertilized control (Table 5). Canola is highly responsive to inorganic nitrogen fertilization but may be relatively inefficient at taking up nitrogen at lower soil nitrogen concentrations (Blackshaw et al. Reference Blackshaw, Brandt, Janzen, Entz, Grant and Derksen2003).
The application of nitrogen fertilizer did not affect any soybean response variables compared with the unfertilized control (Table 4). This likely was due to the broadcast method of nitrogen application, which could have favored the shallow-seeded volunteer B. napus. In organic production systems, Carkner and Entz (Reference Carkner and Entz2017) reported that the level of residual soil inorganic nitrogen (ranging from 47 to 109 kg N ha−1 in the top 60 cm of soil) in 10 field experiments was associated negatively with soybean yield. This may have been due to increased weed interference at sites with greater levels of soil inorganic nitrogen. In the present study, the 23 kg N ha−1 fertilization was not great enough to result in a soybean yield difference (Table 4). Increased volunteer B. napus seed production but not soybean yield following nitrogen fertilization suggested that growing soybean under lower inorganic nitrogen conditions could increase the ability for soybean to compete with weed species not capable of symbiotic nitrogen fixation.
Soil tests before study establishment showed low levels of nitrate nitrogen in the soil profile at each site (Table 1). These levels of nitrate nitrogen were representative of the lower range of residual soil nitrogen commonly observed in fields under annual crop production in western Canada (AGVISE Laboratories 2016). In the present study, the residual levels of soil inorganic nitrogen were similar among sites, and it is unlikely that the residual levels of soil nitrogen confounded the results among these sites.
Experimental Site
Grouping the sites based on the density of volunteer B. napus seedlings present revealed that volunteer B. napus was less responsive to the weed management tools at the sites with lower volunteer B. napus densities (Tables 5 and 6). At these sites, the levels of soil-test Olsen phosphorus also were considered low compared with the recommended rates for production of a canola crop. In this region, Bardella (Reference Bardella2016) showed that the concentration of soil-test Olsen phosphorus and phosphorus fertilization do not impact soybean yield (Bardella Reference Bardella2016), and therefore, low soil-test Olsen phosphorus was not amended in the present study. At the sites with lower volunteer B. napus recruitment, low available phosphorus supply likely inhibited growth of volunteer B. napus (Bélanger et al. Reference Bélanger, Ziadi, Pageau, Grant, Lafond and Nyiraneza2015), which could have caused the observed decrease in efficacy of the nonchemical weed management treatments tested. However, there is little evidence to suggest that that low supply of available phosphorus would have affected recruitment of volunteer B. napus. The difference in volunteer B. napus seedling recruitment among sites could have been linked to soil moisture content at seeding; however, soil moisture content was not measured.
The sites established in 2014 experienced greater soybean seed mortality, which caused lower soybean population densities (Table 3). About half of the soybean seeds planted did not establish as plants at the sites with higher volunteer B. napus densities (Table 4). These seeds could have succumbed to chilling injury, which can occur at temperatures between 0 and 10 C (Markowski Reference Markowski1988). However, this was not likely the case at all of the sites in 2014, because the sites with the greatest soybean mortality also were seeded latest (Table 1). Up to 50% soybean mortality has been reported in other recent studies in this region (Bardella Reference Bardella2016; Tkachuk Reference Tkachuk2017), and such large rates of soybean mortality could be due to chilling injury, early or late planting, lack of soil moisture, or the seeding implement used.
Grouping our analyses by sites with higher and lower volunteer B. napus densities eliminated all significant treatment by site interactions, with the exception of soybean emergence at the sites with higher volunteer B. napus densities (Table 3). However, significant differences between individual treatment means were not observed among these sites using simulation-based multiple comparisons (unpublished data). An analysis of covariance of soybean emergence density with the other response variables was not performed due to the inclusion of multiple soybean-seeding density treatments in the experiment.
Management Implications
At northern latitudes, volunteer B. napus competes strongly with soybean, and seed production of volunteer B. napus in soybean is a major contributor to the persistence of this weed. In western Canada, the detrimental effects of volunteer B. napus population persistence throughout crop rotations extend beyond weed management implications and can impact pathogen persistence via green-bridging. Depletion of volunteer B. napus populations could be an important component for mitigation or management of pathogens like Plasmodiophora brassicae, which cause clubroot in canola (Canola Council of Canada 2017). The incidence of clubroot in canola is increasing in western Canada, and there are few options for management aside from discontinuation of canola production, which makes management of volunteer B. napus an important proactive tool.
This study evaluated the efficacy of candidate nonchemical weed management tools as a prerequisite for the development of an integrated program for management of volunteer B. napus in soybean. In general, two biological factors should be considered when choosing tools for an IWM program: (1) crop tolerance to weed interference and (2) crop interference with weeds. Optimization of soybean spatial arrangement was effective at increasing the tolerance of soybean to weed interference. In our study, integrating a 50% increase in soybean-seeding density with narrow-row spacing resulted in the greatest increase in soybean yield under volunteer B. napus interference at higher densities (65% yield increase), followed by a 50% increase in soybean-seeding density alone (44% yield increase) and using interrow tillage (36% yield increase). It is important to note that increasing soybean population densities could result in increased pathogen pressure at the expense of greater crop tolerance to weed interference. In the present study, disease incidence or severity did not appear to be affected by greater soybean population densities; however, these factors were not measured directly. Nevertheless, the greatest soybean yield under volunteer B. napus interference was observed in the treatments with greater soybean population densities, indicating that the benefit in crop competitiveness provided by a dense soybean stand can outweigh potential detriments of greater pathogen pressure.
No individual cultural or physical weed management tool investigated here was effective at decreasing volunteer B. napus seed production to acceptable levels. The most effective tools for managing volunteer B. napus included seeding soybean in an environment with lower nitrogen supply (which caused a 44% reduction in total seed production of volunteer B. napus at sites with higher densities) or integrating increased soybean-seeding densities with reduced row spacing (which caused a 54% reduction in fecundity of volunteer B. napus plants at sites with lower densities). Given that the integration of multiple tools often results in multiplicative rather than additive efficacy for weed management, much larger reductions in seed production of volunteer B. napus may be possible when using these tools in combination. Even the tools that did not show significant improvements in soybean yield or reductions in volunteer B. napus seed production could contribute significantly when used in combination with the more effective nonchemical management strategies tested. Mixing or layering multiple herbicide mechanisms of action can facilitate management of volunteer B. napus in soybean; however, the current options available for this purpose are limited, expensive for growers to use and their efficacy is dependent on the stage of volunteer B. napus development and site-specific environmental conditions. Without diligent scouting efforts, volunteer B. napus in soybean often is not obvious visually until volunteer B. napus anthesis, resulting in limited effectiveness of late rescue herbicide treatments. Consequently, herbicides often result in incomplete management of volunteer B. napus in soybean, creating a need for IWM.
In the present study, volunteer B. napus seedbank inputs in soybean averaged about 20,300 seeds m−2 overall, or about 13,300 and 27,200 seeds m−2 among management treatments at sites with volunteer B. napus recruitment densities of about 39 and 89 plants m−2, respectively. Volunteer B. napus seed rain in soybean caused significant seedbank replenishment at these population densities. These seedbank inputs represent about 3 to 6 times the regional average seedbank inputs that occur when harvesting a canola crop, and about 110 and 220 times the recommended canola-seeding density for this region. Also, fecundity of volunteer B. napus in soybean in our study averaged about 830 seeds plant−1, indicating that large seedbank additions would occur even at low volunteer B. napus densities. To limit further seedbank additions of volunteer B. napus in soybean, it is prudent that multiple herbicide mechanisms of action are integrated with the nonchemical weed management tools identified in this study. Our results indicate that management of volunteer B. napus could be augmented most effectively by seeding soybean at high densities in narrow rows while limiting nitrogen supply or by using interrow tillage in wide-row production systems.
Acknowledgments
This project was funded by the governments of Canada and Manitoba through Growing Forward 2, a federal–provincial–territorial initiative, the Manitoba Pulse and Soybean Growers, Monsanto Canada, and a Natural Sciences and Engineering Research Council of Canada Industrial Postgraduate Scholarship and University of Manitoba Graduate Fellowship to CMG. The authors would like to thank Richardson International and the Westman Agricultural Diversification Organization for providing land for field research. The authors hereby declare that they have no conflict of interest.


