Introduction
Organic farmers face a host of challenges ranging from pests and crop infertility to contamination from genetically modified organisms and insufficient crop insurance. Yet weeds remain the most commonly cited concern of both current organic farmers (Bastiaans et al. Reference Bastiaans, Paolini and Baumann2008; Bessette et al. Reference Bessette and Arvai2018; Mohler and Johnson Reference Mohler and Johnson2009; Zwickle et al. Reference Zwickle, Wilson and Doohan2014) and conventional farmers considering transitioning to organic (Bastiaans et al. Reference Bastiaans, Kropff, Goudriaan and Van Laar2000). Without the benefit of synthetic herbicides, organic farmers must rely on a host of cultural and ecological weed management (EWM) practices to control weeds (Bastiaans et al. Reference Bastiaans, Paolini and Baumann2008). These practices include the use of different cover crops, competitive crop varieties, crop rotations, pre- and post- cultivation techniques, types of tillage, and nutrient management strategies. Integrating these practices has been shown to reduce the negative effect of weeds on crop production, increase efficiency, lower production costs, and improve profitability (Bastiaans et al. Reference Bastiaans, Paolini and Baumann2008; Liebman et al. Reference Liebman, Mohler and Staver2001). Additionally, EWM strategies focused on reducing the weed seedbank (SB) have been shown to improve soil structure, increase organic matter, and provide better drainage and aeration (Mirsky et al. Reference Mirsky, Gallandt, Mortensen, Curran and Shumway2010; Zwickle et al. Reference Zwickle, Wilson and Doohan2014).
Despite the benefits of EWM, the perceived rate of integrated EWM strategy adoption remains low (DeDecker et al. Reference DeDecker, Masiunas, Davis and Flint2014; Liebman et al. Reference Liebman, Baraibar, Buckley, Childs, Christensen, Cousens, Eizenberg, Heijting, Loddo and Merotto2016; Zwickle et al. Reference Zwickle, Wilson and Doohan2014). Potential explanations for this low rate include the inherent complexity required in designing EWM strategies and the tendency for communication and outreach efforts to focus on the risks of adopting EWM strategies rather than their long-term benefits (Bessette et al. Reference Bessette and Arvai2018; Zwickle et al. Reference Zwickle, Wilson and Doohan2014). Focusing on the risks of options rather than their benefits has been shown to increase rather than lessen risk perceptions around integrated weed management (Swanton et al. Reference Swanton, Mahoney, Chandler and Gulden2008). Another suggested culprit is the lack of understanding and quantitative measures regarding the relative applicability, reliability, and efficacy of different EWM practices (Bastiaans et al. Reference Bastiaans, Paolini and Baumann2008).
Recent work also demonstrates that many organic farmers either do not know about or prefer not to seek out information regarding EWM (Bessette et al. Reference Bessette and Arvai2018). When organic farmers do seek out information, they tend to ignore the recommendations of university scientists and extension agents, ACRES USA publications, and regional farm visits and conferences, (Bessette et al. Reference Bessette and Arvai2018; Goldberger Reference Goldberger2008; Jabbour et al. Reference Jabbour, Zwickle, Gallandt, McPhee, Wilson and Doohan2014b). This tendency may be the result of past institutional biases, that is, criticism of and opposition to organic farming by land-grant universities (Constance and Choi Reference Constance and Choi2010). However, Misiewicz et al. (Reference Misiewicz, Shade, Crowder, Delate, Sciligo and Silva2017: 14) has argued that Extension and university scientists still suffer from a “lack of basic understanding of organic agricultural practices, organic farmers’ needs and existing research.”
Perhaps as a result, nearly two-thirds of organic farmers report relying extensively on their own trial and error (Bessette et al. Reference Bessette and Arvai2018), and Dedecker et al. (Reference DeDecker, Masiunas, Davis and Flint2014) found that 83% of organic farmers report relying most heavily on other farmers for EWM information. Relying heavily on these social networks is especially important for farmers considering unfamiliar practices and those with highly uncertain results, as many farmers seek to share responsibility with others in the case of failure (Pannell et al. Reference Pannell, Marshall, Barr, Curtis, Vanclay and Wilkinson2006). Yet these sources of information may also result in farmers relying too heavily on salient, status quo practices that focus principally on short-term results, leading to suboptimal decisions over time. Such social networks may also limit uptake of integrated EWM strategies by spreading potential misconceptions about the role of weeds as indicators of soil nutrient status and seed persistence (Bessette et al. Reference Bessette and Arvai2018; Jabbour et al. Reference Jabbour, Zwickle, Gallandt, McPhee, Wilson and Doohan2014b). These networks may also promote intuitive yet often faulty beliefs about the inverse relationship between risk and benefit; that is, practices perceived as being beneficial are also commonly perceived to have low risk, and vice versa (Doohan et al. Reference Doohan, Wilson, Canales and Parker2010).
All of these hurdles make informing organic farmers about and promoting EWM strategies difficult. Encouraging individuals to investigate and employ unfamiliar practices and take a longer-term focus is especially complicated. A host of personality traits and demographic and farm characteristics are likely to affect farmers’ willingness to investigate and adopt new practices (Liebman et al. Reference Liebman, Baraibar, Buckley, Childs, Christensen, Cousens, Eizenberg, Heijting, Loddo and Merotto2016; Tautges et al. Reference Tautges, Goldberger and Burke2016). These include farmers’ level of risk aversion, whether they are innovators or late adopters with respect to new approaches, their access to off-farm income, property size, number and variety of crops farmed, age, and education level (Bessette et al. Reference Bessette and Arvai2018; Tautges et al. Reference Tautges, Goldberger and Burke2016). Complicating matters, farmers, like most others, have demonstrated what researchers call fundamental attribution error, or the tendency to blame weed problems on factors outside their control, while crediting their own practices when such problems are resolved (Doohan et al. Reference Doohan, Wilson, Canales and Parker2010; Wilson et al. Reference Wilson, Tucker, Hooker, LeJeune and Doohan2008). Additionally, behavioral decision research suggests that when faced with a choice between two vague options, farmers will often select the least vague option, even when the alternative is expected to perform better (Ellsberg Reference Ellsberg1961).
Many of these psychological hurdles stem from and are examined using what behavioral decision researchers term “dual process theory,” or the theory that human decision making is a combination of intuitive, affective, and experiential thinking (System 1) and more deliberative, analytical thinking (System 2) (Damasio Reference Damasio2006; Epstein Reference Epstein1994; Kahneman and Egan Reference Kahneman and Egan2011). Relying on System 1 tends to result in decisions based on past experience or those practices that are most salient, that is, what farmers speak about most often with their friends and neighbors. System 2 deliberation requires a more systematic evaluation of the scientific literature examining EWM practices and strategies. Even if this literature and its recommendations are straightforward, deploying EWM may not be. As characterized by an expert in previous work: “[EWM is] a very complicated interaction between plants, the microbes, earthworms, seed predators … it’s hard for us to understand how our different management practices affect some of these prophecies over time” (Zwickle et al. Reference Zwickle, Wilson and Doohan2014; p 363). Discerning a relationship between the impacts of an integrated EWM strategy requires a long time frame and a great deal of uncertainty, which regardless of predicted improvements in performance, likely limits adoption (Zwickle et al. Reference Zwickle, Wilson and Doohan2014).
At the same time, Zwickle et al. (Reference Zwickle, Wilson and Doohan2014) and others (Bastiaans et al. Reference Bastiaans, Paolini and Baumann2008) have identified strategies for reducing risk perceptions and increasing both adoption of EWM and a longer-term focus on SB management. First, they recommend providing farmers with information that emphasizes the whole-farm, long-term benefits of SB, rather than information about its risks. For example, researchers should demonstrate how an EWM made up of crop rotations and cover crops can improve soil structure, increase organic matter, and provide better drainage and aeration, as well as how adopting SB strategies would save farmers time and labor in the future relative to “critical weed-free” (CWF) management strategies. CWF strategies rely primarily on mechanical weeding during a period characterized by a weed’s white-thread stage to when a weed’s growth no longer compromises crop yield. CWF strategies are the riskiest weed management strategies according to experts (Zwickle et al. Reference Zwickle, Wilson and Doohan2014).
Second, Zwickle et al. (Reference Zwickle, Wilson and Doohan2014) recommend characterizing the short- and long-term trade-offs of EWM and SB in a straightforward and discernible manner, as well as characterizing the trade-offs between SB and other strategies such as CWF. The temporal mismatch between the management benefits of CWF and SB, the former being concrete and visible in the short term and the latter not appearing until subsequent seasons—and even then being less visible—makes this comparison difficult and biases farmers against SB management (Frederick et al. Reference Frederick, Loewenstein and O’Donoghue2002). Finally, like Misiewicz et al. (Reference Misiewicz, Shade, Crowder, Delate, Sciligo and Silva2017), Zwickle et al. (Reference Zwickle, Wilson and Doohan2014) also recommend incorporating farmers’ local knowledge, beliefs, and current practices into scientists’ understandings of EWM and SB management.
Work identifying specific weed management strategies that can be both tailored and communicated to—and adopted by—individual organic farmers has been called for widely in the literature (Bastiaans et al. Reference Bastiaans, Paolini and Baumann2008; Jabbour et al. Reference Jabbour, Zwickle, Gallandt, McPhee, Wilson and Doohan2014b; Misiewicz et al. Reference Misiewicz, Shade, Crowder, Delate, Sciligo and Silva2017; Tautges et al. Reference Tautges, Goldberger and Burke2016; Zwickle et al. Reference Zwickle, Wilson and Doohan2014). In this study, we describe the development, deployment, and results of an online decision support tool (DST) that assists organic farmers in identifying priorities, characterizing the performance of their current practices, and evaluating integrated EWM strategies recommended by an expert advisory panel (EAP). In an effort to better characterize and communicate the long-term benefits and trade-offs of EWM and SB strategies, our DST incorporates years of previous research examining (1) organic farmers’ mental models (Jabbour et al. Reference Jabbour, Gallandt, Zwickle, Wilson and Doohan2014a, Reference Jabbour, Zwickle, Gallandt, McPhee, Wilson and Doohan2014b; Zwickle Reference Zwickle2011; Zwickle et al. Reference Zwickle, Wilson and Doohan2014), (2) their risk perceptions (Bessette et al. Reference Bessette and Arvai2018; Zwickle et al. Reference Zwickle, Wilson, Bessette, Herms and Doohan2016), and (3) online DSTs that focus on evaluating “portfolios” or strategies composed of multiple options (Bessette and Arvai Reference Bessette and Arvai2018; Bessette et al. Reference Bessette, Arvai and Campbell-Arvai2014, Reference Bessette, Campbell-Arvai and Arvai2016).
The current DST also incorporates tenets of values-focused thinking (Keeney Reference Keeney2009) and structured decision making (SDM) (Gregory et al. Reference Gregory, Failing, Harstone, Long, McDaniels and Ohlson2012). SDM is an analytic-deliberative method that decomposes complex decisions into more manageable steps, first by asking individuals to identify their objectives or focus on their values—here their on-farm goals, such as improving soil quality or their quality of life—and then by helping them evaluate the performance of a wide range of options—here different EWM strategies—across those objectives. Concentrating on what individuals consider most important to achieve, rather than narrowing the debate to existing options (aka, “alternative focused thinking”) can increase the internal consistency of people’s decisions or the degree to which people’s decisions align with their values and objectives (Bessette et al. Reference Bessette, Campbell-Arvai and Arvai2016). Such an approach can also increase the range of objectives and options people consider (Bessette et al. Reference Bessette, Campbell-Arvai and Arvai2016; Bond et al. Reference Bond, Carlson and Keeney2008). SDM also focuses on presenting trade-offs in a clear and meaningful way; in particular by incorporating multiple means of evaluating options and illustrating how those options perform specifically across objectives. In the current DST, we included both a swing-weighting task focused on prioritizing on-farm objectives and a holistic ranking exercise focused on prioritizing EWM strategies.
In the next three sections, we describe our DST, the results of its initial deployment online, and finally, its implications, limitations, and next steps.
Materials and methods
Study context
The DST used in this study was developed over the course of 3 yr by the authors with assistance from an EAP. Seven individuals made up the full EAP, four of whom were tasked with refining the alternative organic farming strategies, decision objectives, and performance measures previously identified in Jabbour et al. (Reference Jabbour, Zwickle, Gallandt, McPhee, Wilson and Doohan2014b) and Zwickle et al. (Reference Zwickle, Wilson and Doohan2014). Interviews with 23 organic farmers had identified the most common practices and the objectives used to evaluate them (Jabbour et al. Reference Jabbour, Zwickle, Gallandt, McPhee, Wilson and Doohan2014b), while an additional 16 expert interviews identified those specific practices that make up a proper weed SB management strategy (Zwickle et al. Reference Zwickle, Wilson and Doohan2014). For the current work, a series of structured elicitations were held with these four EAP members—a professor of horticulture and crop science, a professor of weed ecology, an Extension director and program director, and finally, an integrated weed management specialist—to estimate the performance of the common strategy and the SB management strategy across the objectives and performance measures, while also considering crop type and soil type variables that likely affect these estimates. This work resulted in the development of consequence tables characterizing the performance of each farming strategy for two different crop types (vegetables and row crops) and soil types (sandy loam and clay). These consequence tables formed the basis for comparison against a farmer’s “current” strategy, and for the use of multi-criteria decision analysis (Dodgson et al. Reference Dodgson, Spackman, Pearman and Phillips2009) techniques to estimate which strategy may be best suited for a farmer based on his or her key objectives. The remaining three EAP members—a professor of botany and plant pathology, a professor of plant breeding and crop protection, and a farm advisor from Cooperative Extension—both reviewed these consequence tables and iteratively reviewed the DST throughout its development.
Initially designed using Microsoft Excel, the DST was redeveloped in HTML to be more user-friendly and reach a wider audience via the Internet. Before the current deployment, 11 in-person interviews and evaluations of the DST were conducted with members of an organic farmer advisory panel (OFAP) consisting of six organic growers, a seed consultant, an organic farm manager, an Extension agent, and two staff members from a national organic certification organization. The DST is currently available at www. OrganicWeedManager.com. It is composed of three modules, each described later, as well as pre- and posttool survey questions. The Ohio State University’s Behavioral and Social Sciences Institutional Review Board reviewed and approved this study (study number: 2016B0098).
Subjects
Following our initial evaluations, 1,324 organic farmers from across the United States were invited via email to engage the DST. The sample was drawn from the USDA’s Organic Integrity Database (https://organic.ams.usda.gov/integrity). Of those invited, 359 (27%) visited the website, with 69 of those visitors (19%) registering their email addresses and engaging the tasks. Of those registered, 45 farmers (65%) completed all three modules and answered both the pre- and posttool survey questions. Our analysis only considers those individuals.
Half of the participants (n = 22) were based in the U.S. Midwest (i.e., Ohio, Indiana, Pennsylvania, Minnesota, and Michigan), with the remaining half stemming from across the United States—due to the location of the EAP and OAP members and our own outreach efforts, we desired and expected greater participation from midwestern farmers. Participants averaged 47 yr of age (SD = 13 yr); operated farms that were on average 601 acres in size (SD = 1,745) and were certified organic at least 10 yr ago (SD = 7.5 yr). Slightly more than half of our participants farmed grains (n = 24), 15 grew vegetables, and 6 grew forages. The sample was predominantly male (n = 39, 87%), which was similar to the makeup of our OFAP (9 out of 11 panel members were male). The sample was not intended to be representative; instead, it was intended to allow evaluation of the effectiveness of the decision-making tasks. The median time spent engaging the DST was 27 min (minimum = 7 min), and participants who completed the tasks and submitted their email addresses were sent US$20 in Tango eGift cards for participating.
Module 1: identifying practices
After the introductory survey asking participants about their organic farming history (size of farm, year of certification, etc.) and a brief tutorial that depicts and explains the principal tasks, icons, and means of response, the DST begins with Module 1. Module 1 asks participants to identify their on-farm characteristics and the weed management practices they most commonly employ. Participants are provided drop-down menus with multiple options and are asked to identify their dominant soil type, as well as their methods of crop rotation, cover crops, cultivation, tillage, and nutrient management. Participants could select more than one method for each practice. See Table 1 for a list of the methods available and the practices most often used by our participants.
Table 1. Module 1 and Module 2 results (n = 45)

a In Module 1, participants identified their current practices.
b In Module 2, participants identified how well their sets of practices performed across the six characteristics.
Module 2: eliciting performance
Module 2 asks participants to think about how well their practices elicited during Module 1 perform on their farms using key on-farm objectives or “characteristics.” Using the EAP and OFAP interviews and previous mental models research (Jabbour et al. Reference Jabbour, Zwickle, Gallandt, McPhee, Wilson and Doohan2014b; Zwickle et al. Reference Zwickle, Wilson, Bessette, Herms and Doohan2016) we identified the most important and common on-farm characteristics for organic farmers. Again using drop-down menus—this time with available on-screen help and tutorials, participants were asked to identify the (1) percentage of soil organic matter on their farms, (2) how quickly water infiltrates their soil, (3) the biological health of their soil, (4) the extent of their weed SB, and the amount of (5) time and (6) money they spend on weeding. Again, see Table 1 for participants’ responses.
Module 3: evaluating trade-offs
Module 3 asks participants to review the performance of three strategies, composed of different weed management practices, across each of the on-farm characteristics described. In a previous and separate elicitation, our EAP predicted how these three strategies would perform. Participants are also asked to evaluate the trade-offs between these strategies and their own current set of practices across each of the on-farm characteristics. The strategies included a “common strategy,” or a combination of the most common practices used by organic farmers; a “critical-stage weed management strategy,” which included practices focused on eliminating weeds at the critical white-thread stage; and finally, a “seedbank elimination strategy,” which amplified farmers’ efforts in the short run to dramatically reduce weed seeds from the soil, leading to reduced efforts and higher-quality soil in the long run. The specific practices that make up each strategy are provided in the Supplementary Material (see Supplementary Figure S1).
Module 3 begins with a holistic ranking (HR) task, (see Figure 1), which allows participants to compare how the three strategies and their own strategies, that is, “Your Strategy,” perform across the six on-farm characteristics simultaneously. Participants are then asked to rank the strategies from most to least preferred. HR, while cognitively demanding, is representative of how decisions are commonly made, both by farmers and the public in general (Bessette et al. Reference Bessette, Wilson and Arvai2019; Fischhoff Reference Fischhoff1991).

Figure 1. Module 3: holistic ranking (HR) task. In this task, participants evaluate how each strategy performs across all six characteristics. By clicking on a strategy, participants can click on and reorder the strategies from their most preferred to their least preferred.
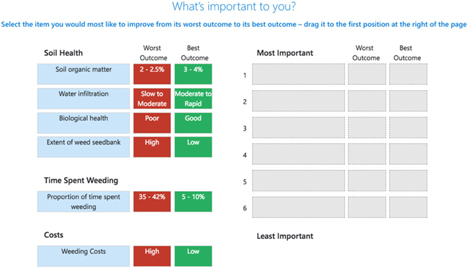
The second part of Module 3 includes two characteristics prioritization tasks (CP 1 and CP 2). In these tasks, participants are asked to prioritize their on-farm characteristics, or objectives, from most to least important. Participants are shown the worst-case and best-case performance of each characteristic (across the strategies used earlier) and are asked how important it is to them to move (or “swing”) each characteristic from its worst performance to its best (see Figure 2). The objective that they deem most important to move from its worst to best performance is ranked first, then the remainder are ranked using the same method. The participant is then asked to assign between 0 and 100 points to each of the ranked objectives to indicate how important they are relative to one another. The first-place objective must be given 100 points, while the remainder can be assigned anywhere from 0 to 100 points each. This type of prioritization exercise is commonly called “swing-weighting” (Clemen and Reilly Reference Clemen and Reilly2013) and is useful, as it increases participants’ sensitivity to the range of possible outcomes for each objective for the decision at hand, rather than ranking objectives without contextual information.

Figure 2. Module 3: first characteristic prioritization (CP 1) task: In this task, participants rank the characteristics in order of most important to least, while also considering the range of performance for each characteristic.
Here, we used a variant of swing-weighting called Simple Multi-attribute Rating Technique—Exploiting Ranks, or SMARTER, to initially assign relative weights (out of a total of 100) to each objective based on its rank order. This method uses a mathematical approach to generate “surrogate” weights that are similar to elicited weights, thereby reducing the cognitive burden of the prioritization task while providing similar outcomes (Edward and Barron Reference Edward and Barron1994). Module 3 uses two versions of this prioritization task; in the first, CP 1, participants simply drag and drop characteristics into a prioritization table; in the second, CP 2, participants can provide more precise importance weights by adjusting slider bars (see Figure 3). The specific weights and overall distribution are then depicted using a pie chart.

Figure 3. Module 3: second characteristic prioritization (CP 2) task: In this task, participants make finer adjustments regarding the importance of each characteristic. Hovering over either the characteristic or the pie chart provides additional information about each.
Following CP 2, the best-performing strategy is identified for each participant using a linear additive value function (Equation 1) to estimate the overall value of each alternative based both on the performance of the alternative across each objective and the weight that the participant assigns to those objectives (Dodgson et al. Reference Dodgson, Spackman, Pearman and Phillips2009). The use of linear value functions is common in decision analysis (Clemen and Reilly Reference Clemen and Reilly2013).
 $$V\left( x \right)={\rm{}}\mathop \sum \limits_{k=1}^K {w_k}{v_k}$$
Equation 1 is a linear additive value function, where wk is the assigned weight and vk is the performance of an alternative for objective k.
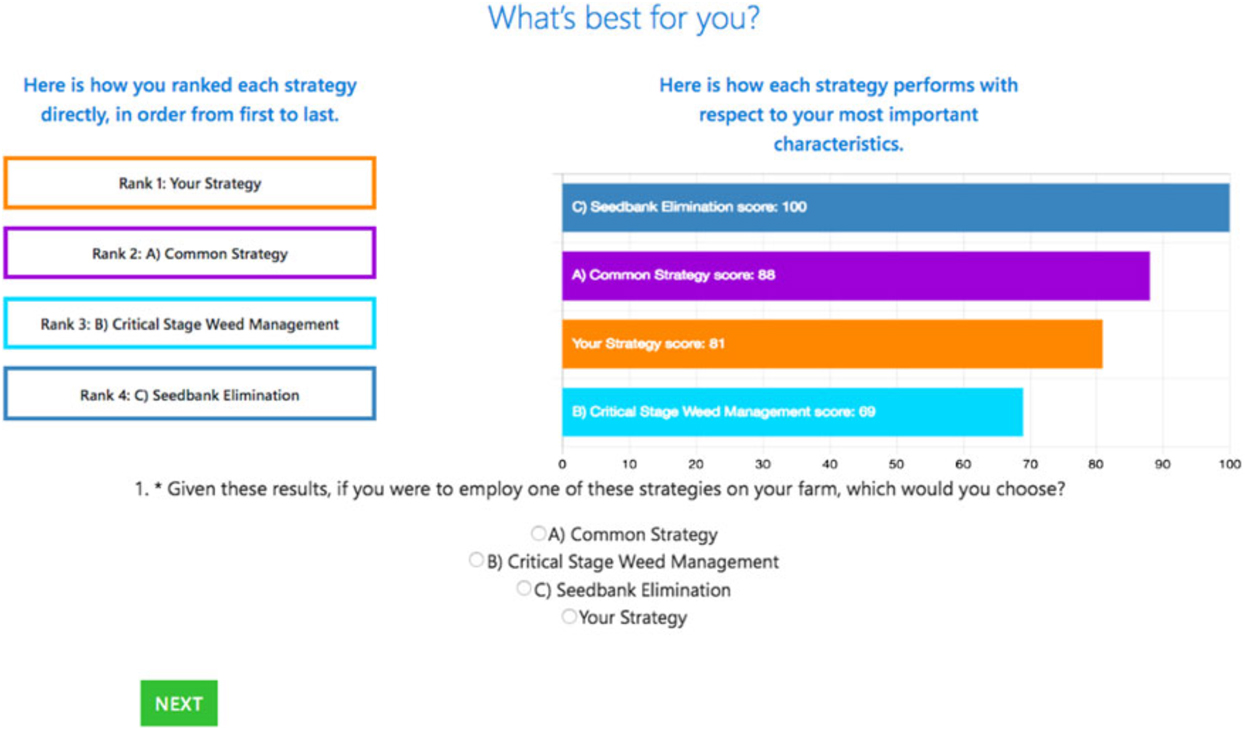
The module then closes by presenting participants a final choice between the best-performing strategy based on their characteristic weights (from the CP 1 and CP 2 exercises) and the strategy that they previously ranked highest (in the HR exercise) (see Figure 4). Participants are shown a bar graph depicting how all four strategies are predicted to perform, with each strategy receiving a score relative to 100—remember that the best-performing strategy’s score is always equal to 100. Previous work has suggested that presenting participants with a choice between their top-ranked option and an option predicted to perform best based on their weights can increase the extent to which people’s choices align with their prioritized objectives (Bessette et al. Reference Bessette, Arvai and Campbell-Arvai2014).

Figure 4. Participants’ final choice task: In this task, participants are presented a choice between the strategies that they ranked highest and the strategies that performed best based on their characteristic prioritizations. The best-performing strategy is represented by a single score and horizontal bar, unlike in the HR task, where each strategy’s performance is depicted using all six characteristics.
At the conclusion of Module 3, participants are asked questions about their final choices, what characteristics drove those choices, and their intentions regarding weed management following engagement with the DST. Finally, to encourage and simplify the incremental changes farmers would need to make to move from their current practices to an integrated EWM strategy, our DST incorporated an informative step-by-step guide that outlined which practices farmers would need to adopt or abandon (see Figure 5).
Data analysis
Descriptive statistics, including calculating means and standard deviations, were the primary methods of data analysis for this study.
Results and discussion
Modules 1 and 2: practices and performance
Participants reported a wide range of practices and on-farm performances; see Table 1 for a full accounting. Nearly all participants selected a single crop-rotation practice (n = 42, 93%) and single cover crop practice (n = 43, 95%), while two-thirds (n = 30) relied on more than one cultivation practice. Thirty-nine (87%) participants used a single tillage practice, and 35 (78%) used a single fertilizer feed practice.
Participants reported a range of soil types and soil organic matter (SOM), with a slight majority selecting clay soil (n = 20, 44%) over sandy loam (n = 17, 38%) and 2% to 3% being the most commonly elicited proportion of SOM (n = 13, 29%). Water infiltration and the extent of participants’ weed SB were both most often reported as moderate (the descriptions and pictures can be seen at www.organicweedmanager.com). Biological health was most often reported as good (n = 23, 51%); nearly half of the participants reported spending less than 10% of their time during the growing season on weeding (n = 20, 44%), and 60% (n = 27) reported spending less than US$100 per acre on equipment, fuel, and labor.
Module 3: choice tasks
HR task: initial preferences for strategies
When comparing performance of strategies holistically, participants overwhelmingly ranked their own strategies highest (n = 33, 73%), with only 8 (18%) ranking SB elimination and 4 (9%) ranking critical-stage weed management highest, respectively; see Table 2. Accordingly, only 2 participants (4%) ranked their own strategies worst, while 32 (71%) ranked SB elimination worst. The common strategy and critical-stage weed management strategies were most commonly ranked second (n = 31, 69%) and third (n = 29, 64%), respectively.
Table 2. Module 3 results (n = 45)

a Strategies: how often each strategy was ranked first, second, third or fourth, as well as how that strategy was predicted to perform based on each participant’s characteristic weights. The mean score of each strategy and how many times it was selected during the final choice is also shown.
b Characteristics: participants’ importance weights, as well as how participants prioritized each characteristic in the two characteristics prioritization tasks (CP 1 and CP 2).
CP task 1
In CP1, a third (n = 15) of the participants selected SOM as the most important characteristic, and 13 selected the biological health of their soil as most important; see Table 2. Overall, a third of the participants (n = 15) ranked both SOM and biological health as the two most important characteristics. The least important characteristics regarded the labor and financial resources devoted to weeding, that is, the cost of weeding and time spent weeding. The cost of weeding was most often ranked lowest (n = 22), while the time spent weeding was ranked second lowest most often (n = 12).
CP task 2
In CP 2, participants were able to make adjustments to the importance weights attributed to each characteristic in CP 1. The SMARTER formula automatically attributes the following weights to the characteristics rated 1st, 2nd, 3rd, 4th, 5th and 6th: 29.7, 24.1, 18.8, 13.9, 9.1, and 4.5, respectively. When provided the opportunity, 28 participants (65%) adjusted the sliders (16 did not), resulting in biological health and SOM receiving the highest weights (22.98, SD = 5.26, and 21.29, SD = 4.60, respectively); see Table 2. The cost of weeding received the lowest weight (10.23, SD = 2.85), and the proportion of time spent weeding received the second-lowest weight, (13.78, SD = 3.03).
If participants adjusted the sliders accordingly in CP2, they could adjust not only the characteristics’ weights, but also the rank order of the characteristics. Nearly half of the participants (n = 20) did re-rank the characteristics, and the most common ratings following CP2 are provided at the bottom of Table 2. While SOM was most commonly rated highest in CP1, after adjustment, it was most commonly rated as third highest. Biological health, most commonly rated second highest in CP1, became the most highly rated characteristic in CP2.
Strategy performance
How strategies performed based on both participants’ importance weights from CP2 and EAP predictions of strategy performance differed significantly from how participants ranked strategies; see Table 2. SB elimination was by far the best-performing strategy, predicted to perform best for participants in nearly every case (42 out of 43). The common strategy was predicted to perform second best in 28 out of 43 cases, while critical-stage weed management was predicted to perform worst in 24 out of 43 cases. Participants’ own strategies were only predicted to perform best in one case and were most often predicted to perform worst, that is, in 19 cases.
The average strategy scores implied SB elimination was by far the best-performing strategy; as such, it scored 100 points. Next best was the common strategy (81.23, SD = 7.10), participants’ own strategies ranked third best (72.62, SD = 7.24), and critical-stage weed management performed worst (68.77, SD = 5.00).
Final choice task
Of 33 people who initially ranked their own collections of practices highest, only 13 (39%) chose their own strategies when provided a final choice between “your strategy” and the strategy that performed best based on the linear value function. Sixteen (48%) selected the SB elimination strategy, and 1 selected the common strategy (1 participant faced no choice, and 2 were missing). Of the 8 participants who initially ranked SB elimination highest, 7 selected it during the final choice, and 1 selected the common strategy. Finally, of the 4 participants who initially ranked critical-stage weed management highest, 3 selected it as their final choice, with 1 selecting SB elimination. In the end, 53% of participants selected SB elimination as the final choice, while 29% chose their own strategy; see Table 2.
Posttool survey questions
For those who did not choose SB elimination as the final choice, participants’ explanations revolved primarily around beliefs regarding weed subsistence or structural constraints. Regarding the former, participants wrote, “I believe that good biological life in soils and good cultivation practice and balanced soils will really help to manage weeds”; “Everyone wants to eliminate the weed seed bank. But it’s not only impractical. It’s impossible. What allows weeds to flourish is soil conditions”; “Always will have a weed seed bank. Will always need to manage them and they are an indicator of soil health balance.” Regarding the latter, participants wrote, “[SB elimination] requires lots of cover crops [which are] hard to sell and make a profit”; “We are space limited on our farm”; and “Don’t have markets for organic crops on a 4-year rotation.”
When asked about which characteristic was most important to participants having now seen how the strategies performed and how they had ranked them, 10 participants identified extent of weed SB as the most important factor. However, of these participants, only 4 had identified extent of weed SB as most important in the CP task. Finally, when asked about the hardest trade-off the participants face when managing weeds, 13 mentioned “time.” Of these 13, only 1 rated the time spent weeding as the most important priority during CP.
Encouraging results
The DST described in this paper was intended to communicate the long-term benefits of EWM, improve trade-off analysis, and provide an incremental and operationalizable pathway for farmers to investigate and pursue EWM strategies. Each has been called for in the literature (Liebman et al. Reference Liebman, Baraibar, Buckley, Childs, Christensen, Cousens, Eizenberg, Heijting, Loddo and Merotto2016; Zwickle et al. Reference Zwickle, Wilson and Doohan2014), as has the need to collect and incorporate information and experiences from local farmers (Misiewicz et al. Reference Misiewicz, Shade, Crowder, Delate, Sciligo and Silva2017). Our DST pursued these goals via an SDM framework and an online interface that asked organic farmers to (1) explicitly identify their practices, (2) examine how well those practices perform with respect to their most important on-farm characteristics and objectives, and finally, (3) evaluate EWM strategies, in particular an SB elimination strategy that was predicted to outperform farmers’ current practices, particularly in the long-term. Following the three modules, our DST also provided recommendations to participants in the form of a table that clearly laid out which practices farmers would need to either adopt or discard to pursue a new strategy. In most cases, this was a strategy focused on eliminating the weed SB.
The results of this initial deployment are encouraging. Based on the literature (Zwickle et al. Reference Zwickle, Wilson and Doohan2014), previous mental model interviews (Jabbour et al. Reference Jabbour, Zwickle, Gallandt, McPhee, Wilson and Doohan2014b; Zwickle Reference Zwickle2011), and our work in other contexts, particularly energy planning (Bessette et al. Reference Bessette, Campbell-Arvai and Arvai2016), we expected to see farmers demonstrate a heavy reliance on practices that result in tangible short-term benefits and a reduction in short-term risk (Zwickle et al. Reference Zwickle, Wilson, Bessette, Herms and Doohan2016). At the same time, we expected that when prioritizing objectives, participants would rank highest the complementary objectives of improved SOM and biological health, both of which manifest over time and require multiple seasons to achieve. This tendency to reduce short-term risk and maximize short-term benefits at the expense of long-term performance has been well documented (Frederick et al. Reference Frederick, Loewenstein and O’Donoghue2002).
The results of the final choice task demonstrated that participants were not only open to pursuing an SB elimination strategy, but recognized and valued its distinct advantage in the long term. While a majority of our participants initially ranked their own strategies or collections of practices highest, nearly half of those participants ultimately chose to employ the SB elimination strategy when shown how the respective strategies performed according to their most important characteristics.
Much of the SB elimination strategy’s advantage in performance manifests in that fifth year of deployment and beyond, which can be seen in the rightmost column of characteristic performance in Figure 1. Note the column is solidly dark green. In almost every case, SB elimination demonstrated a distinct long-term performance advantage over the other strategies and did so across all characteristics. This was due primarily to its increased short-term costs, that is, the increase in labor and time spent weeding and fertilizing, as well as short-term sacrifices in soil health resulting from increased cultivation. Note the column representing SB elimination’s first 4 yr is mostly red. When asked about the weeding costs specifically, the majority of our participants reported spending less than US$50 acre−1 and spent only 5% to 10% of their time weeding, and almost all rated both weeding objectives as least important. However, that was not the case with soil health; these objectives were consistently rated as very important. At the same time, pursuit of soil health cannot be completed in a single season and instead takes years to achieve. This dilemma, or the significant trade-offs between SB elimination’s high costs in the short run and high benefits in the long run, captures the difficulty of both evaluating EWM strategies’ performance holistically (i.e., via the HR task) and designing and deploying EWM strategies on the farm.
Further complicating matters is participants’ posttool survey responses in which more than a quarter of them reported “time” as the hardest trade-off they make when choosing how to manage weeds. These responses are inconsistent with participants’ selections in the CP task, in which only 1 rated the time spent weeding as the most important priority. Clearly participants prioritize soil health over the time spent weeding—this is made abundantly clear in the choice tasks, and yet participants tended to ignore soil health in the survey questions. This speaks to the value of including a swing-weighting task in making the range of performance for each characteristic explicit, that is, reminding farmers that they will likely only spend anywhere from 5% to 10% of their time weeding (based on their own responses). It also speaks to farmers’ tendency to focus on farm management rather than farm ecology (Zwickle et al. Reference Zwickle, Wilson, Bessette, Herms and Doohan2016), except when the two are explicitly compared. As previous studies suggest (Zwickle et al. Reference Zwickle, Wilson and Doohan2014), when provided an opportunity to deliberate upon and analyze their goals, participants identified slightly different goals from the ones they pursue navigating the complexities of farm management, farm ecology, and quality of life on a day-to-day basis.
The inconsistency demonstrated here between participants’ on-farm priorities, their management decisions, and the choices they make in this DST is certainly not specific to organic farmers. Instead, this lack of consistency is quite common in complex, uncertain (and unfamiliar) contexts that require engaging a host of conflicting trade-offs between both values and outcomes (Bessette et al. Reference Bessette, Campbell-Arvai and Arvai2016, Reference Bessette, Wilson and Arvai2019; Dietz Reference Dietz2013). While providing concrete recommendations based on an individual’s farm characteristics and prioritized objectives is surely valuable, and farmers have requested such recommendations, it is not likely there will be one or even just a few correct answers. Instead, and as we hoped to show here, the goal of decision support is to simply make those difficult trade-offs more explicit to farmers. Here we did so by articulating them in the HR and CP tasks, that is, by using the red, yellow, and green cells and pie slices. Additionally, not just farmers, but decision makers the world over, struggle to both imagine and explicitly plan for the long-term ramifications of their decisions (Peters and Slovic Reference Peters and Slovic2000; Weber Reference Weber2006). As such, this DST worked to show farmers how those difficult trade-offs evolve over time and to remind farmers that the decisions they make to maximize soil health in one season may not be the best means of maximizing soil health 4 or 5 yr later.
Finally, making trade-offs between conflicting priorities and characterizing on-farm performance is difficult enough; predicting how new, unfamiliar suites of practices may perform and thus address those priorities is far more challenging. Here again, this DST presented new EWM strategies to farmers and framed their potential performance using farmers’ most important objectives. Additionally, Liebman et al. (Reference Liebman, Baraibar, Buckley, Childs, Christensen, Cousens, Eizenberg, Heijting, Loddo and Merotto2016: 1363) proposed that effectively communicating information about EWM requires “linking it to messages that trigger changes in perception and behavior,” including narratives of representative farmers, as well as inviting farmers to make incremental rather than wholesale changes. As a result, we included both the most common strategy of organic farmers for participants to examine and the farmer guidance page spelling out step-by-step changes farmers could make to pursue a new EWM strategy: see Figure 5. While adopting new weed management strategies is risky, we hope that by focusing farmers’ attention on the potential benefits of these strategies, we may increase adoption or at least encourage farmers to seek out more information regarding EWM (Bessette et al. Reference Bessette and Arvai2018). Better decisions require better information.

Figure 5. Farmer guidance. Step-by-step guidance was provided in the form of a table to each participant at the conclusion of the tool depicting practices to begin and practices to abandon if the participant wants to pursue a new EWM strategy.
Limitations
There are certainly limitations to the current DST, its value model, and the predictions of our EAP. These limitations do not invalidate the work as much as provide direction moving forward. First, predicting how different EWM strategies or combinations of unique practices will perform over the long term across different soil types, commodities, weed species, and farmer characteristics is extremely difficult and will surely require a multitude of long-term field trials; see Parsons et al. (Reference Parsons, Benjamin, Clarke, Ginsburg, Mayes, Milne and Wilkinson2009) for an example of a DST that targeted weed management strategy development in a conventional system. Such trials have been requested both by organic farmers and researchers, and the National Institute of Food and Agriculture is contributing heavily to them (NIFA 2017). Generalizable long-term tests of different practices under unique circumstances have yet to begin in earnest, or at least conclude. As our participants’ survey responses make clear, though we can demonstrate the potential benefits of SB elimination, real barriers to adoption remain that can only be addressed with better research and/or better dissemination of evidence to the contrary (i.e., successful elimination of a SB).
One of the advantages of our particular design, however, is that in addition to providing information and recommendations to organic farmers, it is intended to become a means of collecting data on farm characteristics (e.g., soil and farm types), objectives (e.g., biological health and SOM), and EWM strategies that perform best with respect to both. With each additional participant, the accuracy of the underlying model and its predictions can improve. In this way, the DST relies on each additional participant to improve both the data set and our understanding.
Additionally, as stated earlier, much of the performance advantage of SB elimination occurs in the fifth year and beyond. Our model did not explicitly discount this performance or the long-term costs associated with future weeding. This was done for two reasons. First, the intent of our DST was to increase the salience of these long-term benefits, not reduce it, and second, discounting the value of future behavior requires additional information, primarily a farmer’s future time preferences (Frederick et al. Reference Frederick, Loewenstein and O’Donoghue2002). Due to time constraints, we could not elicit these preferences; however, going forward, they could and should be elicited, particularly in facilitated sessions, and incorporated into the DST’s predictions and recommendations. Existing scales are available (Zimbardo and Boyd Reference Zimbardo and Boyd2015).
Finally, our DST relied on a red−yellow−green color palette. While this stoplight palette is quite effective in delineating trade-offs, it suffers from usability issues regarding potentially color-blind participants.
Next steps
Next steps for this research include (1) examining the DST’s effectiveness in facilitated settings—its original target audience, (2) adjusting the DST’s parameters and deploying it across a smaller sample of organic farmers who share more consistent geography and market conditions, (3) assessing the types of farmers who are most likely to benefit from this type of decision support, and finally, (4) completing long-term field trials and incorporating their results, along with existing participants’ responses, into an improved model and online interface.
In pretests, organic farmers consistently reported that working through the tool’s tasks and characterizing their performance helped them to think about weeds and weed management differently. As a result, we believe the DST has potential in both Extension and university settings for teaching organic farmers (both current and prospective) about EWM and about engaging trade-offs, prioritizing objectives, and making decisions more in line with those objectives.
Supplementary material
To view supplementary material for this article, please visit https://doi.org/10.1017/wsc.2019.21.
Author ORCID
Douglas Bessette https://orcid.org/0000-0001-7709-8518.
Acknowledgments
We would like to thank the members of our expert advisory panel and organic farmer advisory panel, as well as Doug Doohan, Steve Culman, Sarah Zwickle, and Graham Long for their invaluable contributions. This research was funded by the National Institute of Food and Agriculture Integrated Grants Program under grant no. . No conflicts of interest have been declared.