


INTRODUCTION
In 1904, the French ministry of education asked Alfred Binet and Théodore Simon to develop a test to identify pupils in need of remedial classes (Binet & Simon, Reference Binet, Simon and Kite1905). One of the first instruments to measure and scale intelligence, the Binet-Simon test quickly gained support in the psychological community, and a modified version is in use to this day as a measure of IQ (Nicolas et al., Reference Nicolas, Andrieu, Croizet, Sanitioso and Burman2013). In one of the tasks of the Binet-Simon test, children were asked to accurately repeat 15-word sentences that were read to them to gauge their memory capacity.
More than a century after it was first used, elicited imitation (EI) has now become an established testing method in both psychological research and second language acquisition (SLA). It is has been successfully employed in a diverse array of applications and studies, such as measuring children’s oral L1 proficiency (Mehrani, Reference Mehrani2018), investigating which L1 features children may or may not master yet (Devescovi & Caselli, Reference Devescovi and Caselli2007), diagnosing dyslexia (Moll et al., Reference Moll, Hulme, Nag and Snowling2015), or stimulating interaction with children diagnosed with autism (Heimann et al., Reference Heimann, Laberg and Nordøen2006).
EI has not only been used extensively to research children’s L1 development and to assess verbal working memory (VWM) capacity but also in SLA, where researchers have employed it as an indirect measure of adult oral L2 proficiency since the 1950s (e.g., Carroll et al., Reference Carroll, Carton and Wilds1959). During the past decade, interest in EI has spiked again, notably as an indicator of holistic speaking proficiency, implicit language knowledge, and L2 grammar (Gass, Reference Gass, Phakiti, De Costa, Plonsky and Starfield2018).
In spite of the volume of work devoted to EI research, however, studies in this domain have focused almost exclusively on highly educated language learners. Only a few SLA studies have compared the performances of high-literate and low-literate or highly educated and lower educated learners. Making that comparison is the object of this article. Should the two groups perform markedly differently on the same EI test, the universality of the claims regarding the validity and applicability of this method could be questioned.
ELICITED IMITATION IN SLA
In EI, a respondent hears a series of sentences and, after each sentence, repeats the stimulus as accurately as possible. If a prompt exceeds working memory capacity, respondents will not be able to correctly repeat it by relying on rote repetition alone (Graham et al., Reference Graham, McGhee, Millard, Prior, Watanabe and Lee2010). Instead, they will need to decode and reconstruct the prompt to repeat it back correctly (Vinther, Reference Vinther2002; Yan et al., Reference Yan, Maeda, Lv and Ginther2016). The rationale for using EI as a measure of language proficiency relies on the consensus within the field of neuropsychology that working memory cannot hold on to aural information for very long. Thus, if the stimulus exceeds working memory capacity, language ability must kick in to ensure correct repetition.
A dominant neuropsychological theory holds that working memory runs on a number of interdependent systems. The central executive system controls two subordinate systems: the phonological loop and the visuospatial sketchpad (Demoulin & Kolinsky, Reference Demoulin and Kolinsky2016), which respectively store auditory and visual-spatial information for a limited amount of time. Information held in the phonological loop typically decays in a matter of seconds unless it is actively restored (e.g., by repeating an auditory prompt). To date, the neuropsychological community has not reached full consensus regarding the exact relationship of working memory subsystems, but there is little dispute about its basic function: to temporarily store and manage auditory and visual information (Demoulin & Kolinsky, Reference Demoulin and Kolinsky2016). Because a detailed review of the theories surrounding the composition of working memory exceeds the scope of this article (see Demoulin & Kolinsky, Reference Demoulin and Kolinsky2016), henceforth all processes related to the storage and use of auditory information in working memory will be referred to using the more general term “verbal working memory.”
Researchers assume that if EI taps into receptive and productive oral skills it can serve as a reliable indicator of oral language proficiency, L2 grammar, or implicit language knowledge (Gass, Reference Gass, Phakiti, De Costa, Plonsky and Starfield2018). Given the topic of the current article, we focus primarily on the studies of EI as a proxy for oral language proficiency. A recent meta-analysis showed that EI scores allow for reliable differentiation between low- and high-proficiency speakers (Hedges’s g = 1.34, SD = .13; see Yan et al., Reference Yan, Maeda, Lv and Ginther2016), confirming the hypothesis that EI can act as a proxy for general oral language proficiency. Moreover, high reliability indices and medium-to-strong correlation coefficients have consistently been reported across languages such as English (Graham et al., Reference Graham, Lonsdale, Kennington, Johnson, McGhee, Calzolari, Choukri, Maegaard, Mariani, Odijk and Tapias2008: N = 156, α = .96, EI–OPI r = .66; Erlam, Reference Erlam2006, N = 115, KDR20 reliability = .98, EI–IELTS listening r = .72, EI–IELTS speaking and r = .67), French (Gaillard & Tremblay, Reference Gaillard and Tremblay2016: N = 100, EI α = .98, EI-speaking self-assessment R2 = .65; Tracy-Ventura et al., Reference Tracy-Ventura, McManus, Norris, Ortega, Leclercq, Edmonds and Hilton2014: N = 29, EI α = .92, EI-narrative task r = 67), Spanish (Bowden, Reference Bowden2016: N = 27, EI α = .98, EI-SOPI r = .91), Korean (Y. Kim et al., Reference Kim, Tracy-Ventura and Jung2016: N = 66, α = .96, EI-speaking test r = .77), and Chinese (Wu & Ortega, Reference Wu and Ortega2013: N = 80, α = .97, EI and course level differentiation: t (78) = 4.28, p = .000; d = .96).
Four prompt features have been shown to impact EI performance (Gass, Reference Gass, Phakiti, De Costa, Plonsky and Starfield2018; Vinther, Reference Vinther2002 ; Yan et al., Reference Yan, Maeda, Lv and Ginther2016): (a) prompt length, (b) immediate or delayed repetition, (c) prompt grammaticality, and (d) lexical complexity. First, across numerous studies there is consensus that prompt length, as measured by the number of syllables per sentence, is the most robust predictor of EI score variance (Vinther, Reference Vinther2002; Yan et al., Reference Yan, Maeda, Lv and Ginther2016). Kim et al. (Reference Kim, Tracy-Ventura and Jung2016) found that sentence length accounted for 45% of the score variance, and the same trends were found in research by Graham et al. (Reference Graham, McGhee, Millard, Prior, Watanabe and Lee2010: 73% explained EI score variance), and by Wu and Ortega (Reference Wu and Ortega2013: 74% explained EI score variance).
Recent empirical studies have also reported a limited impact of VWM on EI scores (Sarandi, Reference Sarandi2015; Suzuki & DeKeyser, Reference Suzuki and DeKeyser2015), but to further reduce a VWM effect, researchers may introduce a pause between the prompt and the repetition (e.g., Suzuki & DeKeyser, Reference Suzuki and DeKeyser2015). In their meta-analysis, Yan et al. (Reference Yan, Maeda, Lv and Ginther2016) cautiously concluded that delayed repetition did not produce significant moderating effects (p = .58).
A third feature of EI prompts that may impact performance is grammaticality. A number of EI studies have used ungrammatical prompts to measure implicit grammatical knowledge, but the effect of this prompt type is not undisputed (Spada et al., Reference Spada, Shiu and Tomita2015). Erlam (Reference Erlam2006) used a mixture of grammatical and ungrammatical prompts (KR20 = .87), and found that L1 speakers (n = 20) corrected ungrammatical prompts more often than L2 learners (n = 95) at a ratio of 91% to 61%. Sarandi (Reference Sarandi2015), however, found that the correlation coefficients of language test scores and EI scores for grammatical (r = .62, p = .00) and ungrammatical sentences (r = .66, p = .00) do not differ substantially, which reaffirmed Yan et al.’s (Reference Yan, Maeda, Lv and Ginther2016) tentative conclusion that including ungrammatical sentences in EI prompts does not amplify the sensitivity of EI measurements, especially for lower proficiency participants (Yan et al., Reference Yan, Maeda, Lv and Ginther2016).
Lastly, because it is assumed that EI relies on a participant’s ability to comprehend, decode, and reconstruct the stimulus, some studies have quantified the impact of lexical familiarity on score variation. Lexical frequency or the learners’ lexical range typically explain part of the score variance, but less so than sentence length. Graham et al. (Reference Graham, McGhee, Millard, Prior, Watanabe and Lee2010), found that lexical frequency explained 8% of the EI score variance. A study that used X-lex to measure learners’ lexical range (Tracy-Ventura et al., Reference Tracy-Ventura, McManus, Norris, Ortega, Leclercq, Edmonds and Hilton2014) reported a small, nonsignificant (.12) correlation beween lexical range and EI score.
Importantly, the body of work that focuses on EI overwhelmingly relies on university-educated participants. None of the 76 EI studies included in the meta-analysis by Yan et al. (Reference Yan, Maeda, Lv and Ginther2016) focused on a low-educated population. The few SLA studies that do report on EI in low-educated populations typically rely on small sample sizes (e.g., Hansen, Reference Hansen2005), making them unsuitable for generalization. Nevertheless, while these studies (e.g., Tarone et al., Reference Tarone, Hansen, Bigelow, Herschensohn and Young-Scholten2013) indicate that low-educated adult learners are consistently outperformed by higher educated adults, it remains important to note, that the analyses were primarily focused on the impact of literacy on EI. Educational background was not used as a principal grouping variable. However, because literacy and education are closely connected and difficult to disentangle (Perry et al., Reference Perry, Shaw, Ivanyuk and Tham2018; UNESCO, 2017a), the illiterate learners in those studies were also low educated.
More substantial work on the EI performance of nonuniversity educated learners has been conducted in neuropsychology. Again, this research focuses on the impact of literacy on EI performance, and while a low educational background is a robust predictor of low literacy (Vagvoelgyi et al., Reference Vagvoelgyi, Coldea, Dresler, Schrader and Nuerk2016; Windisch, Reference Windisch2015), the connection is not absolute. As such, while the findings of low-literate learners’ EI performance are relevant in the context of the current study, they may not apply to all low-educated learners.
Neuropsychological studies show that alphabetic literacy positively impacts phonemic awareness (Dehaene et al., Reference Dehaene, Pegado, Braga, Ventura, Filho, Jobert and Cohen2010; Petersson et al., Reference Petersson, Reis, Askelöf, Castro-Caldas and Ingvar2000), working memory capacity (Demoulin & Kolinsky, Reference Demoulin and Kolinsky2016; Huettig & Mishra, Reference Huettig and Mishra2014), and processing speed (Bengtsson et al., Reference Bengtsson, Nagy, Skare, Forsman, Forssberg and Ullén2005). Alphabetic literacy promotes the ability to identify and manipulate sublexical phonological units (Dehaene et al., Reference Dehaene, Pegado, Braga, Ventura, Filho, Jobert and Cohen2010; Petersson et al., Reference Petersson, Reis, Askelöf, Castro-Caldas and Ingvar2000), which increases a learner’s capacity to parse and recompose pseudowords (Castro-Caldas et al., Reference Castro-Caldas, Reis and Guerreiro1997; Da Silva et al., Reference Da Silva, Petersson, Faísca, Ingvar and Reis2004) or to repeat phonologically related words (Castro-Caldas et al., Reference Castro-Caldas, Reis and Guerreiro1997; Huettig & Mishra, Reference Huettig and Mishra2014). When words are semantically related, the performance differences between illiterate and literate learners are substantially smaller (Da Silva et al., Reference Da Silva, Petersson, Faísca, Ingvar and Reis2004). The same trends regarding phonological processing and working memory appear to be broadly applicable to functionally illiterate people (Vagvoelgyi et al., Reference Vagvoelgyi, Coldea, Dresler, Schrader and Nuerk2016) but less research has been conducted on this population (Perry et al., Reference Perry, Shaw, Ivanyuk and Tham2018).
To be clear, these neuropsychological findings are not related to L1 or L2 literacy, but to literacy in general. Language learners who have never become fully literate in an alphabetic script will process language differently than learners who have. Neuroimaging has confirmed that literates and illiterates process language in different regions of the brain, using different cortical connections. The differences are consistent, and are most pronounced for pseudowords (Dehaene et al., Reference Dehaene, Pegado, Braga, Ventura, Filho, Jobert and Cohen2010; Petersson et al., Reference Petersson, Reis, Askelöf, Castro-Caldas and Ingvar2000). In SLA these neuropsychological findings have also been described: Kurvers (Reference Kurvers2015) reported that low-literate L2 learners suffered from problems related to phonemic and phonological awareness that have been described in the psychological literature.
Because most of the EI research in SLA is based on higher educated participants and because lower educated participants may engage with EI in a different way the current hypotheses regarding EI in SLA may apply only to a higher educated population, and cannot be generalized to lower educated, L2 learners (Ortega, Reference Ortega2005; Tarone, Reference Tarone2010).
Reduced access to education is not a fringe phenomenon, and it is closely connected to issues of low literacy. According to World Bank data, some 38% of the global population is currently enrolled in tertiary education (World Bank, 2019). At the same time, one fifth of the school-aged population is out of school, and more than half of the children and adolescents do not reach the minimum proficiency goals (UNESCO, 2017b, 2018). Consequently, to ensure that the research consensus concerning EI applies to a wide community of language learners, comparing the results of nontraditional participants with the results of higher educated learners is an important issue on the SLA agenda (Andringa & Godfroid, Reference Andringa and Godfroid2019). The current study contributes to that endeavor.
RESEARCH QUESTIONS
This study examines EI by comparing the performances of highly educated language learners to those of people who do not have the same educational background. It contributes to the discussion on the validity of EI tasks as measures of holistic speaking proficiency by examining the impact of pseudowords on EI performance.
This study is driven by three research questions.
-
RQ1 How do low- and highly educated learners of comparable language proficiency levels perform on the Dutch EI test?
The first RQ focuses on the central matter of differential performance by low- and highly educated language learners. We hypothesized that educational level would positively correlate with EI performance and that highly educated learners would significantly outperform their lower educated peers.
-
RQ2 How does the impact of pseudowords in EI prompts differ among low- and highly educated learners?
RQ2 investigates the impact of pseudowords on the two groups of learners to determine how important comprehension of the prompt is for correct repetition. In concordance with the outcomes of recent neuropsychological research, we predicted that low-educated learners would score significantly lower on the pseudoword items than the highly educated respondents.
-
RQ3 To what extent do the EI scores align with the scores on the speaking test and the Dutch version of the Peabody Picture Vocabulary Test-III (PPVT-III-NL)?
RQ3 considers to what extent EI scores align with a standardized receptive vocabulary test. This link has been examined in previous research (Tracy-Ventura et al., Reference Tracy-Ventura, McManus, Norris, Ortega, Leclercq, Edmonds and Hilton2014; Wu & Ortega, Reference Wu and Ortega2013; Yan et al., Reference Yan, Maeda, Lv and Ginther2016), but the trends have not been very pronounced and the connection between pseudoword EI prompts and receptive vocabulary scores has not been examined. Furthermore, no previous SLA research has compared the link between EI scores and speaking and receptive vocabulary scores in highly educated versus less educated, low-literate populations. Because EI scores typically correlate rather highly with speaking proficiency tests (Yan et al., Reference Yan, Maeda, Lv and Ginther2016), it was anticipated that the EI scores in this study would also align well with the speaking scores. We expected the EI scores to match the receptive vocabulary (PPVT-III-NL) scores less well because studies have shown that lexical frequency (Graham et al., Reference Graham, McGhee, Millard, Prior, Watanabe and Lee2010) or lexical range (Tracy-Ventura et al., Reference Tracy-Ventura, McManus, Norris, Ortega, Leclercq, Edmonds and Hilton2014; Wu & Ortega, Reference Wu and Ortega2013) are not highly robust predictors of EI score variance.
METHOD AND MATERIALS
PARTICIPANTS
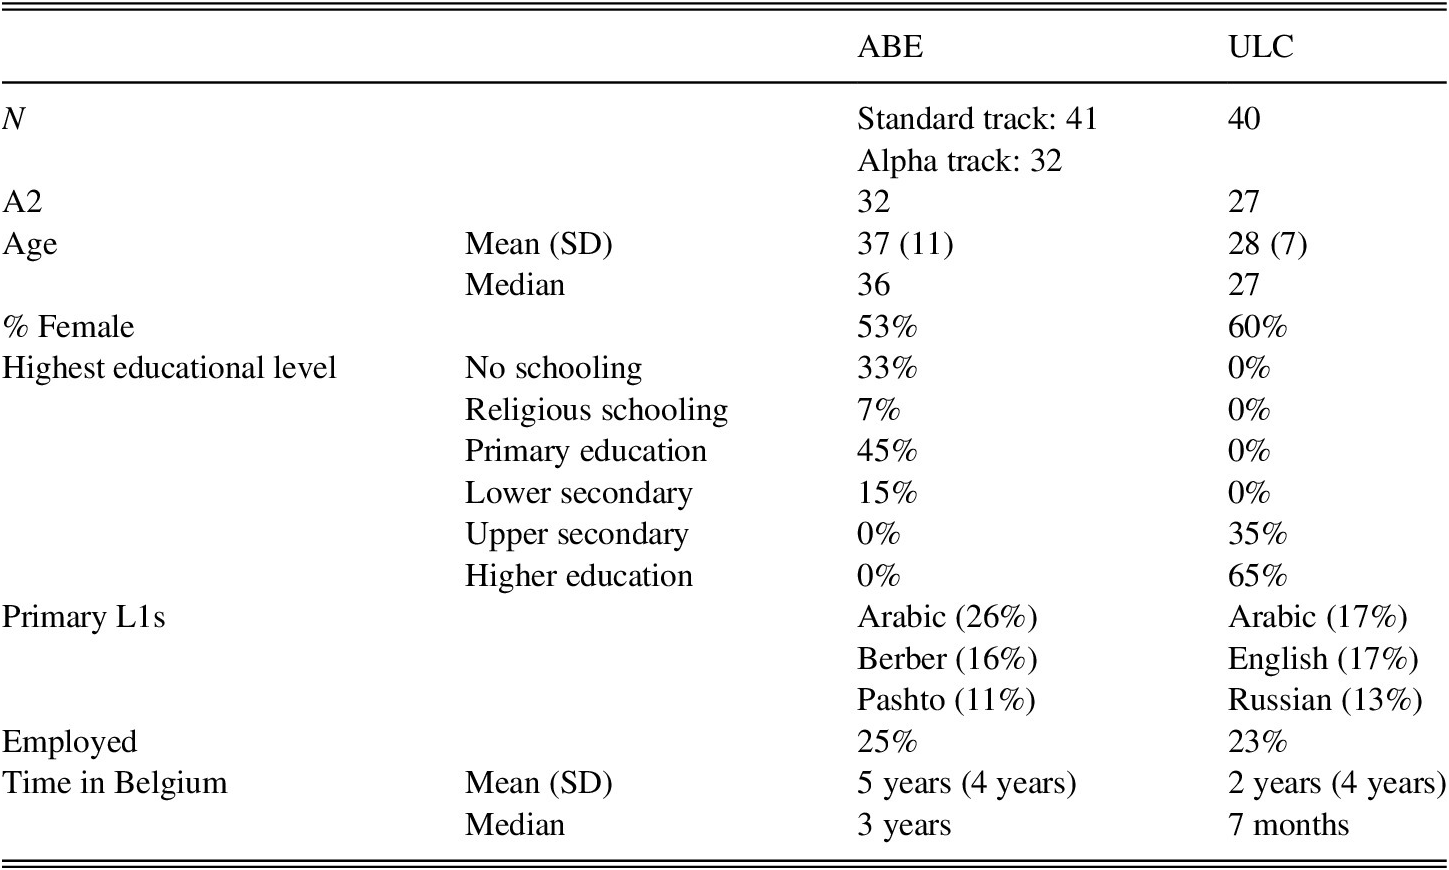
We defined low-educated adult L2 learners as language learners who are enrolled in adult basic education, or ABE (Thompkins & Binder, Reference Thompkins and Binder2003), have spent 9 years or less in organized education (Vagvoelgyi et al., Reference Vagvoelgyi, Coldea, Dresler, Schrader and Nuerk2016), and do not outperform children from primary education on standardized tests (Grosche, Reference Grosche2012). Highly educated learners were defined as L2 learners who are attending university education or have been accepted to enroll at university in the next semester. We recruited 113 learners of Dutch as a second language in Flanders, Belgium. Respondents were randomly selected (every third name on the class list), gave informed consent (verbal consent in the case of illiterate students), and received no remuneration for participation. Prior to the study, Institutional Review Board approval was obtained.
Forty respondents were enrolled at university language centers (ULCs), and 73 respondents were drawn from ABE courses. By definition, all ABE learners are low-literate or functionally illiterate L2 learners who have received limited formal education (private communication with Dr. Drijkoningen, general manager of the Flemish ABEs on 19 September 2019. See also Netwerk Basiseducatie, 2017). Within the ABE group, 32 learners were assigned to the Alpha track, which is designed to meet the needs of learners who are fully illiterate in any language, including their L1. Table 1 shows the key demographic variables of the two groups.
TABLE 1. Demographic variables of respondents within the ABE or ULC group
Because ABE courses in Flanders only go up to the A2 level of the Common European Framework of Reference for Languages (CEFR, Council of Europe, 2001), it was impossible to compare ABE and ULC learners beyond that level. Receptively, the A2 level corresponds with ACTFL “Intermediate Mid” and productively with ACTFL “Intermediate Low” (ACTFL, 2016).
Adult Basic Education
The standard ABE track offers between 480 and 750 hours of language and literacy training, with the purpose of bringing learners up to the A2 level in reading, writing, listening, and speaking. The goal of the Alpha track is to bring learners up to the A2 level in Dutch oral skills in up to 1,200 hours of teaching. All ABE education in Flanders is government funded and free of charge.
Because many people who qualify for ABE come from regions where educational levels may not be equivalent to those in Flanders, educational level alone is not always a reliable indicator of cognitive abilities (Vagvoelgyi et al., Reference Vagvoelgyi, Coldea, Dresler, Schrader and Nuerk2016). For that reason, lower educated learners in Flemish L2 are required to take COVAAR (Magez, Reference Magez2007), a cognitive skills test consisting of verbal and symbolic analogies and figurative series that is a reliable indicator of cognitive abilities (Magez, Reference Magez2007; Verboven et al., Reference Verboven, Buyse, Magez and Verschueren2004). Scores below 22 (out of a total of 48) on this test are associated with an educational background equivalent to or below the attainment targets of Flemish primary education. The low-educated population in this study scored an average of 16 on COVAAR (SD = 10, Med = 10). Five ABE participants scored over 22 but below 30, which is the cutoff score needed to enroll in standard adult L2 education (240 hours to obtain A2).
University Language Centers
People registering for a ULC are not required to take COVAAR because all learners need to show evidence of a university degree or a high school diploma accepted by the Flemish government. Alphabetic literacy is required of all learners and the learning pace is fast: learners are projected to achieve the A2 level in 120 hours of instruction. Because ULC courses are intended for future students at a Dutch-medium university, the average age of ULC students is generally younger than that of ABE students, who have typically spent more time in Flanders before beginning their L2 studies. Hence, ULC participants in the current study were significantly younger (W = 2,263.5, p < .000) than ABE participants and had spent significantly less time in Belgium (W = 1,249.5, p < .000) prior to taking a language course.
MEASUREMENT INSTRUMENTS
Elicited Imitation Test
In line with the recommendations in Yan et al.’s (Reference Yan, Maeda, Lv and Ginther2016) meta-analysis, the EI test contained sentences of increasing syllable length, but avoided ungrammatical prompts and delayed repetition. The test consisted of 39 sentences of varying length within the short (≤8 syllables) and medium (≤16 syllables) bands, ranging from 3 to 15 syllables. After three prompts of the same length, the stimulus increased by one syllable. Thus, the first triad contained three three-syllable prompts, followed by three four-syllable prompts, and so on. All prompts had the same syntactic subject-verb-object structure, and all real words were drawn from the 1.5K frequency band (Keuleers & Brysbaert, Reference Keuleers and Brysbaert2010a) so as to allow for maximal intelligibility among L2 learners with a projected proficiency level of A2 (Milton, Reference Milton and Pallotti2010). Particularly for low-educated, low-literate learners, semantic familiarity has been found to be an important determinant of successful replication in lexical repetition tasks (Huettig & Mishra, Reference Huettig and Mishra2014).
Perhaps the most important difference between this EI and that used in many other SLA studies relates to the inclusion of pseudowords to mimic the impact of unfamiliar lexical items on EI performance. Every third sentence in the EI test contained at least one pseudoword (Juffs, Reference Juffs, Van de Craats, Kurvers and Young-Scholten2006). As sentence length increased, so did the number of pseudowords, but we maintained a proportion of approximately one pseudoword per three words in each prompt (proportion .3–.5). The raw number of pseudowords used in a prompt ranged from one (for prompts up to six syllables) to four (for sentences of 14 and 15 syllables). The pseudowords were generated using the Wuggy pseudoword-generating application (Keuleers & Brysbaert, Reference Keuleers and Brysbaert2010b). Because wordlikeness positively impacts pseudoword recall and because we wanted the pseudowords to resemble real Dutch words, the pseudowords reflected the syllabic structure of actual Dutch words that would fit the context of each prompt (Clark et al., Reference Clark, McRoberts, Van Dyke, Shankweiler and Braze2012). The wordlikeness of the pseudowords was checked by measuring the average Orthographic Levenstein Distance (OLD) between a pseudoword and its 20 most similar real words (Keuleers & Brysbaert, Reference Keuleers and Brysbaert2010b). The overall OLD20 for the pseudowords used in the EI task was 1.55 (SD .18), which indicates a high degree of similarity.
In prompts that contained just one pseudoword, it was modeled on a noun. The second pseudoword to be added was based on a verb, the third on an adverb, and the fourth on a noun again. Items 15 (two pseudowords) and 36 (four pseudowords) are included as examples:

The primary researcher administered all EI tests, following a fixed protocol: “I will now read 39 sentences. Please repeat every sentence exactly as you hear it. The first sentences are short, but they become long. The first three sentences are there to practice. After the third sentence, we begin the actual exercise. Simply repeat every sentence exactly as you hear it.” If the participant did not understand the instructions, they were paraphrased. All prompts were read live, but the tests were audio recorded so they could be independently double rated. Participants first received three short three-syllable trial items that were not scored, followed by 39 scored prompts. The third prompt in the trial contained a pseudoword. Prior to the test, participants were not informed that the test included pseudowords, but after the test this information was disclosed. If candidates did not initiate a repetition within five seconds, the prompt was skipped, and the next prompt was read. An average EI administration took six minutes and three seconds (SD 69 seconds).
The performances were scored by three trained raters, who were students enrolled in the master program of Dutch linguistics. The raters used a 5-band ordinal scale—a rating method that has been shown to correlate highly with a syllable-by-syllable scoring method (Graham et al., Reference Graham, Lonsdale, Kennington, Johnson, McGhee, Calzolari, Choukri, Maegaard, Mariani, Odijk and Tapias2008; r = .92). Some studies have relied on binary scoring (1 for a perfect repetition, 0 for any imperfect repetition), but most EI studies in SLA have used a 5-point scale, with 0 representing an unintelligible or zero response, and 4 a perfect repetition. Table 2 shows the criteria used.
TABLE 2. EI scoring criteria

The same criteria were applied to score pseudoword sentences. Because the phonemic representation of the Dutch orthographic system is quite consistent and transparent, pronunciation flaws were easily detected by the raters, also in pseudowords. Syntactic adjustments also were scored in pseudoword prompts because grammaticality judgments could be made irrespective of the semantic meaning of individual words. When pseudowords were replaced by real words or when phonemes were repeated inaccurately, resulting in a different phonetic quality, raters judged it as a lexical adjustment.
Peabody Picture-Vocabulary test
Prior to taking the EI, all participants took the Dutch version of Peabody Picture Vocabulary Test-III (PPVT-III-NL) as developed by Dunn et al. (Reference Dunn, Dunn and Schlichting2005). The PPVT-III-NL is a standardized receptive vocabulary test that has been validated for both L1 users and L2 learners and has been used in research on a low-literate population (Young-Scholten & Naeb, Reference Young-Scholten, Naeb, Wall and Leong2010). In this test, participants hear a word and point out one of four drawings that best matches the prompt. Figure 1 shows a mockup of a PPVT-III-NL item based on copyright-free illustrations (see Duñabeitia et al., Reference Duñabeitia, Crepaldi, Meyer, New, Pliatsikas, Smolka and Brysbaert2018). Once the candidate has selected a drawing, the test administrator moves on to the next item.

FIGURE 1. Mock-up of PPVT-III-NL prompt
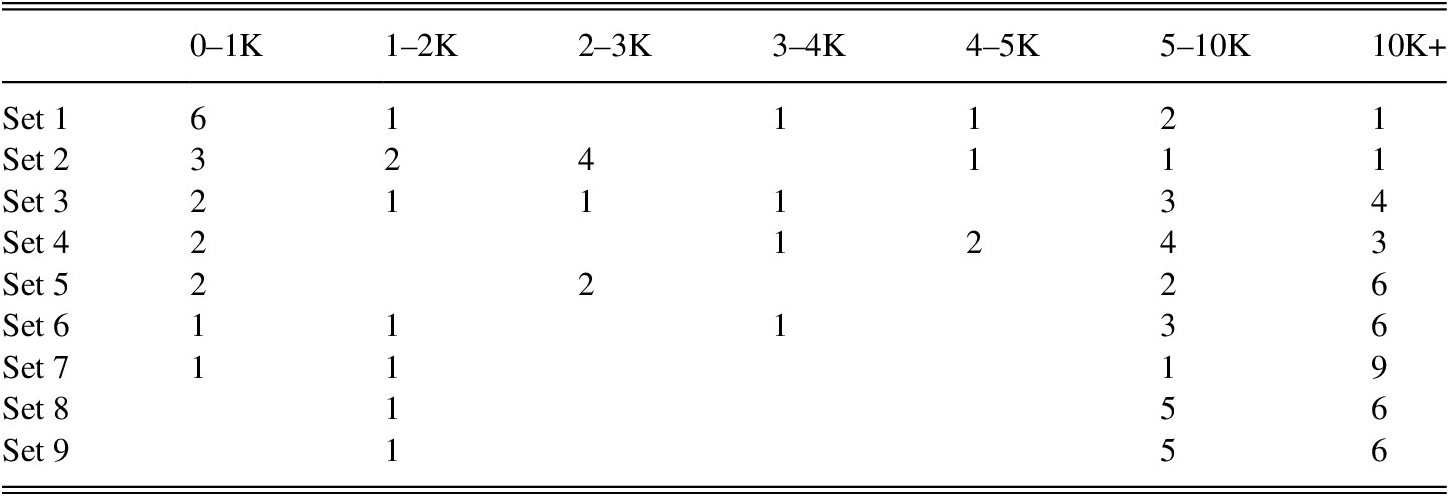
To minimize variation during the PPVT-III-NL test administration, all prompts were played from a recording and repeated once within a 15-second window. The respondents’ answers were registered in real-time. The PPVT-III used in this study was made up of 17 sets that each held 12 items. As the test progressed, the sets included more low-frequency items. In this study, all participants took the first nine sets of the PPVT-III, totaling 108 items from various frequency bands. Table 3 shows the number of items per set within a given frequency band (Keuleers & Brysbaert, Reference Keuleers and Brysbaert2010a).
TABLE 3. Word frequency distribution of PPVT-III-NL sets used
Speaking Test: Civiele Test Nederlands
All participants also took a bespoke version of Civiele Test Nederlands A2 (CTN—Civic Test of Dutch A2), which included four tasks of increasing difficulty: stating personal information, describing motivations to learn Dutch, evaluating living conditions, and describing a series of events based on five drawings.
Taking the CTN is one way for migrants to show that they meet the A2 requirement to gain permanent residency in Flanders. Because it has been demonstrated that low-educated, low-literate learners perform differently than highly educated, literate learners on tests using hypothetical or imagined situations (for an overview, see Carlsen, Reference Carlsen2017), hypothetical prompts were revised to be more concrete. For example, when an original task stated: “At a neighborhood meeting, you describe your house,” the revised task would read, “Could you describe your house?” Apart from stripping the hypothetical layer from tasks, only very minor adaptations were made. Because we did not want the speaking test to be perceived as high stakes, it was important to give it a conversational quality. For that reason, questions that recurred twice were omitted, and the order of certain questions was reversed because it suited the natural flow of a conversation better. Content items (i.e., relevance or correctness of answer) were scored with a binary method, and linguistic criteria (vocabulary, grammar, pronunciation, fluency, and cohesion) were scored on an ordinal 4-point scale, based on the CEFR.
Before use, the modified oral test was piloted on 591 L2 learners of various educational backgrounds, all whom attended A1 and A2 language courses in Flemish centers for basic education or ULCs. The Rasch analysis based on the resulting data indicated that the CTN test is suitable for learners from different educational backgrounds (Mean Infit = .96, SD = .2), although the performance differences between ABE and ULC tracks were significant (χ2 (7) = 283.9, p < .000) and substantial (Separation = 4.82, Strata = 6.76, Reliability = .96).
The CTN speaking test contained 39 items, one of which was removed because it did not fit the Rasch model (Infit ≥ 1.5). The tests were scored by the same trained raters, who did not significantly differ from each other in terms of rating severity (χ2 (1) = 1.9, p = .17).
ANALYSIS
All analyses were conducted using R (R Core Team, 2018) and FACETS (Linacre, Reference Linacre2015). In R, the following packages were used: effsize (Torchiano, Reference Torchiano2017) for effect size calculations; ggplot2 (Wickham, Reference Wickham2016) for data visualization; mlogit (Croissant, Reference Croissant2018) for logistic regression; pwr (Champely, Reference Champely2018) for power analysis; and psych (Revelle, Reference Revelle2018) for general psychometric applications and principal component analysis (PCA).
FACETS was used to run Many-Facet Rasch (MFR) and Differential Item Functioning (DIF) analyses. FACETS allows for direct comparison between item difficulty and test taker ability while compensating for construct-irrelevant factors that could influence the raw score. It also accounts for the impact of test taker ability, task difficulty, rater severity, and criterion difficulty when mapping all these variables onto the same logit scale. Of primary interest in the analysis of FACETS output were item difficulty and candidate ability measures—higher values of which, respectively, denote increased relative difficulty or increased ability—and fit statistics (Infit MnSq). Item difficulty in MFR analysis should be seen as the maximum likelihood estimation of the probability a given person of a given ability level has to have a 50% chance of getting an item right. Candidate ability is the probability that a given person has a 50% chance of getting a given item of a given difficulty level right. While measures express difficulty or ability, fit statistics indicate the extent to which the observed data fit the statistical model. Infit values nearing 1 show that the observed items fit the Rasch model, whereas fit statistics under .50 indicate redundancy, and values above 1.5 indicate misfit (Barkaoui, Reference Barkaoui and Kunnan2014; Linacre, Reference Linacre2012). Omitting misfitting items from further analysis is recommended (Linacre, Reference Linacre2012).
RESULTS
HOW DO LOW- AND HIGHLY EDUCATED LEARNERS OF COMPARABLE LANGUAGE PROFICIENCY LEVELS PERFORM ON THE DUTCH EI TEST?
The ordinal nature of the EI scores combined with the outcomes of a visual and statistical examination of the distributions of EI test scores (Shapiro-Wilk EI: W = .95071, p < .001) showed that the main assumptions for parametric tests were not met. Consequently, Wilcoxon’s rank sum test—a nonparametric test—was used to compare between-group results. The magnitude of the difference was obtained by converting standardized z-sores into effect size estimates. The outcomes of the Wilcoxon Signed Rank Test (Table 4) show significant and substantial differences between the scores of ABE and ULC participants on both the real-word and the pseudoword prompts.
TABLE 4. ABE and ULC scores on EI test: Wilcoxon Signed Rank Test and effect sizes
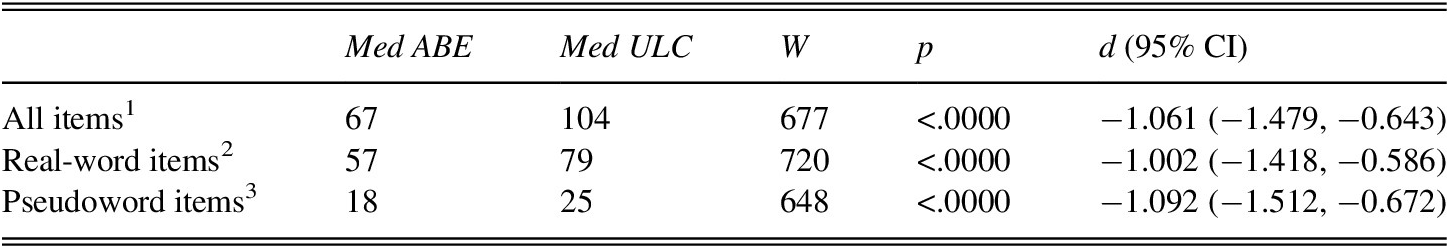
Note: Max score: 1n = 156; 2n = 104; 3n = 52.
The reliability and robustness of the EI test was then examined, followed by an MFR analysis with a focus on the performance of ABE and ULC participants that complemented the previously mentioned inferential nonparametric tests. The EI test showed good model fit (Mean Infit MnSq = 1.04, SD = .31), and differentiated significantly (χ2 (38) = 3,900.4, p < .000) between learners across a wide proficiency spectrum (Separation = 11.43; Strata = 15.57; Reliability = .99). The internal consistency and reliability of the EI test was further analyzed by calculating summability as a measure of internal consistency (Goeman & De Jong, Reference Goeman and De Jong2018) and Cronbach’s alpha as a measure of reliability—both with satisfactory outcomes (summability = .46, α = .966).
To assess rater reliability, one third of the performances were randomly selected for blind double rating. The MFR model did not show any significant differences between the raters (χ2 (2) = .1, p = .94) across different logit bands (Separation .00, Strata .33, reliability 1.00), indicating a high degree of interrater reliability that was further confirmed by a high intraclass correlation coefficient (ICC = .90; CI .81–.91). Because of the double rating some performances received more than one score. In this case, the fair averages from the MFR analysis (based on aggregated scores, adjusted for rater severity) were used.
The MFR results regarding the facet “Educational track” confirmed the outcome of the Wilcoxon Signed Rank test: ABE learners (Meas. (se) = .5(.03); Infit Mnsq = 1.12) performed significantly lower than ULC learners (Meas. (se) = −.5(.02); Infit Mnsq = .93), also when controlling for course level (A1 or A2) and track type. Controlling for these factors was done by compensating for the overall ability estimates associated with specific course levels and tracks in the person ability measures.
The MFR results showed that higher educated learners significantly and substantially outperformed lower educated learners. The MFR model differentiated between ULC and ABE learners across approximately 23 statistically distinct ability levels (Strata = 23.51, Reliability = 1). On item level, the MFR output showed no redundancy, but one item showed misfit: item 1 had an unexpectedly high difficulty level (−1.71). It is possible that some candidates needed more than three practice items, causing them to underperform on the first item. Therefore, item 1 was omitted from further analysis.
As displayed in the left-hand side of Table 5, eight items displayed statistically significant DIF for different L2 tracks, also when compensating for level, gender, and time in Belgium. For items 20 and 36, the ability swing was substantial (≥1 measure); item 20 was comparatively easy for the two groups, but was substantially easier than was predicted by the model for the higher educated group (Measure = −1.53) than for the lower educated participants (Measure = −.52). Item 36 was comparatively more difficult for both groups, but significantly and substantially harder than predicted for the higher educated learners. This does not mean that ABE learners outperformed ULC learners on these items in terms of raw scores. However, relative to the overall ability of each group, these items were easier than predicted for ABE learners and A1 learners. The Wilcoxon Signed Rank Test outcomes were significant for items 33 (p = .014) and 36 (p = .23), and confirm the small differences between ABE and ULC learners on these items (effect size r item 33 = −.23; item 36 = −.11).
TABLE 5. DIF results for educational track and course level

Note: pspseudoword item.
*p < .05; **p < .01; ***p < .001.
Of interest too are items 5, 17, and 23. These items functioned markedly differently for the two groups of learners. Item 5 was marginally more difficult than expected for ABE learners, but much easier than expected for ULC learners, while item 17 showed no unexpected behavior for ULC learners but was easier for ABE learners by a measure of .2. Additionally, item 23 proved easier than predicted for ULC learners, but harder than expected for ABE learners.
The DIF results also indicated that A2 learners significantly outperformed A1 learners on the EI test, even when controlling for educational track, gender, and time in Belgium (χ2 (1) = 228.1, p > .000). The right-hand side of Table 5 displays the four items with significant differences in measure between A1 and A2 participants. At 2.72, the ability swing for item 36 is particularly wide. This item has a very high measure—and consequently a high difficulty level—for both A1 and A2 learners, but it is unexpectedly difficult for A2 learners relative to their overall performance. Items 17 and 22 also proved unexpectedly difficult for A2 learners, yet easier than expected for A1 participants.
The outcomes of DIF analyses also indicated which items showed variation within specific demographic segments that could not be accounted for by the Rasch model. Specific attention was focused on DIF related to course type (ABE or ULC) and course level (A1 or A2). After compensating for over- or underperformance associated with certain demographic traits (e.g., age, time in Belgium, gender) it was found that younger test takers significantly outperformed older ones on the EI test. However, given the fact that the ULC population was significantly younger (t (110) = 5.9145, p < .000) than the ABE population, an interaction effect between age and educational track was assumed. To verify this hypothesis, a binary logistic regression was conducted that confirmed the association (Educational track ~ Age: χ2 (111) = −5.163, p < .000, Nagelkerke R2 = .271). No significant DIF was found for L1 (Indo-European or non-Indo-European L1: (χ 2 (78) 56.5, p = .24) or gender (χ 2 (78) 79.3, p = .44).
In sum, regarding RQ1, the analyses confirm that educational background likely impacts EI performance.
HOW DOES THE IMPACT OF PSEUDOWORDS IN EI PROMPTS DIFFER AMONG LOW- AND HIGHLY EDUCATED LEARNERS?
Figure 2 maps the performance of ABE (Ο) and ULC (Δ) learners on pseudoword items and real-word prompts, and indicates their scores on the CTN speaking test (darker color indicates a lower score). The scatterplot confirms that ULC learners generally outperform ABE learners on the EI test, that learners with a higher score on the speaking test generally perform better on the EI test, and that there is a clear relationship between real-word and pseudoword items (ρ = .81, p < .000).

FIGURE 2. Scatterplot of EI performance by track type and test score.
Next, a logistic regression was run. We modeled the educational program (ABE or ULC) as a function of the scores on pseudoword and real-word prompts while controlling for the participants’ target CEFR level. The logistic regression model based on learner type—ABE or ULC—(Table 6) shows the same trend as the scatterplot in the preceding text: the two types of EI significantly predicted belonging to the ULC group. The odds ratios indicate that a higher score on pseudoword items increases the odds (1.016) of a participant being a ULC learner, and that a higher score on real-word items marginally (1.003) increases those odds as well. In short, ULC learners significantly outperform ABE learners on these two item types, but the effect is larger for pseudoword items.
TABLE 6. Logistic regression (track ~ prompt type)

A logistic regression (Table 7) served to determine the impact of prompt length, pseudoword proportion, and constituent length on item measure as the binary dependent variable. If an item had a difficulty measure over 0 (i.e., more difficult), it was coded as 1, while items that had a measure of 0 or less, were coded as 0. In the FACETS program the mean of the item difficulty measures is set at zero by default (SD = .13).
TABLE 7. Logistic regression (measure ~ sentence length, pseudoword proportion)
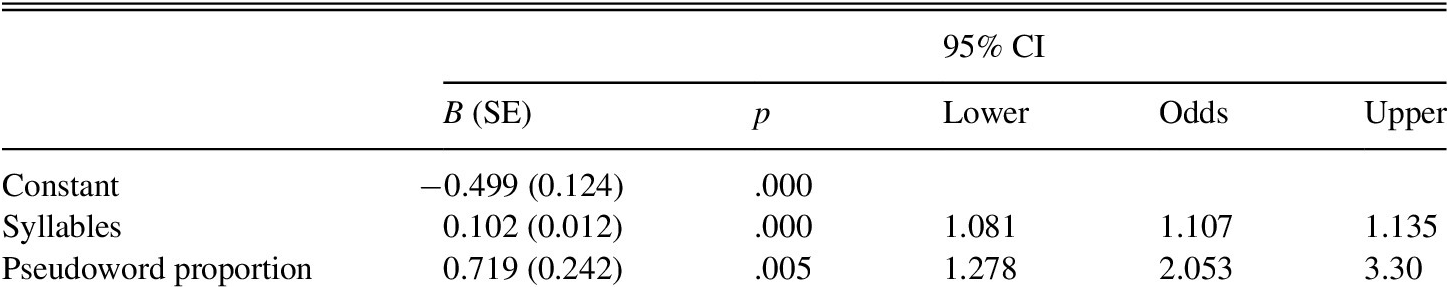
The most robust regression model (Nagelkerke R2 = .714) included number of syllables and proportion of pseudowords as predictive variables. The larger the proportion of pseudowords and the longer the sentences the more likely a prompt is to have a higher measure, by an odds ratio of 2 and 1.1, respectively. In a different logistic regression model based only on real-word prompts, only one significant predictor was found, and that was sentence length as measured by number of syllables (B(SE) = .104(.014), p = .000, 95% CI = 1.08–1.14, Nagelkerke R2 = .64).
To determine whether the pseudoword items measured a different construct than the real-word sentences, the latent variables in the EI test were examined by running a PCA on the standardized z-scores. Following the initial data check, item 36 was omitted because the Kaiser-Meyer-Olkin (KMO) value for that item (.2) was below the .5 threshold. During the second run, all requirements were met: Bartlett’s test of sphericity was satisfactory (χ2 (666) = 4,132.927, p < .000), and the overall KMO (KMO = .923) showed very high sampling adequacy. After the omission of item 36, the KMO values for all individual items were well above the limit (all items >.8). The number of factors to retain was determined by examining the scree plot, and by comparing the eigenvalues of the EI test to the eigenvalues of a randomly generated dataset with an identical structure. Whenever the observed factor in the real PCA had an eigenvalue greater than the same nonexisting factor based on random data, it was retained. After preliminary examination, it was decided that the analysis would be run with three factors using oblique promax rotation because the variables were correlated. The fit based upon off-diagonal values (.99) further confirmed that a three-factor model was sufficient.
The online supplementary material displays the result of the PCA, but also includes the MFR measures and Infit values of each EI item as well as information on the number of syllables and pseudowords. Table 8 summarizes the trends regarding item difficulty, prompt length, and number of pseudowords. Some overlap notwithstanding, the three components represent sequential ranges of item difficulty, prompt length, and proportion of pseudowords. All prompts between three and eight syllables loaded onto component 1. All loadings on component 2 were longer real-word sentences plus one pseudoword sentence—item 33, which exhibited positive DIF for lower educated and less proficient learners (see Table 5). Pseudoword prompts of nine syllables or more loaded onto component 3.
TABLE 8. Summary of PCA, matched with MFR measures

The data show that prompts containing a pseudoword are consistently more difficult than sentences of the same length without any pseudowords, but the difficulty gap increases as sentences become longer and contain a higher proportion of pseudowords (Table 9). Quite possibly, once sentences exceed a certain length, understanding the prompt becomes essential to ensure correct repetition. Taking into consideration the standard error, the differences in item difficulty measures between pseudoword prompts and the most difficult real-word prompt of similar length were small (≤.4 measure), medium (.4–1 measure), or large (≥1 measure). All pseudoword items that loaded onto the first component had small to medium difficulty increases compared to the most difficult real-word item of similar length. Two pseudoword items in component 1 were easier than their real-word equivalent, but not significantly so. Item 33, the only pseudoword item that loaded onto component 2 had a substantially smaller difficulty increase than the pseudoword items that loaded on component 3. Thus, all the items that loaded onto component 3 are long sentences with at least three pseudowords that are more difficult than their real-word counterpart by approximately one measure or more.
TABLE 9. Difficulty gap between pseudoword item and equivalent EI item

Based on these data, it would be safe to assume that longer EI prompts with pseudoword and real-word items measure a different construct. Moreover, pseudoword prompts appear to be the most challenging for lower educated learners.
TO WHAT EXTENT DO THE EI SCORES ALIGN WITH THE SCORES ON THE SPEAKING TEST AND THE PPVT-III-NL?
Real-word EI prompts correlated slightly higher with the receptive vocabulary scores and the speaking test scores than pseudoword prompts, but the overall differences were small (see Table 10). The most substantial gap between correlation coefficients for the two prompt types was for the speaking subscore content criteria. This criterion focuses on being able to communicate information. The correlation with pseudoword prompts is lower than with the with real-word items (real-word items: ρ = .631, p < .001; pseudoword items: ρ = .505, p < .001).
TABLE 10. Spearman correlation: EI test, PPVT-III-NL, speaking test subscores
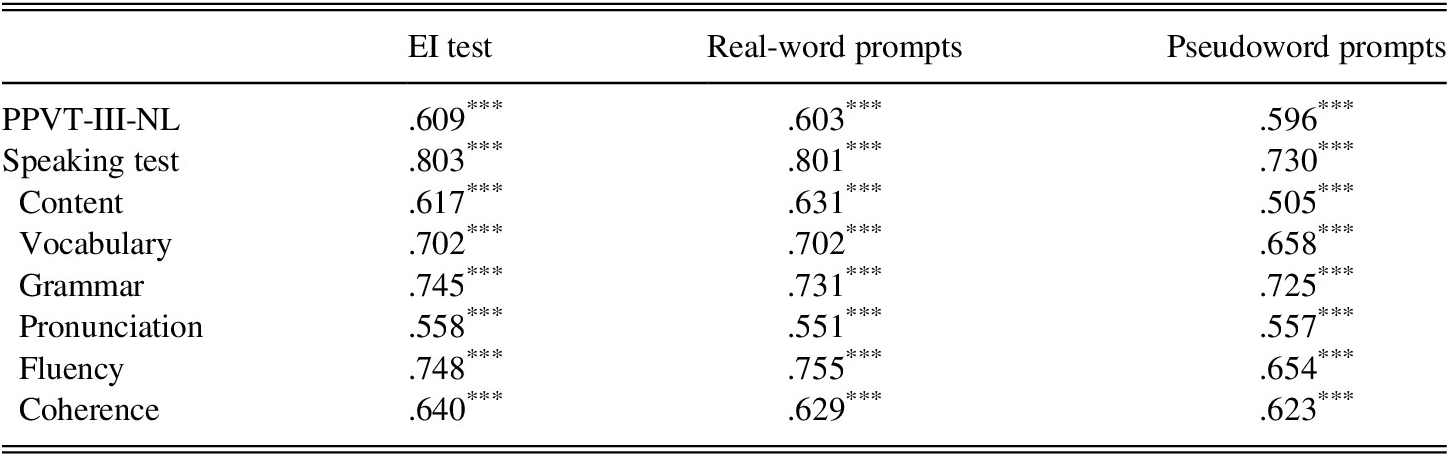
Note: ***p < .001.
In addition, a second MFR model was constructed based on the participants’ scores on the EI, the PPVT-III-NL, and the CTN. Considering the fact that the model combined three different tests, the MFR model indicated good fit (Mean Infit MnSq = .95, SD = .4) and allowed for reliable (.99) discrimination between learners of different ability across four logit bands (χ2 (123) = 2,139.3, p < .000). Four items were removed after the initial analysis due to misfit (two items from PPVT-III-NL and EI item 1) or overfit (one content item from the speaking test).
The MFR results (Table 11) show that the speaking test ranks as the easiest, followed by the PPVT-III-NL and the EI. The differences between the measures of the three tests are significant at p < .000. When excluding the pseudoword items, the difficulty gap decreases by seven strata and the difficulty measure of the EI test is reduced from .61 to .41. Comparing the difficulty measures of different tasks types using Wilcoxon Signed Rank test shows that the pseudoword items overall rank significantly more difficult than the real-word items (W = 226.5, p = .05, r = −.32) and the content criteria of the speaking test (W = 265, p = .01, r = −.41), both exhibiting medium effect sizes. Overall, they were not significantly or substantially more difficult than the linguistic criteria on the CTN (W = 64, p = .74, r = −.07) or the PPVT-III-NL (W = 73, p = .06, r = −.17). The real-word items, however, were significantly easier than the linguistic CTN criteria (W = 53.5, p = .02, r = −.4) and the PPVT-III-NL (W = 141, p = .572, r = −.05). The difference in measure between real-world items and the content scores was marginal and nonsignificant (W = 404, p = .227, r = −.17), possibly explaining why content items correlated higher with real-word prompts than with pseudoword prompts.
TABLE 11. MFR of the three tests
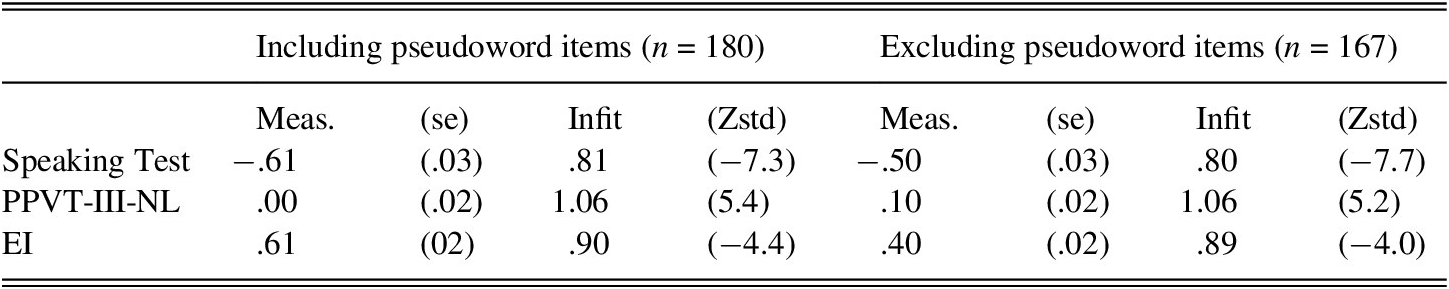
Note: Strata = 26.20, Reliability = 1.00
χ2 (2) = 1,206.1, p < .000 Strata = 19.22, Reliability = 1.00
χ2 (2) = 529.6, p < .000
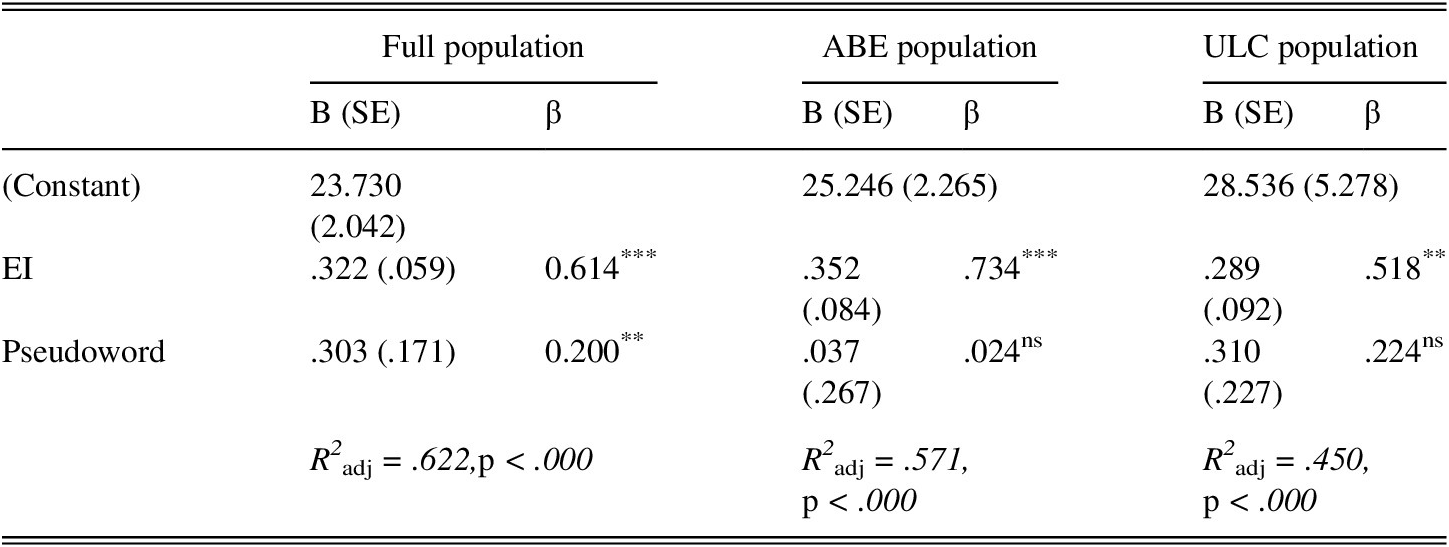
Lastly, to determine whether the EI test can function as an indirect measure of speaking proficiency and receptive vocabulary size, two forced-entry multiple linear regression analyses were conducted considering the speaking test score (Table 12) and the PPVT-III-NL (Table 13) score as a function of the real-word EI and the pseudoword EI scores (Shapiro-Wilk PPVT-III-NL: W = .98241, p = .144; Speaking test: W = .98322, p = .169). A power analysis indicated that running a multiple linear regression on this sample size was warranted and was strong enough to detect small effects (f = .10) at a significance level of .05 and a power of .8. The main assumptions were met: the dependent variables were normally distributed, the number of cases with large residuals was within limits, Cook’s distance was never greater than 1 (PPVT-III-NL ≤ .12; CTN ≤ .104), no individual cases were more than three times the average leverage, the covariance ratio was satisfactory, and the assumptions regarding residual independence (PPVT-III-NL DW = 1.330; Speaking test DW = 1.478) and multicollinearity were not violated. A visual inspection of the residual histogram and scatterplot also indicated a normal distribution, and there were no indications of heteroscedasticity.
TABLE 12. Speaking score ~ EI and pseudoword prompts
Note: **p < .01; ***p < .001; nsnonsignificant.
TABLE 13. PPVT-III-NL score ~ EI and pseudoword prompts

Note: *p < .05; **p < .01; nsnonsignificant.
Table 12 shows that a regression model based on the two prompt types explains 62% of the CTN score variation of the full population (R2adj = .622); both prompt types significantly contributed to the model, but the real-word EI score was the largest and most robust predictor (β = .614). When the same regression analyses on the lower (n = 73) and higher educated (n = 40) subpopulations were conducted independently, the pseudoword prompts no longer significantly contributed to the model for either group, and the ABE model was more robust (R2adj = .571) than the ULC model (R2adj = .450). Both models have adequate power, to detect a medium effect at a significance level of .05 and a power of .8. However, as the assumption of normality was not met due to range restriction, it is hazardous to generalize beyond the sample.
Table 13 shows that the second regression analysis—using the PPVT-III-NL scores as a dependent variable—was less predictive than the first (R2adj = .418). In this model the pseudoword prompt scores offer the most robust contribution (β = .381). When considering the results of the subgroup regression analyses, the previously mentioned caveats regarding generalization apply. At R2adj = .437, the ULC model is considerably stronger than the ABE model.
In conclusion, the regression analyses show that the EI test aligns more with the speaking test than with the test of receptive vocabulary. The real-word items are the most robust contributor to the CTN test, while the pseudoword items contribute most to the PPVT-III-NL regression model.
DISCUSSION AND CONCLUSION
The purpose of this study was to examine how learners of different educational backgrounds perform on the same EI test, what the impact of pseudowords is on EI performance, and how EI scores relate to speaking and receptive vocabulary test scores. This study adds to the literature by further examining the impact of pseudowords on EI repetition, and by including a population that has often been sidelined in SLA research (Ortega, Reference Ortega2005; Tarone, Reference Tarone2010). By comparing the performance of low-educated learners to those of university-educated learners (the traditional research population in SLA), this study helps to establish to what extent current assumptions regarding the applicability and validity of EI tests can be generalized to a wider population of language learners.
The characteristics of the EI test used in the current study align with the results reported in previous research in terms of reliability (α = .966—see also Gaillard & Tremblay, Reference Gaillard and Tremblay2016; Graham et al., Reference Graham, Lonsdale, Kennington, Johnson, McGhee, Calzolari, Choukri, Maegaard, Mariani, Odijk and Tapias2008; Kim et al., Reference Kim, Tracy-Ventura and Jung2016; Yan et al., Reference Yan, Maeda, Lv and Ginther2016), correlation with a speaking test (ρ = .8—see also Bowden, Reference Bowden2016; Graham et al., Reference Graham, Lonsdale, Kennington, Johnson, McGhee, Calzolari, Choukri, Maegaard, Mariani, Odijk and Tapias2008), differentiation between higher and lower proficiency speakers (χ2 (38) = 3,900.4, p < .000—see also Wu & Ortega, Reference Wu and Ortega2013), and rater consistency (ICC = .9—see also Graham et al., Reference Graham, McGhee, Millard, Prior, Watanabe and Lee2010). Also confirming previous studies, the best predictor of item difficulty in real-word prompts was sentence length as measured by number of syllables (Yan et al., Reference Yan, Maeda, Lv and Ginther2016). As confirmed by the MFR analysis, the EI test used in this study was reliable and usable both with highly educated and with less educated participants. It is possible that the EI test used in this study would have yielded even higher reliability indices had the prompts been pre-recorded rather than read out loud to each participant. This mode of administration (i.e., live reading) might have produced some variation on the part of the interviewer.
The first RQ focused on comparing the performance of low- and highly educated learners. The results from the Wilcoxon Signed Rank test and the MFR show that higher educated learners significantly outperformed lower educated learners, also when controlling for track type and CEFR level of the course. The analyses conducted to investigate RQ1 support the hypothesis that educational level likely impacts EI performance. MFR results offered no indications that EI as a test method would be incompatible with low-educated learners (Tammelin-Laine & Martin, Reference Tammelin-Laine and Martin2015), as long as the prompts do not include pseudowords. It remains possible that performance differences between low- and highly educated learners were exacerbated by issues of test wiseness (Carlsen, Reference Carlsen2017) because lower educated learners are not as familiar with testing procedures, which can negatively impact their result (Carlsen, Reference Carlsen2017).
RQ2 examined the impact of including pseudowords in EI prompts on low- and highly educated learners. The DIF data confirmed that low-educated participants perform on par with highly educated learners when the prompt contains concrete or semantically related words, even in relatively long prompts. This finding reflects the neuropsychological consensus on the EI performance of literate versus illiterate learners (Castro-Caldas et al., Reference Castro-Caldas, Reis and Guerreiro1997; Da Silva et al., Reference Da Silva, Petersson, Faísca, Ingvar and Reis2004; Huettig & Mishra, Reference Huettig and Mishra2014). The data also show that a certain proportion of pseudowords may render an item exceedingly challenging for both ABE and ULC learners (e.g., items 33 and 36). This finding supports the hypothesis that beyond a certain length, understanding the prompt becomes essential because VWM alone cannot guarantee successful repetition (Suzuki & DeKeyser, Reference Suzuki and DeKeyser2015). Furthermore, while both lower and higher educated learners were affected by the inclusion of pseudowords, logistic regression showed that pseudoword items were a more robust predictor of track type than real-word items, which can be explained by the fact that performance differences between the two groups were most pronounced for the pseudoword items. Because the prevalence of low literacy among the ABE population is very high (Netwerk Basiseducatie, 2017), this finding offers further support to the hypothesis that an increased literacy level increases the ability to parse and process purely phonological information (Castro-Caldas et al., Reference Castro-Caldas, Reis and Guerreiro1997; Da Silva et al., Reference Da Silva, Petersson, Faísca, Ingvar and Reis2004). Phonological ability in addition to a comparatively stronger VWM capacity likely caused higher educated learners to outperform lower educated learners on pseudoword items.
While educational level and literacy are not directly connected by default, it is clear that the prevalence of illiteracy and functional illiteracy is higher among low-educated learners. Moreover, because all language learners in the Flemish ABE track are functionally or fully illiterate in an alphabetic script (Netwerk Basiseducatie, 2017), literacy issues likely impacted the results.
Additionally, the PCA showed that any pseudoword sentence was more difficult than any real-word sentence of the same length. For shorter prompts, the inclusion of up to two pseudowords did not seem to have a substantial impact on difficulty measures. In prompts under six syllables, differences in item difficulty remained insignificant, and all pseudoword items up to eight syllables loaded onto the same component as real-word sentences of the same length. The VWM likely ensured successful repetition of these short stimuli (Demoulin & Kolinsky, Reference Demoulin and Kolinsky2016), and comprehension of the prompt was less important to ensure successful repetition. However, in sentences of nine syllables or more, understanding the prompts appeared to become more important for successful repetition. This was the case for both groups of participants, but the impact of pseudowords was more pronounced for lower educated learners. Importantly, these longer pseudoword prompts loaded onto a separate PCA component.
The results of RQ2 indicate that for beginning L2 learners rote repetition is quite possible up to eight syllables, but successful repetition of longer items may warrant an understanding the meaning of the stimulus. Because repeating phonological rather than semantic units is more difficult for learners with lower alphabetic literacy (Huettig & Mishra, Reference Huettig and Mishra2014), the more highly educated learners outperformed lower educated learners by a more pronounced degree on the pseudoword items than on the real-word items. Again, issues of test-wiseness may have exacerbated these results (Carlsen, Reference Carlsen2017). It is possible that low-educated learners were less prepared for the practice of repeating real-word or pseudowords prompts, which could have impacted their performance and could have added to the literacy-related issues described in the preceding text.
RQ3 examined to what extent EI scores align with the scores on a standardized speaking test and on the PPVT-III-NL. An MFR analysis based on the three tests showed that the EI test—both including and excluding pseudoword items—is significantly and substantially more difficult than the other two tests. The speaking test correlated better with the real-word items (ρ = .8) than with the pseudoword items (ρ = .7), quite possibly because the comparatively difficult pseudoword items did not correlate highly with the comparatively easy content criteria on the speaking test. The linear regression analysis of the speaking scores as a function of real-word and pseudoword prompts allowed for a more fine-grained picture of the links between the constructs of the two tests. The EI test scores accounted for 66% of the CTN score variation and the pseudoword items (β = .2) contributed substantially less to the model than the real-word items (β = .614), implying that pseudoword items likely tap into a different skill than real-word items. Quite possibly, pseudoword repetition relies primarily on the manipulation of phonological units and on VWM capacity, whereas real-word repetition depends on understanding and conveying semantic meaning (Petersson et al., Reference Petersson, Reis, Askelöf, Castro-Caldas and Ingvar2000). Determining whether candidates can convey semantic meaning in the form of concrete and personally relevant information is also the goal of the A2 speaking test. As such, it is not illogical that real-word items are more robust predictors of speaking scores than pseudoword prompts.
The regression model that considered the PPVT-III-NL scores as a function of real-word and pseudoword EI prompts explains 42% of the total score variance. Interestingly, pseudoword items contributed more to the model than real-word items, and the model is markedly more predictive for the higher educated group (R2adj = .44, vs .23) than for low-educated learners. These learners typically face difficulties when repeating pseudowords and meaningless phonological units (Dehaene et al., Reference Dehaene, Pegado, Braga, Ventura, Filho, Jobert and Cohen2010; Petersson et al., Reference Petersson, Reis, Askelöf, Castro-Caldas and Ingvar2000). As such, pseudoword items did not significantly or substantially contribute to the regression model for ABE learners alone. In the regression model for higher educated learners (who typically possess the skills to manipulate unknown words and sublexical phonological units), the pseudoword items were found to be the most predictive variables.
In conclusion, this study shows that EI can be used among low- and highly educated language learners of different proficiency levels and with wide-ranging levels of literacy. It is important to consider, however, that due to differences in VWM and phonological processing, low-educated learners are likely to be outperformed by highly educated learners of a comparable oral proficiency level. The data presented in this study show that pseudowords disproportionately affect low-educated learners. This finding, combined with the results of the regression analyses indicate that, if EI is used as a proxy for holistic speaking proficiency, using pseudoword prompts is unlikely to enhance the validity of the measurement. Thus, when administering the same EI to both highly educated learners and low-educated learners, it is important to use concrete prompts containing familiar words. In sum, the findings presented in this article suggest that understanding EI prompts facilitates the performance of both highly and low-educated groups—a necessary condition for a convincing argument about EI validity. However, the greater debilitation of the performance of lower educated subjects highlights the contribution of semantic and lexical familiarity (real-word or pseudoword prompts) to EI performance. A necessary qualifier to this claim is that the impact of semantic and lexical familiarity was measured by including pseudowords instead of actual unfamiliar words, as is accepted practice in psycholinguistics (Massol et al., Reference Massol, Midgley, Holcomb and Grainger2011). The motivation for this was that pseudowords are by definition unknown to all participants, irrespective of their background (Keuleers & Brysbaert, Reference Keuleers and Brysbaert2010b). While it has been observed that pronounceable pseudowords exhibit similar recall qualities as very rare real-word items (Ozubko & Joordens, Reference Ozubko and Joordens2011), it is possible that EI repetition of unknown lexical items that may yet carry meaning associations differs from the repetition of pseudowords.
Supplementary Materials
To view supplementary material for this article, please visit http://dx.doi.org/10.1017/S027226312000008X.


