


Numerous Emotional Intelligence (EI) concepts have been developed since 1990, when Salovey and Mayer published their seminal work and Goleman published his bestseller (1995). Since then, various theoretical approaches have attempted to explain EI and have been placed into two general categories, ability and mixed models. The ability model defines EI as the ability to perceive and express emotion, assimilate emotion in thought, understand and reason with emotion, and regulate emotion in the self and others (Mayer & Salovey, Reference Mayer, Salovey, Salovey and Sluyter1997). Ability measures are based on emotional information processing and imply the use of performance-based scales, which include emotional items that have correct and incorrect answers to examine emotional abilities (Mayer & Salovey, Reference Mayer, Salovey, Salovey and Sluyter1997). The main instruments to examine the ability model have originated from Salovey and Mayer’s (Reference Salovey and Mayer1990) research. In keeping with their theoretical underpinnings, these instruments assess relevant aspects of individuals’ perceptions of their emotional competencies (e.g., Mayer Salovey Caruso Emotional Intelligence Test, MSCEIT; Mayer & Salovey, Reference Mayer, Salovey, Salovey and Sluyter1997; Trait Meta-Mood Scale, TMMS; Salovey, Mayer, Goldman, Turvey, & Palfai, Reference Salovey, Mayer, Goldman, Turvey, Palfai and Pennebaker1995).
In the mixed model, EI consists of a set of stable personality traits, socio-emotional competencies, motivational aspects, and cognitive skills (Bar-On, Reference Bar-On, Bar-On and Parker2000), evaluated using self-report measures, such as the Emotional Quotient Inventory (EQ-i) or the Trait Emotional Intelligence Questionnaire (TEIQue). Correlations between measures of trait EI and ability EI are invariably low, thereby supporting the explicit distinction between them (Brannick et al., Reference Brannick, Wahi, Arce, Johnson, Nazian and Goldin2009).
It is now generally acknowledged that trait EI and ability EI should be regarded as distinct (Saklofske, Austin, & Minski, Reference Saklofske, Austin and Minski2003). Their literatures are developing independently, and it is accepted that the operationalization of one does not have implications for the operationalization of the other.
For the mixed model, Bar-On (Reference Bar-On, Bar-On and Parker2000) defines Emotional-Social Intelligence (ESI) as an interrelated set of competencies, emotional and social skills, and emotional facilitators that determine how effectively we understand and express ourselves, how we understand others and relate to them, and how we face everyday demands. This model combines cognitive abilities derived from EI defined as a skill, with emotional dispositions derived from EI defined as a trait.
For the evaluation of the EI, Bar-On (Reference Bar-On1997) developed the Emotional Quotient Inventory (EQ-i). This instrument measures ESI for individuals older than 17 years old. It consists of 133 items that result in 15 subscales. From these, 10 are considered basic skills (emotional self-awareness, self-regard, assertiveness, empathy, interpersonal relationships, stress tolerance, impulse control, validation, flexibility, and problem solving); and five are considered as enablers of ESI (optimism, self-fulfillment, joy, emotional independence, and social responsibility). These 15 subscales are organized in the EQ-i in five large dimensions or scales: (1) intrapersonal, which is the ability to understand one’s own emotions and one’s communication to others; (2) interpersonal, which is the ability to understand and appreciate the emotions of others; (3) managing of emotions, which is the ability to direct and control one’s emotions; (4) adaptability, which is the flexibility and efficiency to resolve conflicts; and (5) general mood scale, which is the ability to have a positive attitude towards life.
Studies that have analyzed the psychometric properties of the questionnaire have shown adequate reliability (Bar-On, Reference Bar-On and Geher2004; Matthews, Roberts, & Zeidner, Reference Matthews, Roberts and Zeidner2004). However, the five-factor theoretical structure has yielded contradictory findings, as some refer to the unidimensionality of the scale (Dawda & Hart, Reference Dawda and Hart2000; Palmer, Manocha, Gignac, & Stough, Reference Palmer, Manocha, Gignac and Stough2003), while others point to its multidimensionality (Austin, Saklofske, & Egan, Reference Austin, Saklofske and Egan2005; Bar-On, Reference Bar-On1997). The EQ-i has a short version of 35 items that has been analyzed in several studies with youth populations (López-Zafra, Pulido, & Berrios, Reference López-Zafra, Pulido and Berrios2014; Parker, Keefer, & Wood, Reference Parker, Keefer and Wood2011).
In addition, Bar-On and Parker (Reference Bar-On, Parker, Caraballo and Villegas2000) developed the Emotional Quotient Inventory: Youth Version (EQ-i: YV), consisting of 60 items, for children and adolescents between the ages of 6 and 17 years old. Studies that have looked at this version of the instrument for children and adolescents have demonstrated adequate psychometric properties, replicating the factor structure proposed by the authors in samples of different nationalities including the US (Parker et al., Reference Parker, Saklofske, Shaughnessy, Huang, Wood and Eastabrook2005), Lebanon (Hassam & Sader, Reference Hassan and Sader2005), Peru (Ugarriza & Pajares, Reference Ugarriza and Pajares2005), and Spain (Ferrándiz, Hernández, Bermejo, Ferrando, & Sainz, Reference Ferrándiz, Hernández, Bermejo, Ferrando and Sáinz2012). Parker et al. (Reference Parker, Saklofske, Shaughnessy, Huang, Wood and Eastabrook2005) tested the factor structure of the EQ-i: YV in two samples (aboriginal and non-aboriginal Canadians) using confirmatory factor analysis (CFA), finding that in both samples the data had adequate fit to the model. Meanwhile, Hassam and Sader (Reference Hassan and Sader2005) found that the reliability, both internal and over time, were moderate to high across all age groups except for the stress management scale, ranging from .51 to .80. Although exploring scale factorial validity using exploratory factor analysis (EFA) by performing a principal components analysis with Varimax rotation identified two major factors, the results of the item factor analysis generally supported the factors that the Bar-On EQ-i:YV was designed to measure, factors representing the subcomponents of the scales’ four dimensions. Ugarriza and Pajares (Reference Ugarriza and Pajares2005) confirmed the factorial structure by exploratory factor analysis, the internal consistency (although some indices were low), and divergent validity. Finally, Ferrándiz et al. (Reference Ferrándiz, Hernández, Bermejo, Ferrando and Sáinz2012) with a Spanish sample demonstrated the instrument’s reliability (ranging from .63 intrapersonal to .80 general mood) and validity of the factor structure of the questionnaire through exploratory factor analysis.
Nevertheless, it is necessary to have brief instruments in case there are time limitations and/or signs of fatigue of the participants, or diverse questionnaires are administered. In this sense, Bar-On and Parker (Reference Bar-On, Parker, Caraballo and Villegas2000) developed the Bar-On Emotional Quotient Inventory: Youth Version Short (EQ-i: YV), a shortened version of the questionnaire for children and adolescents, consisting of 30 items with good internal consistency indices ranging from .77 to .88. This short version has also been validated in Peru (Ugarriza & Pajares, Reference Ugarriza and Pajares2005) and Hungary (Kun et al., Reference Kun, Urbán, Paksi, Csóbor, Oláh and Demetrovics2012) where the factor structure was confirmed.
Since emotional intelligence is defined as a set of interpersonally- and intrapersonally-related human abilities, it should have the ability to predict various personal and social outcomes. A high EI is associated with positive indicators of well-being (Bar-On, Reference Bar-On2005) and psychological adjustment, as greater self-esteem or self-concept in preadolescents (Ferrando et al., Reference Ferrando, Prieto, Almeida, Ferrándiz, Bermejo, López-Pina and Fernández2011), adolescents (Ciarrochi, Chan, & Bajgar, Reference Ciarrochi, Chan and Bajgar2001; Rey, Extremera, & Pena, Reference Rey, Extremera and Pena2011), and undergraduates (Ciarrochi, Chan, & Caputi, Reference Ciarrochi, Chan and Caputi2000; Kong, Zhao, & You, Reference Kong, Zhao and You2012; Salvador, Reference Salvador2012). In a Spanish sample with EQ-i: YV, Ferrándiz et al. (Reference Ferrándiz, Hernández, Bermejo, Ferrando and Sáinz2012) found that emotional-social intelligence (r = .26), intrapersonal (r = .25), and stress management (r = .29) were significantly correlated with general self-concept.
Emotional intelligence is a good predictor of general self-concept in undergraduates (Kong et al., Reference Kong, Zhao and You2012; Runcan & Iovu, Reference Runcan and Iovu2013) with emotional repair and clarity being consistently significant predictors of self-concept (Augusto, López-Zafra, Aguilar-Luzón, & Salguero de Ugarte, Reference Augusto-Landa, López-Zafra, Aguilar-Luzón and Salguero de Ugarte2009; Salvador, Reference Salvador2012; the latter study additionally finding attention to be significant). These studies linking emotional intelligence with self-concept have used the Trait Meta-Mood Scale (TMMS; Salovey et al., Reference Salovey, Mayer, Goldman, Turvey, Palfai and Pennebaker1995) or the Wong Law Emotional Intelligence Scale (Wong & Law, Reference Wong and Law2002). They suggest that, if the Bar-On is a valid instrument, it should predict general self-concept. However, this hypothesis has yet to be tested.
To sum up, this study was designed to explore new sources of validity evidence drawn from the scores on the EQ-i: YV-S in a sample of Spanish adolescents, taking into account the lack of this evidence since this version has not been validated with Spanish samples. The process of validation involves accumulating evidence to provide sound scientific evidence for the proposed test score interpretations. Specifically, the purposes of this study were: (1) to analyze further reliability evidence of scores on the EQ-i: YV-S based on internal consistency coefficients; (2) to extend validity evidence based on internal structure of scores on the EQ-i: YV-S using EFA and CFA in the framework of a structural equation modeling approach; and (3) to extend convergent and predictive validity evidence based on the relationships of scores on the EQ-i: YV-S with general self-concept.
Method
Participants
This study involved 508 Spanish adolescents, 241 males (47.4%) and 267 females (52.6%), from two public and one private schools (Grades 7 to 12) between 11 and 19 years old, each of whom completed the questionnaires twice, in the beginning (M age = 14.99, SD = 1.81) and at the end of the school year (M age = 15.64, SD = 1.80).
Measures
The Emotional Quotient Inventory for Youth, Short Version (EQ-i: YV-S) (Bar-On & Parker, Reference Bar-On, Parker, Caraballo and Villegas2000; translated to Spanish by Caraballo & Villegas, 2001) is a self-report measure designed to measure EI of children and adolescents between the ages of 7 and 18 years. It consists of 30 items measuring the dimensions of interpersonal, intrapersonal, stress management, and adaptability; with the sum of these dimensions, a score of overall emotional intelligence can be obtained. The instrument also has a fifth subscale, positive impression, created to measure how much the subjects respond randomly or distort their responses in terms of social desirability. However, as in several previous studies (Hassam & Sader, Reference Hassan and Sader2005; Parker et al., Reference Parker, Saklofske, Shaughnessy, Huang, Wood and Eastabrook2005; Ugarriza & Pajares, Reference Ugarriza and Pajares2005), this fifth subscale (items 3, 7, 11, 15, 20, and 25) is not further analyzed in the present study. The questionnaire is answered on a Likert scale with four response options going from “not true in my case” to “very true in my case.”
The Self-Description Questionnaire II-S (SDQII-S; Ellis, Marsh, & Richards, Reference Ellis, Marsh and Richards2002; translated into Spanish by Inglés et al., Reference Inglés, Torregrosa, Hidalgo, Nuñez, Castejón, García-Fernández and Valle2012) is a reduced self-report measure (51 items) from the original version designed to assess self-concept in adolescents from age 12 to 18 years. It consists of the same 11 scales as the original (although this article only shows the results of the general self-concept scale), and six response options, where 1 = false and 6 = true. In this study, the reliability indices for general self-concept were acceptable (α = .81, CR = .81, and McDonald omega = .81).
Procedure
Ethical permission to conduct the study was obtained from the Committee on Ethics of Research and Teaching (CEID) of the Universidad del País Vasco/Euskal Herriko Unibertsitatea (Spain). Then the schools’ participation in the study was requested verbally (phone) and in writing (letter). After obtaining the schools’ authorization, a letter of consent to participate in the study (in the case of minors) was sent to all families. Subsequently, the battery of questionnaires was administered (only to the participants who brought parental permission) within school hours. Pupils answered the questionnaires individually in the classroom in the presence of the first author of this article. During the process, anonymity of the responses and voluntary participation were ensured. Data were collected twice; the first stage of data collection was conducted in September/October 2013 (Time 1), which was the beginning of the school year; and the second one was carried out in May/June 2014 (Time 2), the end of the school year.
Data Analyses
Five different analyses were conducted to evaluate reliability and validity evidence:
-
(a) The test reliability was obtained using three indices: Cronbach’s alpha (α), the composite reliability (CR), and McDonald’s Omega, which is a coefficient of internal consistency less biased than Cronbach’s alpha for categorical response scales.
-
(b) Parallel analysis (PA) was applied to conduct Exploratory Factor Analysis (EFA). FACTOR program (Lorenzo-Seva & Ferrando, Reference Lorenzo-Seva and Ferrando2006), a free program specific for EFA with flexible options, was used. It has a powerful variation of PA using Minimum Rank Factor Analysis (MRFA) with polychoric correlations available. Several researchers (e.g., Timmerman & Lorenzo-Seva, Reference Timmerman and Lorenzo-Seva2011) recommend the use of polychoric correlation matrices when analyzing categorical variables and/or when items have four or less response categories (Finney & Di Stefano, Reference Finney, DiStefano, Hancock and Mueller2006). PA based on MRFA (Timmerman & Lorenzo-Seva, Reference Timmerman and Lorenzo-Seva2011) is a commonly recommended method for factor retention and has been found to be superior to conventional methods for correctly identifying the true number of dimensions. There are two criteria that FACTOR applies to make decisions for how many factors to retain. One method is based on the mean random variance extracted, and the other on the 95th percentile of random percentage of variance. Simulation studies suggest that the 95th percentile criterion is more accurate (Timmerman & Lorenzo-Seva, Reference Timmerman and Lorenzo-Seva2011). After deciding the number of factors to retain and the extraction method, one must make decisions about the rotation method to use. Considering that, in the Social and Health Science settings, the habitual tendency is for factors to correlate with each other, oblique rotation, which allows relationships between factors, should be preferred in most situations, unless a strong argument can be made as to why the factors should not be correlated. The first sample collected in Time 1 was used to conduct the EFA.
-
(c) As multivariate distribution of data was non-normal, Confirmatory Factor Analyses (CFA) with EQS6 multivariate software (Bentler, Reference Bentler2005). EQS6 was used based on the Satorra-Bentler scaled chi-square statistic (S-Bχ 2 ) rather than the usual MLχ 2 statistic as it serves as a correction for χ2 when distributional assumptions are violated. In testing three models, evaluation of goodness-of-fit to the sample data was determined on the basis of multiple criteria: The Comparative Fit Index (CFI), the Root Mean-Square Error of Approximation (RMSEA), and the Standarized Root Mean Square Residual (SRMR). The CFI is based on the S-Bχ 2 statistic; it ranges in value from 0 to 1.00. Although Hu and Bentler (Reference Hu and Bentler1999) suggest a value of .95 to be indicative of good fit, others argue that this value is too restrictive, particularly for multifactor rating scales for which analyses are conducted at the item level (Marsh, Hau, & Wen, Reference Marsh, Hau and Wen2004), with values > .90 indicative of a reasonably good fit. The RMSA takes into account the error of approximation in the population; values less than .05 indicate good fit and less than .08 reasonably good fit. To complement these measures, the 90% confidence interval for RMSEA is provided. Finally, the SRMR is the average standardized residual value derived from fitting the hypothesized variance covariance matrix to that of the sample data. Its values range from 0 to 1.00, with a value less than .08 being indicative of a well-fitting model (Hu & Bentler, Reference Hu and Bentler1999). The second sample collected at Time 2 was used to conduct the CFA;
-
(d) Convergent validity (referring to the degree to which two measures of constructs that theoretically should be related, are in fact related) is a basic requirement for the validity of any psychological test and can be estimated using correlation coefficients. To establish convergent validity, correlations between EQ-i: YV-S with general self-concept were conducted using SPSS 21 for Windows.
-
(e) Finally, to further clarify the predictive validity of EQ-i: YV-S in general self-concept, structural equation modeling was performed using EQS6.
Results
Reliability
First, the reliability coefficients for the EQ-i: YV-S were conducted with the following results: interpersonal (α = .67, CR = .69, and McDonald Omega = .68); intrapersonal (α = .83, CR = .86, and McDonald Omega = .86); stress management (α = .83, CR = .86, and McDonald Omega = .85; adaptability (α = .82, CR = .85, and McDonald Omega = .85); and total questionnaire (α = .79, CR = .95, and McDonald Omega = .94).
Exploratory Factor Analysis (EFA)
In the following, EFA results are shown. A statistically significant Bartlett’s test = 5077.0 (df = 276), p < .001, and a Kaiser-Meyer-Olkin (KMO) statistic (.81) above the suggested .80 cut-point indicates the suitability of the data for factor analysis, satisfying evidence of substantial correlations between items.
In the first step, if a factor’s observed percentage exceeds the random percentage 95th percentile, the factor is retained, which occurred four times in our case. Once the PA has advised the number of dimensions supported by the data, the next step is to extract the number of advised dimensions and select a rotation option to aid in factor interpretation. We selected the Minimum Average Partial (MAP), the MRFA option of extraction, and oblique rotation and set the number of advised dimensions to four. Results are summarized in Table 1.
Table 1. Factor structure of EQ-i: YV-S through parallel analysis
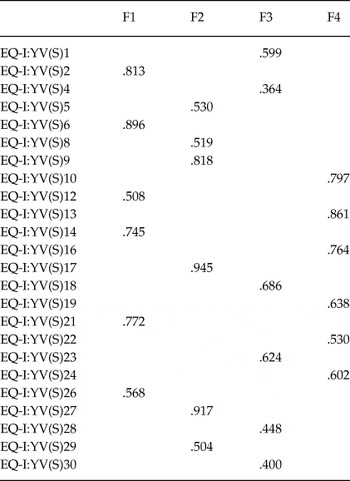
Note: F1 = Intrapersonal; F2 = Stress management; F3 = Interpersonal; F4 = Adaptability.
For the four factors model, the overall percentage of common variance explained was 74% and all the items load onto their theoretical dimension and were above the minimum of .32.
Confirmatory Factor Analysis (CFA)
To scrutinize the data for evidence of normality, items’ statistical descriptives showed that, although skewness and kurtosis were less than ± 2 being indicative of univariate normality, Mardia’s coefficient of 65.4919 (Z-statistic of 20.8921) is highly suggestive of multivariate non-normality, taking into account Bentler’s (Reference Bentler2005) view that values should be > 5.00.
Bearing in mind the multivariate non-normality of the data and following Finney and DiStefano (Reference Finney, DiStefano, Hancock and Mueller2006), analyses of Confirmatory Factor Analysis were conducted using robust ML estimation, based on the Satorra-Bentler scaled chi-square statistics (S-Bχ2). Three models were tested: (1) a one-factor model (unidimensional), which assumes that EQ-i: YV-S is composed by one global factor (emotional-social intelligence); (2) a four first-order factors model (multidimensional), with the four principal factors of the questionnaire: interpersonal, intrapersonal, stress management, and adaptability; and (3) a second-order model (hierarchical) proposed by Bar-On and Parker (Reference Bar-On, Parker, Caraballo and Villegas2000), composed of four first-order factors (interpersonal, intrapersonal, stress management, and adaptability) and one second-order factor (emotional-social intelligence). Results are shown in Table 2.
Table 2. Models’ fit of confirmatory factor analyses
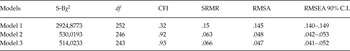
Note: S-Bχ2 = Satorra-Bentler scaled chi-square; df = degrees of freedom; CFI = Comparative Fit Index; SRMR = Standarized Root Mean Square Residual; RMSA = Root Mean-Square Error of Approximation; CI = 90% confidence interval; Model 1 = unidimensional; Model 2: multidimensional; Model 3: Hierarchical.
As seen by the results summarized in Table 2, Model 1 fits the data poorly. In contrast, Model 2 provides a reasonably good fit to the data. Model 3, the second-order factor model proposed Bar-On and Parker (Reference Bar-On, Parker, Caraballo and Villegas2000), provides the best fit to the data, with a S-Bχ 2 / df = 2.11, CFI value of .93, SRMR value of .066 and an RMSEA value of .047, with a 90% C.I. ranging from .041 to .052. After focusing on the model as a whole, we turn our attention to the fit of individual parameters in the model. Based on a probability level of .05, the test statistic needs to be > ± 1.96. The review of the unstandardized solution shows all estimates to be reasonable as well as statistically significant, ranging from .36 to .96. The model is shown in Figure 1.
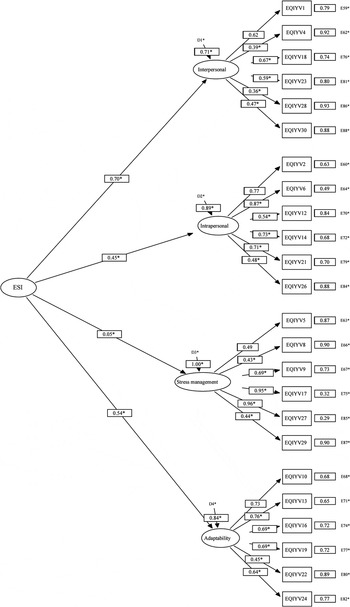
Figure 1. Final model of the Confirmatory Factor Analysis of the Spanish version of the EQ-i: YV-S.
Convergent validity
Taking into account previous studies (Ciarrochi et al., Reference Ciarrochi, Chan and Caputi2000; Ciarrochi et al., Reference Ciarrochi, Chan and Bajgar2001; Ferrando et al., Reference Ferrando, Prieto, Almeida, Ferrándiz, Bermejo, López-Pina and Fernández2011; Kong et al., Reference Kong, Zhao and You2012; Rey et al., Reference Rey, Extremera and Pena2011; Salvador, Reference Salvador2012), bivariate correlations among EQ-i: YV-S and general self-concept were performed, finding positive significant correlations between self-concept and interpersonal (r = .153, p < .001), intrapersonal (r = .235, p < .001), stress management (r = .145, p < .001), adaptability (r = .311, p < .001) and ESI (r = .360, p < .001).
Predictive validity
To test for the validity of EQ-i: YV-S in predicting general self-concept, a structural equation modeling was performed. The results are presented in Figure 2.
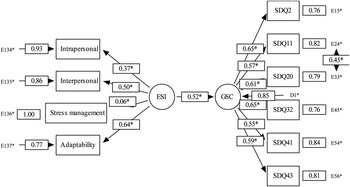
Figure 2. Structural equation modeling for Emotional Social Intelligence (ESI) and General Self-Concept (GSC).
As in the Confirmatory Factor Analysis of EQ-i: YV-S, Mardia’s coefficient of 18.0639 (Z-statistic of 13.1404) was highly suggestive of multivariate non-normality, so analysis were conducted using robust ML estimation, based on the Satorra-Bentler scaled chi-square statistics (S-Bχ2). The model as a whole did not show a good fit to the data, with a S-Bχ2 / df = 3.53, CFI value of .899, SRMR value of .071 and an RMSEA value of .071, with a 90% C.I. ranging from .057 to .085. The Lagrange Multiplier test (LM) suggested which parameters could be related to improve the model fit. It is possible to introduce correlated errors if there is some overlap in item content; one parameter between items SDQ11-SDQ20 error covariances was included to improve the fit of the model. After allowing this covariance, the indices improved to S-Bχ2 /df = 2.56; CFI = .94; SRMR = .061; RMSEA = .055, and 90% C.I. = .040–.070. The incorporation of this error covariance between item 11 (“Most things I do, I do well”) and item 20 (“Overall, most things I do turn out well”), can be considered pertinent from a theoretical point of view, since the content of the related items is similar, a frequent occurrence when personality complex constructs are evaluated. This final model exemplifies a reasonably good fit to the data. The review of the unstandardized solution of SDQ items shows all estimates to be reasonable as well as statistically significant factor loadings ranging from .55 to .65. As well, examining z-statistics associated with structural estimates, it can be determined that the path coefficient from the ESI to general self-concept is significant (.52).
Discussion
The main purpose of the present study was to explore new sources of validity evidence drawn from the scores on the EQ-i: YV-S in a sample of Spanish adolescents.
Specifically, the first aim was to analyze further reliability evidence of scores on the EQ-i: YV-S based on internal consistency coefficients. According to the criteria established for reliability, the results showed that the scores on three (intrapersonal, stress management, and adaptability) of the four scales on the EQ-i: YV-S have internal consistency reliability estimates within an acceptable range (greater than .70) being consistent with previous studies (Bar-On & Parker, Reference Bar-On, Parker, Caraballo and Villegas2000; Ugarriza & Pajares, Reference Ugarriza and Pajares2005).
The second purpose was to extend validity evidence based on the internal structure of scores on the EQ-i: YV-S using EFA and CFA in the framework of structural equation modeling approach, supporting the multidimensionality of the EQ-i: YV-S. This result is consistent with most of the previous research (Austin et al., Reference Austin, Saklofske and Egan2005; Bar-On & Parker, Reference Bar-On, Parker, Caraballo and Villegas2000; Ugarriza & Pajares, Reference Ugarriza and Pajares2005), but not with others that claim the measure’s unidimensionality (Dawda & Hart, Reference Dawda and Hart2000; Palmer et al., Reference Palmer, Manocha, Gignac and Stough2003). Our findings suggest, as Bar-On (Reference Bar-On and Geher2004) claims, that emotional-social intelligence is a multi-factorial array of interrelated emotional and social competencies, skills, and facilitators that influence one’s ability to recognize, understand, and manage emotions; to relate with others; to adapt to change and solve problems of a personal and interpersonal nature; and to efficiently cope with daily demands, challenges, and pressures. The CFA conducted compared the goodness of fit of the three models tested. It was Model 3, the second-order model, composed of four first-order factors (interpersonal, intrapersonal, stress management, and adaptability) and one second-order factor (emotional-social intelligence) that demonstrated the best fit to the data. These results are consistent with the theoretical basis of the questionnaire, since the authors proposed that the EQ-i: YV-S is composed by dimensions of interpersonal, intrapersonal, stress management, and adaptability; with the sum of these dimensions, a score of overall emotional intelligence can be obtained.
The third aim was to extend convergent and predictive validity evidence based on the relationships of scores on the EQ-i: YV-S with general self-concept. As previous studies found (Ciarrochi et al., Reference Ciarrochi, Chan and Bajgar2001; Ciarrochi et al., Reference Ciarrochi, Chan and Caputi2000; Ferrando et al., Reference Ferrando, Prieto, Almeida, Ferrándiz, Bermejo, López-Pina and Fernández2011; Ferrándiz et al., Reference Ferrándiz, Hernández, Bermejo, Ferrando and Sáinz2012; Kong et al., Reference Kong, Zhao and You2012; Rey et al., Reference Rey, Extremera and Pena2011; Salvador, Reference Salvador2012), in this study, significant positive correlations were found between EQ-i: YV-S scales and general self-concept. Although the correlations were not very high (ranging from .14 to .36), they were similar to these previous studies. Furthermore, as in previous studies (Augusto et al., Reference Augusto-Landa, López-Zafra, Aguilar-Luzón and Salguero de Ugarte2009; Kong et al., Reference Kong, Zhao and You2012; Runcan & Iovu, Reference Runcan and Iovu2013; Salvador, Reference Salvador2012), the results of the structural equation model revealed that the ESI general construct, was a significant predictor for adolescent general self-concept.
This study has some limitations, because it is only a first exploration of EQ-i: YV-S properties in a Spanish adolescent population. First, the reliability indices of the interpersonal scale were slightly bit below the acceptable range (greater than .70) as in previous studies (Hassam & Sader, Reference Hassan and Sader2005, Ugarriza & Pajares, Reference Ugarriza and Pajares2005), so further investigation is needed to clarify the reliability of this scale. Second, although the correlations between EQ-i: YV-S and general self-concept were significant, it is possible that they cannot be taken as clear evidence of convergent validity, so future research should try to clarify these findings taking into account that this study is the first one analyzing the EQ-i: YV-S in a Spanish sample.
To accumulate further validity evidence of scores on the EQ-i: YV-S, future research could examine its factorial invariance using multigroup confirmatory factor analysis from structural equation modeling and other recent methodological strategies, such as exploratory structural equation modeling (ESEM), which is an integration of exploratory factor analysis and confirmatory factor analysis.
Although this study had limitations, the findings of this study provide overall support for the reliability and validity of scores on the EQ-i: YV-S in this sample of Spanish adolescents, and could provide important information for students, school psychologists, teachers, and researchers because it is an adequate short tool for the fast and easy assessment of the emotional intelligence of adolescents and young adults. Results of this study: (1) support the internal consistency and reliability of three of the four scales; (2) provide appropriate support for the multidimensionality of the EQ-i: YV-S; (3) demonstrate that the hierarchical model presented a better fit than the other two, congruent with the model proposed by Bar-On and Parker (Reference Bar-On, Parker, Caraballo and Villegas2000), and (4) provide support for the instrument’s predictive validity.
This study forms part of the research project “School engagement in the secondary education depending on the individual characteristics and the social context of the students” EHUA15/15. Financial support for the project is provided by the Universidad del País Vasco/Euskal Herriko Unibertsitatea UPV/EHU (Spain).


