The hypothesis that schizophrenia has a progressive and even neurodegenerative component has re-emerged in recent years (DeLisi, Reference DeLisi2008; Olabi et al., Reference Olabi, Ellison-Wright, McIntosh, Wood, Bullmore and Lawrie2011). The issue whether schizophrenia is an active process and presupposes progressive brain changes or it is result of static brain lesions that reflect the end stage of completed deterioration is important to understand pathophysiology of disease and to explore adequate approaches for therapy.
Several lines of structural and functional evidence indicate greater-than-normal age-related cortical gray matter volume reductions in chronic schizophrenia (Mathalon, Sullivan, Lim, & Pfefferbaum, Reference Mathalon, Sullivan, Lim and Pfefferbaum2001). Magnetic resonance imaging (MRI) studies of patients provided evidences of progressive changes, including progressively increased ventricle size, progressively reduced whole brain volume and whole gray matter (DeLisi et al., Reference DeLisi, Sakuma, Tew, Kushner, Hoff and Grimson1997; DeLisi, Reference DeLisi2008; Ho et al., Reference Ho, Andreasen, Nopoulos, Arndt, Magnotta and Flaum2003; Olabi et al., Reference Olabi, Ellison-Wright, McIntosh, Wood, Bullmore and Lawrie2011; Salisbury, Kuroki, Kasai, Shenton, & McCarley, Reference Salisbury, Kuroki, Kasai, Shenton and McCarley2007), and frontal and temporal gray matter (Bachmann et al., Reference Bachmann, Bottmer, Pantel, Amann, Essig, Schad and Schröder2004; Gur et al., Reference Gur, Cowell, Turetsky, Gallacher, Cannon, Bilker and Gur1998; Ho et al., Reference Ho, Andreasen, Nopoulos, Arndt, Magnotta and Flaum2003). The frontal lobe volume as well as gray matter reduction during the course of the schizophrenia are among the most consistent results of the studies that investigated the longitudinal brain changes in schizophrenia (Hulshoff Pol & Kahn, 2008).
The studies of patients with schizophrenia have provided extensive evidence of disturbed function of prefrontal neuronal circuits. The evidence of abnormal prefrontal cortex function includes data from many studies of neuropsychological and cognitive functions, neuroimaging, studies of eye movements (Eisenberg & Berman, Reference Eisenberg and Berman2010; Weinberger et al., Reference Weinberger, Egan, Bertolino, Callicott, Mattay, Lipska and Goldberg2001). In line with the suggestion that frontal lobe dysfunction is crucially important in schizophrenic psychopathology a close relationship between frontal lobe dysfunction and negative symptoms, thought disorder, and functional outcomes in schizophrenia was shown (Eisenberg & Berman, Reference Eisenberg and Berman2010; Gur et al., Reference Gur, Cowell, Turetsky, Gallacher, Cannon, Bilker and Gur1998; Stirling, Hellewell, Blakey, & Deakin, Reference Stirling, Hellewell, Blakey and Deakin2006). However, insufficient attention has been paid to the progressive changes in functional activity of prefrontal cortex (PFC) during the course of illness.
The antisaccade (AS) performance involves a range of advanced cognitive processes, collectively described as executive functions that rely heavily on frontal lobe structures and include: directed attention and inhibition, task management, planning, monitoring, and coding of representations in working memory (Broerse, Crawford, & den Boer, Reference Broerse, Crawford and den Boer2001; Levy, Mendell, & Holzman, Reference Levy, Mendell and Holzman2004). The importance of frontal areas in the AS performance is corroborated by the results from studies in healthy subjects using functional brain imaging (Curtis & D’Esposito, Reference Curtis and D’Esposito2003; Doricchi et al., Reference Doricchi, Perani, Incoccia, Grassi, Cappa, Bettinardi and Fazio1997; Ford, Goltz, Brown, & Everling, Reference Ford, Goltz, Brown and Everling2005; O’Driscoll et al., Reference O’Driscoll, Alpert, Matthysse, Levy, Rauch and Holzman1995), event-related potential studies (Cordones, Gómez, & Escudero, Reference Cordones, Gómez and Escudero2013; Everling, Krappmann, & Flohr, Reference Everling, Krappmann and Flohr1997; Kirenskaya, Myamlin, Novototsky-Vlasov, Pletnikov, & Kozlovskaya, Reference Kirenskaya, Myamlin, Novototsky-Vlasov, Pletnikov and Kozlovskaya2011; Richards, Reference Richards2003), as well as animal studies (Funahashi, Chafee, & Goldman-Rakic, Reference Funahashi, Chafee and Goldman-Rakic1993).
Poor performance of schizophrenia patients on the AS task has been interpreted as support for prefrontal cortex dysfunction and abnormalities in several related prefronto-centric circuits. It has been shown that patients with schizophrenia produce significantly more errors in the antisaccade task than healthy controls (see Hutton & Ettinger, Reference Hutton and Ettinger2006; Turetsky et al., Reference Turetsky, Calkins, Light, Olincy, Radant and Swerdlow2006, for review). Several studies reported increased correct antisaccade latencies (Karoumi, Ventre-Dominey, Vighetto, Dalery, & d’Amato, 1998; Kirenskaya et al., Reference Kirenskaya, Myamlin, Novototsky-Vlasov, Pletnikov and Kozlovskaya2011; McDowell, Myles-Worsley, Coon, Byerley, & Clementz, Reference McDowell, Myles-Worsley, Coon, Byerley and Clementz1999) as well as increased variability of response latency for correct antisaccades (Damilou, Apostolakis, Thrapsanioti, Theleritis, & Smyrnis, Reference Damilou, Apostolakis, Thrapsanioti, Theleritis and Smyrnis2016; Smyrnis et al., Reference Smyrnis, Karantinos, Malogiannis, Theleritis, Mantas, Stefanis and Evdokimidis2009) in schizophrenic patients. The results of fMRI and ERP studies provided in schizophrenic patients during performance of AS task revealed distinct frontal cortex dysfunction (Camchong, Dyckman, Austin, Clementz, & McDowell, Reference Camchong, Dyckman, Austin, Clementz and McDowell2008; Kirenskaya et al., Reference Kirenskaya, Myamlin, Novototsky-Vlasov, Pletnikov and Kozlovskaya2011; Klein, Heinks, Andresen, Berg, & Moritz, Reference Klein, Heinks, Andresen, Berg and Moritz2000; McDowell et al., Reference McDowell, Brown, Paulus, Martinez, Stewart, Dubowitz and Braff2002).
Increased error rate in AS task is considered as viable schizophrenia endophenotype (Turetsky et al., Reference Turetsky, Calkins, Light, Olincy, Radant and Swerdlow2006). Respectively, it has been observed in patients with recent onset schizophrenia and in unmedicated patients (Crawford, Haeger, Kennard, Reveley, & Henderson, Reference Crawford, Haeger, Kennard, Reveley and Henderson1995; Ettinger et al., Reference Ettinger, Kumari, Chitnis, Corr, Crawford, Fannon and Sharma2004; Hutton et al., Reference Hutton, Crawford, Puri, Duncan, Chapman, Kennard and Joyce1998), suggesting this deficit is not due to disease chronicity. Although individuals with schizophrenia generally manifest stable increased error rate in AS task, the possibility that other antisaccade measures such as correct AS latencies, latency variability and frontal cortex activity may be increasingly impaired over time has not been ruled out. We have not found any studies that have used the AS parameters to compare first-episode and chronic schizophrenia.
The contingent negative variation (CNV) analysis is important and convenient approach to study cortical processes related to AS performance. This slow negative wave is considered to be a reflection of the endogenous attentional effort, expectation of forthcoming imperative stimulus and motor preparation (Brunia, Reference Brunia1999; Gomez, Marco, & Grau, Reference Gomez, Marco and Grau2003; Gómez & Flores, Reference Gómez and Flores2011; Klein et al., Reference Klein, Heinks, Andresen, Berg and Moritz2000). Amplitude and spatial/temporal parameters of saccadic CNV are dependent on a saccadic paradigm and brain functioning (Evdokimidis, Smyrnis, Constantinidis, Gourtzelidis, & Papageorgiou, Reference Evdokimidis, Smyrnis, Constantinidis, Gourtzelidis and Papageorgiou2001; Kirenskaya et al., Reference Kirenskaya, Myamlin, Novototsky-Vlasov, Pletnikov and Kozlovskaya2011).
If schizophrenia involves progressive cortical gray matter reduction, then comparative testing of first-episode and chronic patients using AS task should reveal progressive worsening of functional measures of the integrity of the prefrontal cortical areas in patients during the course of illness. Thus, in order to characterize AS performance measures, and to test the progressive disturbances in prefrontal cortex functional activity at different stages of the illness the comparative analysis of the first-episode and chronic schizophrenia patients’ data was performed in the frames of the current study.
Method
Subjects
The data from 56 right-handed male subjects (aged 19 – 46 years) who participated in the study were analyzed. Handedness was assessed by the Annett questionnaire (Annett, Reference Annett1970). Demographic and clinical characteristics for schizophrenia patients and healthy subjects are presented in Table 1.
Table 1. Demographic and clinical characteristics for first-episode and chronic schizophrenia patients, and healthy subjects

The patients were admitted to Serbsky National Centre of Social and Forensic Psychiatry to undergo examination, and received an ICD-10 diagnosis of a schizophrenic disorder (F20).
Schizophrenia patients comprised two groups: (1) 15 patients (mean age 29,29 ± 1,56 years) who had recently experienced the first psychotic episode according to ICD-10 criteria and had the illness duration less than 1 year; (2) 20 chronic schizophrenia patients (mean age 34,24 ± 1,41 years) with the duration of illness more than 5 years. Patients’ current symptomatology was assessed with Positive and Negative Symptom Scale (PANSS). Most of patients (30 subjects) were classified as paranoid (F20.06), 2 patients had undifferentiated schizophrenia (F20.3), and 3 patients had simple schizophrenia (F20.6). All of the patients were withdrawn from medication for the period exceeding one month before the examination.
Control group included 21 healthy subjects (mean age 27,13 ± 1,48 years). None had previous personal or family history of psychiatric disease, developmental and neurological abnormalities, psychoactive drugs addictions.
The experimental protocol was approved by local ethical committee. After a detailed description of the study, written informed consent for the investigation was obtained from all subjects.
Procedure
Experiments were carried out in a darkened room. The subjects were seated 100 cm in front of a board with 3 red light-emitting diodes (LED’s) - one central and two peripheral LED’s located 10° left and right of the central one. The central LED was used as the fixation point (FP), two other LED’s were used as peripheral targets (PT). Participants performed antisaccades and were instructed to look as quickly as possible at the horizontal mirror position of the PT. During the experiment, the FP was extinguished simultaneously with PT onset. The duration of the interval between the FP and PT onset varied between 1200 and 1400 ms. The duration of PT was 100 ms (Fig. 1). Left or right target locations were randomly chosen for each trial. The correction visual stimulus (CS) at the mirror position was presented 1.5–2 s after the PT onset (Fig. 1). To initiate each trial, the subject pressed and held down a mouse button with the right index finger, and FP was switched on 100–1500 ms after the press. The mouse was located on the elbow-rest. The button press was introduced in the experimental paradigm to increase attention level and behavioral engagement in the task that are generally reduced in schizophrenic patients. The LED’s were controlled by a custom designed computer program. All intervals varied randomly. 3–4 blocks of 45 trials each were provided during either experiment. Rest interval between the blocks lasted about 3 min.
Figure 1. Experimental paradigm and examples of EOG recording. A. Experimental design of the visual stimuli presentation. Dark circle – the stimulus is “on”, light circle – the stimulus is “off”. B. Example of EOG recording. FP – fixation point PT – peripheral target EOG - electrooculogram.
Recording
The electroencephalogram (EEG) was recorded with 19 electrodes according to the international 10–20 system using an EEG-24 AC amplifier (MBN, Russia). Horizontal electrooculogram (EOG) was recorded with skin electrodes placed at the outer canthi of both eyes. All active electrodes including EOG ones were referred to the left earlobe, signal from the right earlobe was recorded as the 20th active channel. Electrode impedance was kept below 5–10 kΩ. Prior to further analysis, all channels were recalibrated (off-line) with respect to linked (averaged) earlobes. During the recording, the high cut-off 70 Hz, the time constant 0.3 s and the notch filter 50 Hz were used. Data were sampled at 200 Hz and stored for off-line analysis.
In this study we analyzed the EEG of frontal (F3, Fz, and F4), central (C3, Cz, and C4), and parietal (P3, Pz, and P4) channels. These 9 channels were selected, on the basis of the topographical maps, as those channels that covered the main activity of the saccadic CNV (Gómez et al., 2003; Gómez & Flores, Reference Gómez and Flores2011; Klein et al., Reference Klein, Heinks, Andresen, Berg and Moritz2000).
Data analysis
Eye artifact rejection was accomplished by the multiple-source eye correction method (Klein et al., Reference Klein, Heinks, Andresen, Berg and Moritz2000; Novototsky-Vlasov, Garakh, & Kovalev, Reference Novototsky-Vlasov, Garakh and Kovalev2007). Principal Component Analysis (PCA) was applied to multichannel EEG recordings to obtain principal components, related to eye movements. Appropriate components were selected visually (based on signal dynamics and topography) and afterwards subtracted from each EEG channel with corresponding coefficient, calculated by linear regression. Further, all of the trials were visually inspected for remaining artifacts and saccade onset correction.
Prior to averaging EEG records were transformed to time constant of 5 s to obtain slow potentials. The transformation procedure makes use of the fact that cut-off frequency of analog filters denotes only –3 dB rejection, and so part of slow activity passes through the filter. Therefore, the remaining activity in the filter stop band may be restored with the exception of DC component (see Ruchkin, Sutton, Mahaffey, & Glaser, Reference Ruchkin, Sutton, Mahaffey and Glaser1986, for details).
The EOG channel was used for automatic saccade onset detection and for measuring saccade latency and direction. Saccade onset was defined as a starting point of EOG deflection exceeding predetermined threshold by slope, and which amplitude exceeded EOG standard variation value. The sign of deflection determined saccade direction. Each trial was classified according to the latency and direction (correct or wrong with respect to the task instruction) of the saccade. The performance indices for each subject were the following: (1) the percentage of correct and wrong saccades; (2) mean latency of correct saccades; (3) standard deviation of the latency (sdL) for correct saccades. Additionally, Coefficient of Variation of the latency (CV) for correct saccades was calculated as normalized measure of latency variability.
Slow EEG potentials were averaged for correct saccades only, if their number was sufficient for averaging (>30). Trials with saccadic latencies greater than 600 ms (usually in patients’ records) were considered delayed and were disregarded (Klein et al., Reference Klein, Heinks, Andresen, Berg and Moritz2000). The EEG data of 5 chronic patients were excluded from the analysis because of excessive number of artifacts.
The averages were triggered on peripheral target stimulus onset, and responses to right and left PTs were poolled together for analysis. EEG records 1500 ms before and 500 ms after the trigger onset were averaged. 1000 ms analysis epoch before the PT was used for quantitative evaluation of negative potentials amplitude. Baseline was determined as mean value of potentials during 100 ms immediately preceding the analysis epoch.
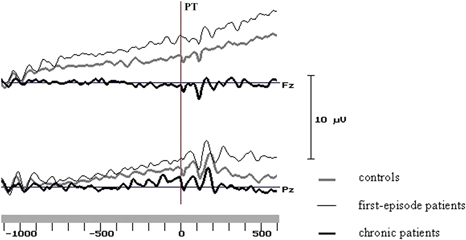
In line with previous results (Kirenskaya et al., Reference Kirenskaya, Myamlin, Novototsky-Vlasov, Pletnikov and Kozlovskaya2011) two intervals were selected for analysis - the first and last 200 ms of the analysis epoch. Mean amplitudes of the potentials in these two intervals were subjected to further statistical analysis. Sample averaged potentials for three groups are represented at Figure 2.
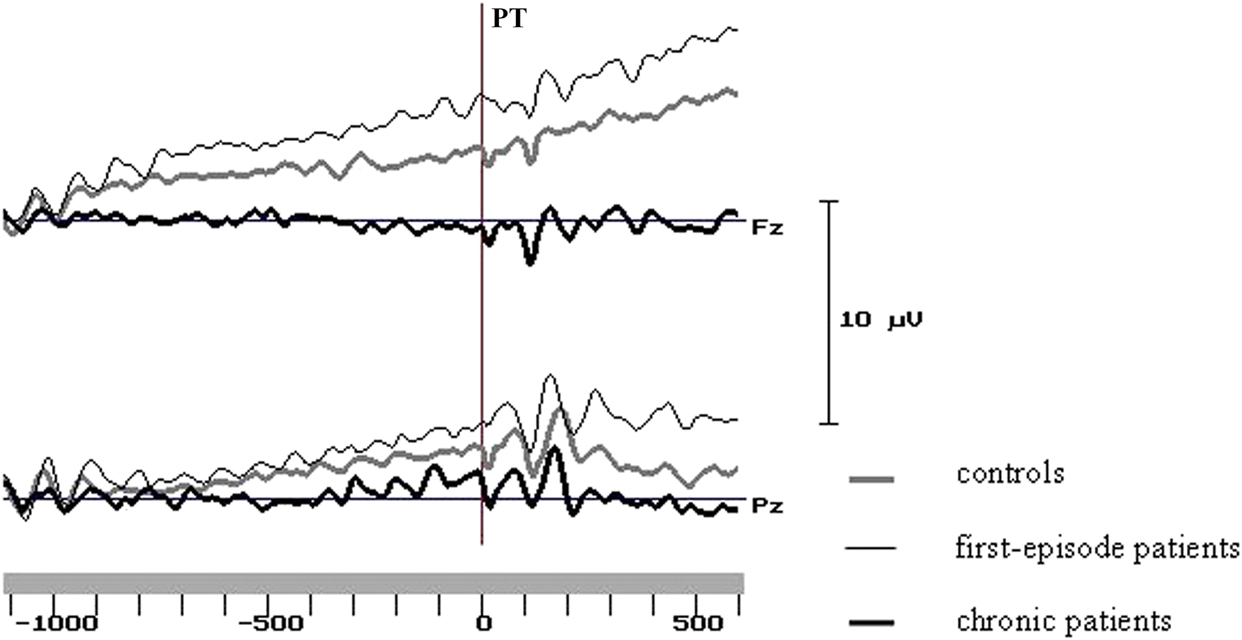
Figure 2. Grand average curves at the midline frontal and parietal sites in the groups of control subjects and schizophrenic patients. PT - peripheral target onset.
Statistical analysis
Statistical analysis of the obtained results was performed using SPSS 11.0 software. Because the age differed significantly between groups ANCOVA model with the age as covariate was used.
Percent of errors, correct saccades latency, and standard deviation of the latency were compared between groups by analysis of variance ANCOVA, GLM, univariate analysis. Mean amplitudes of the slow cortical potentials were analyzed using ANCOVA, GLM, repeated measures. ANCOVA included between-subjects factor Group (n = 3: control subjects vs. first-episode patients vs. chronic patients), and within-subjects factors - Interval (n = 2), Electrode (n = 3: frontal (F3, Fz, F4) vs. central (C3, Cz, C4) vs. parietal (P3, Pz, P4) sites) and Laterality (n = 3: left vs. sagittal vs. right sites), and the age as covariate. For all main and interaction effects including within-subject factors with more than two levels, violations of the sphericity assumption were controlled for by df adjustment. Hence, Greenhouse-Geisser corrected p values are reported. For post-hoc analysis of contrasts of group means, we used the Student’s t-test for independent samples. Only significant effects were reported. Effect size (d) was calculated.
Spearman’s correlations between PANSS scales and slow potentials amplitudes at frontal, central and parietal electrodes were analyzed separately for first-episode and chronic patients. Only significant (p < .05) correlations were examined. To compensate for multiple hypothesis tests (total number of analyzed correlations for each group amounted to 429) we used Wilkinson’s binomial expansion (Zaykin, Zhivotovsky, Westfall, & Weir, Reference Zaykin, Zhivotovsky, Westfall and Weir2002).
Results
Demographic data and clinical characteristics for each group are presented in Table 1.
The age of chronic patients differed significantly from that of control participants (t = 3.35, df = 39, p < .01) and first-episode patients (t = 2.29, df = 33, p < .05). Education differed significantly between control participants and chronic patients (t = 2.70, df = 39, p < .05). We did not attempt to control for education in further analysis as risk for schizophrenia may impair educational achievement.
The antisaccade performance differed significantly between groups: compared to control subjects, patients made much more direction errors, the antisaccade latencies were significantly longer in patients, and specific significant increase of correct response latency variability was observed (table 2).
Table 2. Saccade characteristics

Note: Group designations: C - controls, 1E - 1st episode patients, Chr - Chronic patients
Differences between first-episode and chronic patients groups were found at the tendency level for saccade latency. The variability of correct saccades latency was also more increased in chronic patients compared to first-episode ones. However, between-group differences were significant for sdL (standard deviation) (Z = 3.04, p < .05), but didn’t reach the significance level (Z = 1.65, p = .10) for CV (coefficient of variation) (table 2).
According to previously obtained data (Kirenskaya et al., Reference Kirenskaya, Myamlin, Novototsky-Vlasov, Pletnikov and Kozlovskaya2011; Kirenskaya, Kamenskov, Myamlin, Novototsky-Vlasov, & Tkachenko, Reference Kirenskaya, Kamenskov, Myamlin, Novototsky-Vlasov and Tkachenko2013) the CNV analysis revealed two distinct CNV stages during the fixation interval.
During the 1 st analysis interval (1000–800 ms before PT) in healthy subjects the CNV localized at the frontal-central area (Figure 3), and had the maximal amplitude at the midline (Fz: –1.30 ± 0.22 μV) and left (F3: –0.73 ± 0.23 μV) frontal cites and at the vertex zone (Cz: –0.78 ± 0.24 μV). In first-episode patients early CNV characteristics were very close to control group ones. During the 1st analysis interval maximal CNV amplitude was also recorded at Fz (–1.41 ± 0.30 μV), F3 (–0.42 ± 0.27 μV) and Cz (–0.48 ± 0.32 μV) sites. In chronic patients CNV amplitude was clearly declined at Fz (–0.31 ± 0.33 μV) electrode, and even positive deflection was recorded at left (F3: +0.26 ± 0.31 μV) and right (F4: +0.39 ± 0.21 μV) frontal sites; maximal CNV amplitude was found at the vertex (Cz: –0.78 ± 0.30 μV) (Figures 3 and 4).

Figure 3. Scalp potential maps of negative shift. Negative potentials are depicted in gray, positive potentials - in white.

Figure 4. Average frontal CNV amplitudes during the 1st and 2nd analysis intervals. Level of significance: + - p<0.1, * - p<0.05. Level of significance is presented in comparison to chronic patients group.
Similar CNV changes were observed in all groups during the fixation interval: the amplitude of negative potentials gradually increased over the left and midline frontal, parietal and occipital areas and decreased over the right hemisphere cortical areas. During the last 200 ms before PT CNV topography was similar in healthy subjects and first-episode patients, and maximal values of CNV amplitude were recorded at the midline and left frontal and parietal areas. In chronic patients the CNV amplitudes were lower compared to control and first-episode groups, especially at frontal sites (Figures 3 and 4).
The first set of comparisons between three groups for CNV amplitudes for the 1st and 2nd intervals revealed the nonsignificant effect of Group x Interval interaction (F(2, 46) = 1.14, MSE = 1,78, p = .51).
The comparisons between three groups for CNV amplitudes during the 1st analysis interval revealed the significant effect of Group (F(2, 47) = 3.36, MSE = 1,06, p = .043), significant Group x Electrode interaction (F(4, 94) = 3.38, MSE = 1.56, p = .017), and there was significant effect of repeated trials for Laterality (F(2, 94) = 5.13, MSE = 1.34, p = .011).
The comparison between first-episode and control groups didn’t show any significant differences.
Significant main effects of Group (F(1, 33) = 6.62, MSE = 1.06, p = .018), Group x Electrode interaction (F(2, 66) = 5.66, MSE = 1.41, p = .008) were obtained when chronic patients and controls were compared; repeated trials analysis revealed significant effect of Laterality (F(2, 66) = 5.36, MSE = 1.42, p = .001).
The comparison of first-episode and chronic patients demonstrated the significant effect of Group (F(1, 27) = 4.35, MSE = .99, p = .047), significant interaction Group x Electrode (F(2, 54) = 4.85, MSE = 1.55, p = .016); repeated trials analysis revealed marginally significant effect of Electrode (F(2, 54) = 2.54, MSE = 1.55, p = .096).
The post-hoc analysis showed that mean CNV amplitudes for the chronic patients were significantly lower compared to control subjects at frontal sites (Fz: t = 2.06, df = 34, p < .05, effect size .70; F3: t = 2.6, df = 34, p < .05, effect size .88; F4: t = 2.09, df = 34, p < .05, effect size .71). The comparison between first-episode and chronic patients has found significantly declined CNV amplitude at Fz (t = 2.45, df = 28, p < .05, effect size .90) in chronics (Figure 4).
The comparison of three groups at the 2nd interval has revealed the significant effect of Group x Electrode interaction (F(4, 92) = 3.49, MSE = 11.44, p = .017), and marginally significant effect of repeated trials (Electrode - F(2, 92) = 2.94, MSE = 11.44, p = .069). The significant differences between first-episode and control groups weren’t found.
The comparison of chronic patients with controls revealed significant main effect of Group (F(1, 32) = 4.16, MSE = 4.00, p = 0.05) and significant Group x Electrode interaction (F(2, 64) = 4.02, MSE = 10,28, p = .032); and there was marginally significant effect of repeated trials (Electrode - F(2, 64) = 2.68, MSE = 10.28, p = .089).
The comparison of first-episode and chronic patients revealed significant interaction Group x Electrode (F(2, 54) = 6.69, MSE = 13.48, p = .006), and marginally significant effect of repeated trials (Electrode - F(2, 54) = 2.89, MSE = 13.48, p = .078).
A post-hoc comparison demonstrated that in the 2nd analysis interval the CNV amplitude was significantly lower at frontal sites in chronic patients compared to controls (F3: df = 33, t = 2.09, p = .045, effect size = .71) and to first-episode patients (Fz: df = 28, t = 1.91, p = .066, effect size .70; F3: df = 28, t = 1.91, p = .066, effect size .70) (Figure 4).
PANSS scores and correlations between PANSS scales and CNV
The comparison of clinical symptoms severity in first-episode and chronic patients groups revealed that all PANSS scores were higher in chronic patients, and the differences were significant for P6, P7, N5, N7, G2, G3, and G6 scales (table 3). It is important to emphasize the greater thought disorders (scales: Difficulty in abstract thinking, Stereotyped thinking) in chronic patients.
Table 3. PANSS scores differences between first-episode and chronic schizophrenic patients

The amplitudes of slow cortical potentials obtained within the 1st analysis interval were used to assess the relationships between brain activity measures and PANSS scales, because the early stage of CNV is mainly associated with cognitive aspects of preparatory set. In first-episode patients 7 significant correlations (p < .05) were revealed (table 4), but after corrections this result was not valid (corrected p-value with respect to multiple hypothesis tests P(0.044, 429, 7) = 0.9995, where 0.044 - the maximal probability of single correlation, 429 - total number of analyzed correlations, 7 - number of significant correlations).
Table 4. Significant Spearman’s correlations (R) between PANSS scales and amplitudes of slow potentials in the first-episode patients group
In chronic patients 31 significant correlations (p < .05) were found, and maximal number of correlations (16 / 55 %) was found for frontal sites (table 5). This result was valid after correction (corrected p-value - P(0.05, 429, 31) = 0.0273). Noteworthily, the number of significant correlations with negative symptoms scales was twice as many as those with positive ones. Among the general scales significant correlations were found for scales G1 (somatic concern), G4 (tension), G8 (uncooperativeness), G9 (unusual thought content), G12 (lack of judgment), G15 (preoccupation), G16 (active social avoidance). This result is in line with clinical symptomatology of the chronic patients.
Table 5. Significant Spearman’s correlations (R) between PANSS scales and amplitudes of slow potentials in the chronic patients group
Discussion
This study tested whether the measures of AS performance and related cortical activity differed between samples of first-episode and chronic schizophrenia patients. The obtained data suggest that in both groups of patients AS performance was significantly poorer than that of control subjects. The patients had significantly elevated error percent, significantly increased average latency of correct antisaccades as well as increased variability of the correct response latencies compared to healthy subjects. Comparison of two patients groups revealed marginally significant increase of the average correct response latency and latency variability in chronic patients compared to first-episode ones.
Results of CNV analysis provide evidence that only chronic schizophrenia patients exhibit robustly declined frontal CNV amplitude related to decreased prefrontal cortex activation. These data are in line with previously reported results (Kang, Dionisio, & Sponheim, Reference Kang, Dionisio and Sponheim2011; Kirenskaya et al., Reference Kirenskaya, Myamlin, Novototsky-Vlasov, Pletnikov and Kozlovskaya2011; Klein et al., Reference Klein, Heinks, Andresen, Berg and Moritz2000). In contrary, in first-episode schizophrenic patients the level of frontal activation didn’t differ from that of control subjects.
Error rate has been extensively investigated in schizophrenia. Numerous studies have consistently reported a greater number of inappropriate reflexive saccades to the target in different populations of schizophrenia patients (Hutton & Ettinger, Reference Hutton and Ettinger2006; Turetsky et al., Reference Turetsky, Calkins, Light, Olincy, Radant and Swerdlow2006). The markedly increased error percent that was found in both patient groups in the present study agrees with previous data suggesting this deficit is not due to disease chronicity.
Concerning the response latency for making an antisaccade, some studies report longer mean latencies for correct antisaccades for patients with schizophrenia compared with controls (Fukushima et al., Reference Fukushima, Morita, Fukushima, Chiba, Tanaka and Yamashita1990; Karoumi et al., Reference Karoumi, Ventre-Dominey, Vighetto, Dalery and d’Amato1998; Sereno & Holzman, Reference Sereno and Holzman1995), although this deficit is not consistent across studies.
It is well-known that in healthy subjects response latencies are longer for antisaccades than prosaccades, which can be attributed to additional cognitive processes that are needed to perform AS task correctly. At a minimum, it requires the ability to inhibit a reflexive stimulus-driven prosaccade toward the peripheral target, to accomplish the coordinate transformation and to generate a voluntary eye movement (the antisaccade) to the opposite periphery, to perform all behaviors in a sequence, to sustain attention, and to remember the task requirements (Levy et al., Reference Levy, Mendell and Holzman2004). The theoretical framework and experimental results suppose a key role of the several prefrontal cortex areas in AS performance, which contribute to antisaccade initiation probably in different ways and in cooperation (McDowell, Dyckman, Austin, & Clementz, Reference McDowell, Dyckman, Austin and Clementz2008). It is mirrored in the results from magnetic resonance imaging and electrophysiological studies in human, as well as in neuronal studies in monkeys. Increased frontal activity before AS has been found in the frontal eye field (FEF), supplementary eye field (SEF), supplementary motor area, dorsolateral prefrontal cortex (DLPFC), the anterior cingulate cortex (ACC), and in orbitofrontal cortex (Brown, Vilis, & Everling, Reference Brown, Vilis and Everling2007; Curtis & D’Esposito, Reference Curtis and D’Esposito2003; Doricchi et al., Reference Doricchi, Perani, Incoccia, Grassi, Cappa, Bettinardi and Fazio1997; Ford et al., Reference Ford, Goltz, Brown and Everling2005; McDowell et al., Reference McDowell, Brown, Paulus, Martinez, Stewart, Dubowitz and Braff2002; O’Driscoll et al., Reference O’Driscoll, Alpert, Matthysse, Levy, Rauch and Holzman1995). The increased neural firing in the prefrontal cortex (SEF, DLPFC, and ACC) before antisaccades has been demonstrated in monkeys (Funahashi et al., Reference Funahashi, Chafee and Goldman-Rakic1993; Johnston & Everling, Reference Johnston and Everling2008).
The studies of visually guided saccades in schizophrenia report that the mean latency in patients does not differ from that of controls (Gale & Holzman, Reference Gale and Holzman2000; Slavutskaya, Kirenskaya, Novototskii-Vlasov, Shul’govskii, & Kozlovskaya, Reference Slavutskaya, Kirenskaya, Novototskii-Vlasov, Shul’govskii and Kozlovskaya2005). Thus, increased AS latency in patients is not related to general psychomotor slowing in schizophrenia. It can be supposed that the longer AS latencies in patients compared to controls relate to abnormal frontal neuronal networks functioning at the level of neurons, neuroreceptors and signal transmission (Eisenberg & Berman, Reference Eisenberg and Berman2010; Weinberger et al., Reference Weinberger, Egan, Bertolino, Callicott, Mattay, Lipska and Goldberg2001). Evidence is accumulating that the cellular architecture of PFC is abnormal in schizophrenia. The cytopathological, structural, and neuroreceptor mapping findings predict a prominent role of disrupted dorsolateral prefrontal cortical function and related aberrant interactions between this region and other brain structures contributing to executive dysfunction in schizophrenia.
The increase of the antisaccade latency variability has been reported previously in several studies of schizophrenia patients and individuals with high levels of schizotypal traits (Damilou et al., Reference Damilou, Apostolakis, Thrapsanioti, Theleritis and Smyrnis2016; Smyrnis et al., Reference Smyrnis, Karantinos, Malogiannis, Theleritis, Mantas, Stefanis and Evdokimidis2009). The significant increase of this measure was also found in patients in the present work. A specific increase in latency variability but not mean latency in a variety of tasks in schizophrenia patients leads to a hypothesis that increased variation in response latency might be a distinct deficit in schizophrenia (Smyrnis et al., Reference Smyrnis, Karantinos, Malogiannis, Theleritis, Mantas, Stefanis and Evdokimidis2009). According to the results of monkey studies response latency in saccadic tasks correlates with the rise time of neuronal activity between a resting state and a threshold level in the frontal eye field (FEF; Schall, Reference Schall2002). Increased latency variability in schizophrenic patients might be related to increased variability in neuronal activity rise time to threshold level. We have found significantly greater mean latencies and latency variability for correct antisaccades in both first-episode and chronic schizophrenia patients compared to controls, but these measures were the worst in chronic patients. Considering the hypothesis of a frontal lobe dysfunction in schizophrenia (Eisenberg & Berman, Reference Eisenberg and Berman2010; Weinberger et al., Reference Weinberger, Egan, Bertolino, Callicott, Mattay, Lipska and Goldberg2001) such a link of a behavioral measure with the abnormal neuronal activity in prefrontal cortex could be significant.
The important findings of the study are the revealed differences in frontal CNV amplitude between patients groups. The decrease of frontal CNV amplitude that was observed in chronic schizophrenia patients replicated previous reports (Kirenskaya et al., Reference Kirenskaya, Myamlin, Novototsky-Vlasov, Pletnikov and Kozlovskaya2011; Klein et al., Reference Klein, Heinks, Andresen, Berg and Moritz2000). Underactivation of a distributed network of prefrontal cortex, involved in antisaccade task performance has also been described in functional brain imaging studies of schizophrenia patients (Camchong et al., Reference Camchong, Dyckman, Austin, Clementz and McDowell2008; McDowell et al., Reference McDowell, Brown, Paulus, Martinez, Stewart, Dubowitz and Braff2002; Reference McDowell, Dyckman, Austin and Clementz2008).
However, in first-episode patients poor AS performance was accompanied by high level of frontal activation, even slightly higher than in controls. Observation of abnormally increased DLPFC activation in schizophrenics has also been reported (Callicott et al., Reference Callicott, Mattay, Verchinski, Marenco, Egan and Weinberger2003; Jansma, Ramsey, van der Wee, & Kahn, Reference Jansma, Ramsey, van der Wee and Kahn2004; Manoach et al., 2003; Thermenos et al., Reference Thermenos, Goldstein, Buka, Poldrack, Koch, Tsuang and Seidman2005). A number of functional imaging studies investigated the alterations in DLPFC activation in response to executive cognitive demands in healthy subjects and schizophrenic patients. Based on the obtained results an inverted U-shaped load-response curve was supposed, such that as task demands increase, activation initially rises until physiological capacity is reached, after which, activation falls; this curve may be shifted to the left in schizophrenia because of diminished working memory capacity in patients (Jansma et al., Reference Jansma, Ramsey, van der Wee and Kahn2004; Manoach, Reference Manoach2003), resulting in hyper- (i.e., inefficient) activation at lower relative task loads (where performance may be comparable with that of healthy subjects) and hypo- (i.e., inadequate) activation at higher relative task loads (where performance is likely to be significantly worse in schizophrenia; Callicott et al., Reference Callicott, Mattay, Verchinski, Marenco, Egan and Weinberger2003; Manoach, Reference Manoach2003). Thus, more activation is not always better; rather, the level of activation depends on individual capacity, task load and prefrontal cortex functioning. In line with these findings we can conclude that first-episode patients have less efficient prefrontal processing than controls because the same frontal CNV amplitude (i.e., frontal activation) was related to worse AS performance level in this group. At the same time, the clearly higher CNV amplitude in first-episode patients compared to chronic patients might be interpreted as higher level of their PFC physiological capacity.
The higher symptom scores in chronic patients than in first-episode ones were found. Of particular note is the finding that significant symptom correlations with CNV amplitude were observed in chronic patients only. The associations of both positive and negative symptoms with cortical brain activity, related to AS performance, may reflect the fact that the disturbances of brain substrates that regulate AS performance might be involved in the genesis of schizophrenia symptoms. The great proportion of symptom correlations was related to frontal and central sites, and the present findings are in concert with existing scientific evidence of overall contribution of prefrontal cortex dysfunction in pathogenesis of schizophrenia (Eisenberg & Berman, Reference Eisenberg and Berman2010; Hutton & Ettinger, Reference Hutton and Ettinger2006; Weinberger et al., Reference Weinberger, Egan, Bertolino, Callicott, Mattay, Lipska and Goldberg2001). At the same time, there were no significant associations between symptoms and CNV amplitude in first-episode patients. We suspect that the revealed significant relationships in chronic patients are a result of progressive changes in brain functioning and constellation of typical symptoms into a characteristic pattern during the illness course condition.
The present data suggest that length of illness in schizophrenia might be associated with neurodegenerative processes that operate during the course of schizophrenia and that executive functions deficits are not simply static manifestations of anomalous neurodevelopment. Longitudinal studies of brain structures in schizophrenia found evidence of progressive reductions in tissue over the first 20 years of the disorder, with schizophrenia subjects showing over twice the rate of tissue loss as compared to controls. The decrements were noted as greatest in frontal and temporal lobes along with an increase in lateral ventricle size (Hulshoff Pol & Kahn, 2008). In line with these data the obtained results demonstrated worse AS task performance and progressive decline in frontal activation related to AS preparation in chronic patients compared to first-episode ones.
This study had limitations. Our results can be generalized only to men and paranoid schizophrenia. While the study was not longitudinal, it did not allow for direct examination of the course of AS deficits in schizophrenia; however, the distinct differences in the duration of illness between the two groups of patients allowed differentiation of early and late stages of schizophrenia. The present study provided evidence of progressive declines in AS performance and the efficiency of prefrontal cortex activation across recent-onset and chronic stages of schizophrenia that appear unrelated to medication status and practice effects in AS performance, and may reflect greater prefrontal deficit with longer disorder duration.