


In a recent review article, Diener, Inglehart, and Tay (Reference Diener, Inglehart and Tay2013) pointed out the need for psychometrically sound measures of life satisfaction and described their characteristics. Self-report scales of life satisfaction must reflect the thoughtful and reasonable assessments that people make of their lives. Scales must be reliable, yielding identical scores when administered under the same conditions, and scores should remain the same over time if life conditions are unchanged. Life satisfaction scales should also predict relevant future behaviours that have been consistently associated with levels of life satisfaction/dissatisfaction – such as health and longevity.
Scale validity
The Satisfaction with Life scale (SWLS) (Diener, Emmons, Larsen, & Griffin, Reference Diener, Emmons, Larsen and Griffin1985) is one of the most widely used scales in the assessment of global life satisfaction (Pavot & Diener, Reference Pavot and Diener1993, Reference Pavot and Diener2008, for reviews). The SWLS assesses a person’s conscious evaluative judgments of his or her life as a whole, based on a comparison of the person’s life with a self-imposed standard or set of standards (Andrews & McKennell, Reference Andrews and McKennell1980). Unlike other life satisfaction scales, the SWLS allows the respondent to integrate and weigh different facets of life domains using the respondent’s own criteria. The SWLS shows good convergent validity with other life satisfaction scales and with other types of assessments of quality of life and subjective well-being (SWB) (e.g. Vera-Villarroel, Urzúa, Celis-Atenas, & Silva, Reference Vera-Villarroel, Urzúa, Pavez, Celis-Atenas and Silva2012). The SWLS also moderately converges with other types of life satisfaction measurements that do not depend on respondent self-reports, such as expert assessments and peer or family member ratings of the target person (Pavot, Diener, & Suh, Reference Pavot, Diener and Suh1998). The SWLS has good concurrent validity, being positively related to constructs such as positive affect and self-esteem (Pavot & Diener, Reference Pavot and Diener2008). Test-retest reliabilities are usually above 0.8 over a period of several weeks and above 0.5 over a period of years (Diener et al., Reference Diener, Emmons, Larsen and Griffin1985; Pavot et al., Reference Pavot, Diener and Suh1998). The scores are stable under unchanging conditions, but are sensitive to changes in circumstances in people’s lives, although the SWLS shows moderate temporal stability, which is expected in a measure of life satisfaction. National mean levels of life satisfaction provide strong evidence for the validity of the SWLS in reflecting quality of life differences in societies. Another type of validity evidence for the SWLS is the difference between groups of individuals who appear to have fortunate versus unfortunate life circumstances (Pavot & Diener, Reference Pavot and Diener1993).
Factor structure
Five reflective items compose the SWLS. Exploratory and confirmatory factor analyses have consistently indicated a single-factor structure of the SWLS (e.g., Bendayan, Blanca, Fernández-Baena, Escobar, & Trianes, Reference Bendayan, Blanca, Fernández-Baena, Escobar and Trianes2013; Vera-Villarroel et al., Reference Vera-Villarroel, Urzúa, Pavez, Celis-Atenas and Silva2012), where item number five usually shows a lower loading score, although a two-factor structure has also been proposed (e.g., Vautier, Mullet, & Jmel, Reference Vautier, Mullet and Jmel2004). The scale tends to show good internal reliability, with Cronbach’s alpha coefficient of .80, or even higher, indicating convergence among life satisfaction items that are worded in different ways. In a meta-analysis study, Vassar (Reference Vassar2008) reported an average Cronbach’s alpha of .78. Originally written in English, its five reflective items are at the reading level of the sixth to tenth grades; the instrument is thus usable with most adults. The original response format was a 7-point Likert-type response scale ranging from ‘strongly disagree’ to ‘strongly agree’. The five items are all keyed in a positive direction, so the five responses can simply be added to arrive at a total score for the scale. However, studies using a 5-point Likert format are not rare (e.g., Atienza, Pons, Balaguer, & Garcia-Merita, Reference Atienza, Pons, Balaguer and García-Merita2000).
Cross cultural validation
The SWLS has potential as a cross-cultural index of global life satisfaction. The items have been translated into more than 13 languages (e.g., Sachs, Reference Sachs2003) and its psychometric properties have been assessed in numerous countries.
Objectives of the study
SWLS has been translated into Spanish in several versions (Atienza et al., Reference Atienza, Pons, Balaguer and García-Merita2000; Diener, Reference Diener2014; Núñez, Martín-Albo, & Domínguez, Reference Núñez, Martín-Albo and Domínguez2010; Vázquez, Duque, & Hervás, Reference Vázquez, Duque and Hervás2013). The objectives of this paper relate to several observations. Firstly, the psychometric properties (e.g., dimensionality) of these Spanish versions of the scale have been tested in different countries (e.g. Vázquez et al., Reference Vázquez, Duque and Hervás2013; Vera-Villarroel et al., Reference Vera-Villarroel, Urzúa, Pavez, Celis-Atenas and Silva2012) and across age groups (e.g. Pons, Atienza, Balaguer, & García-Merita, Reference Pons, Atienza, Balaguer and García-Merita2000). However, to our knowledge, the psychometric properties of this scale have not been examined in Chile across gender and status groups (e.g. student, worker, etc.). Secondly, there have been few efforts to assess the Spanish version’s factorial invariance across gender (e.g., Atienza, Balaguer, & García-Merita, 2003; Pons et al., 2000). Also, we identified no studies that examine factorial invariance of the Spanish version of SWLS across status groups. Previous studies have shown that occupation is important to well-being and is a “mechanism for meeting intrinsic needs and interests” (e.g., Anaby, Jarus, Backman, & Zumbo, Reference Anaby, Jarus, Backman and Zumbo2010, p. 84), indicating the importance of examining the factorial invariance of the SWLS across status groups. Thirdly, to our knowledge, there are no normative data for the Spanish version of the SWLS in Chile, across gender and status groups. An individual’s score could be better understood and interpreted when compared to individuals in his/her group and in other groups, showing the importance of providing normative data for the SWLS scale. As a result, the objectives of the current study are threefold: (1) to examine the psychometric properties (i.e., dimensionality, internal reliability, and concurrent validity) of the Spanish version of the SWLS on a representative sample of the Chilean population; (2) to test the factorial invariance of the SWLS across gender and status groups (student, worker, retired, housekeeper, and unemployed); and (3) to provide normative data of the SWLS in the context of Chile. Moreover, after confirming factorial invariance across groups, we compare the mean levels of life satisfaction of the different groups of people.
Method
Sample and data collection
The current study drew upon a national sample of the Chilean population. We implemented stratified random sampling based on geographic location to collect data. We used the Chilean census and obtained a sample of 1,500 participants, with a margin of error of 2.53% Footnote 1 , which is lower than the common threshold of 5%. Participants were sampled from the country’s 15 regions; the Greater Santiago region was overrepresented. Some 30% of the centres of population (i.e., cities and towns) and districts were selected proportionally. Blocks, houses, and individuals were randomly selected. A face-to-face administration of the questionnaire was chosen. A team of professional canvassers went door-to-door for three weeks to personally administer the survey questionnaire to the sampled participants.
We excluded cases where the individual did not open the door or if the person who opened the door was less than 15 years old or refused to answer. In such cases, we proceeded with a replacement that met the stratifying criteria i.e. from the same stratum. All participants were informed from the beginning about the objectives of the interview and that there was no financial reward. Informal consent was obtained on the spot. No cases were presented of non-Spanish speakers, or those with cognitive impairments. After excluding 21 individuals who had missing values on their SWLS scores or status data, an effective sample of 1,479 participants was used for the analysis. The demographic data of the sample are presented in Table 1.
Table 1. Sample Characteristics (Entire Sample and Based on Status Groups)

Note: a 25 missing values on marital status
Instruments
Satisfaction with Life scale (SWLS).
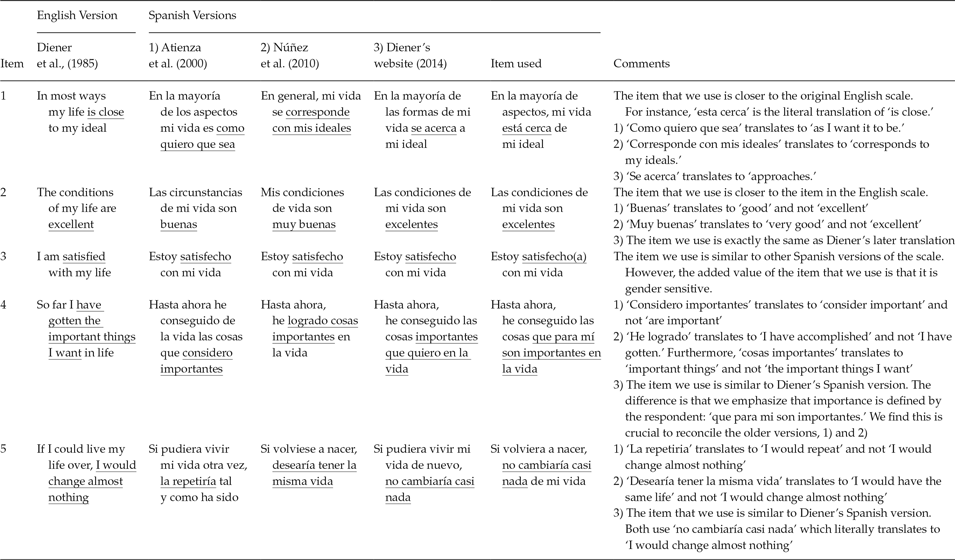
Participants were asked to evaluate their SWLS (Diener et al., Reference Diener, Emmons, Larsen and Griffin1985) by indicating their agreement on a 5-point Likert scale labelled from 1 (‘strongly disagree’) to 5 (‘strongly agree’). Diener et al. (Reference Diener, Emmons, Larsen and Griffin1985) used a 7-point Likert response format in their original English-language scale. Data analysis through basic co-relational techniques has been shown to be inadequate for 5-point items (i.e., ordinal scale item) which leads to lower reliability for behavioural items (Batista-Foguet, Saris, Boyatzis, Guillén, & Serlavós, Reference Batista-Foguet, Saris, Boyatzis, Guillén and Serlavós2009). However, a recent paper has provided evidence that for agree/disagree (A/D) answer modalities, 5-point Likert scales with all categories labelled lead to better data quality than 7-point response scales (Revilla, Saris, & Krosnick, Reference Revilla, Saris and Krosnick2014). The items used are presented in Appendix A. We collected our data in 2011, prior to the recent Spanish versions: Diener (Reference Diener2014) and Vázquez et al. (Reference Vázquez, Duque and Hervás2013). At that time, we identified major differences between two different versions of the Spanish SWLS and the original English version. Therefore, we assessed the differences and tailored the items to reconcile the differences. Please refer to Appendix B.
We used the standard back-translation technique to ensure that the items that we used were closer to the original English items. The fifth author initially translated the original English-language version of SWLS into Spanish, and this version was then translated back into English by an independent native English translator unaffiliated with the study. The two translators then resolved minor differences that emerged during the back-translation process. The items we used reconciled the differences between the two versions that had existed.
Furthermore, we compared the items we used to those that Diener (Reference Diener2014) presented. We believe that the items, used in this study, add value to Diener’s Spanish SWLS for Items 1, 3, and 4, and are similar to his version for Items 2 and 5. Please refer to Appendix B.
Other measures
To assess the concurrent validity of the scale, we relied on an alternative single-item measure of life satisfaction and measures of the conceptually related constructs of global job satisfaction (van de Ven & Ferry, Reference van de Ven and Ferry1980), satisfaction with own health (also referred to as subjective health), satisfaction with social life (referred to as social life), satisfaction with leisure time (referred to as leisure time), and self-esteem (Loewe, Bagherzadeh, Araya-Castillo, Thieme, & Batista-Foguet, Reference Loewe, Bagherzadeh, Araya-Castillo, Thieme and Batista-Foguet2014). Participants used a 5-point Likert scale to provide their responses. To assess the global level of life satisfaction and job satisfaction, we asked respondents the following questions: ‘In general, how satisfied are you with your life/job?’ respectively.
Stages of data analysis
Our analysis consisted of five stages: analysis of descriptive statistics; confirmatory factor analysis (scale dimensionality); reliability analysis of the SWLS; factorial invariance analysis; and variance and mean comparison across groups. We used the SPSS 23 and LISREL 8.8 packages for data analysis.
Results
Descriptive Statistics
As per Table 2, the mean of each item was between 3 and 4 with a few exceptions: retired (Item 2), housekeeper (Items 2 and 5), and unemployed (Items 1, 2, and 5); these were slightly below 3. Absolute values of skewness and kurtosis were less than or equal to 1, indicating that the univariate normality of all items, across all groups, was within the acceptable level for applying maximum likelihood (ML) Footnote 2 estimation in confirmatory factor analysis (Muthén & Kaplan, Reference Muthén and Kaplan1985). Similarly, the items were considered as normally distributed variables, with skewness smaller than 2 and kurtosis smaller than 7. The data are also tested for multivariate normality. Mardia’s (Reference Mardia1974) test rejected the multivariate normality of the data for all groups as well as for the entire sample. Given the violation of the multivariate normality assumption, we applied Satorra-Bentler chi-square (χ2) (Satorra & Bentler, Reference Satorra, Bentler, von Eye and Clogg1994) to evaluate goodness of fit in confirmatory factor analysis, and consequently, to obtain robust standard error and test statistics. A combination of goodness of fit indices was also used to ensure that non-multivariate normality of data was not an issue in our analyses. We applied goodness of fit index (GFI), non-normed fit index (NNFI), normed fit index (NFI), parsimony normed fit index (PNFI), comparative fit index (CFI), root mean square error of approximation (RMSEA), and standardised root mean square residual (SRMR).
Table 2. Means and Standard Deviations for Items (N = 1479)

Note: () = Standard deviation
Scale dimensionality
Based on differing research findings we examined the scale as a single-factor structure and a two-factor structure. In the two-factor structure, the first three items loaded on the first factor and focus on the present level of satisfaction; whereas Items 4 and 5 loaded on the second factor and assess satisfaction with past accomplishments (Pavot & Diener, Reference Pavot and Diener1993). Upon exploration of modification indices, we identified the need for a modified single-factor structure that allowed error terms of Items 1 and 2 to correlate. Confirmatory factor analysis results for a single-factor structure, modified single-factor structure, and two-factor structure are shown in Table 3.
Table 3. Fit Indices for Single-Factor, Modified Single-Factor, and Two-Factor Structures of the SWLS for the Overall Sample

Notes: df = degrees of freedom; GFI = goodness of fit index; NNFI = non-normed fit index; CFI = comparative fit index; NFI = normed fit index; RMSEA = root mean square error of approximation; SRMR = standardized root mean square residual; PNFI = parsimony normed fit index.
a Satorra-Bentler χ2.
Based on the fit indices and per the combinational rule suggested by Hu and Bentler (Reference Hu and Bentler1999), all models (single-factor, modified single-factor, and two-factor structure) were not rejected and could represent the observed data for the overall sample. Relying on Hu and Bentler (Reference Hu and Bentler1999), all of the fit indices supported the three models (GFI, NNFI, CFI, and NFI > .95; RMSEA < .08; SRMR < .06). In general, the modified single-factor structure best fitted the data (Table 3) Footnote 3 . We therefore selected the modified single-factor structure, allowing the error terms of items 1 and 2 to correlate, as the baseline model for the following factor validity analysis of the SWLS for each group (gender and status).
Confirmatory factor analysis was then applied to assess the goodness of fit of the modified single-factor structure of the SWLS for each group. The results for each group are summarized in Table 4. Overall, the modified single-factor structure of the SWLS fitted the data well for males, females, and all five status groups. The fit indices—including GFI, NNFI, CFI, and NFI—were higher than .96 across all groups and were higher than the recommended cut-off value of .95, providing strong evidence of modified single-factor structure fit for all seven groups. Moreover, the RMSEA (range from 0 to .077) showed a good fit for the modified single-factor structure of SWLS across all seven groups. At the same time, we employed SRMR, which is more sensitive to simple model misspecification than other fit indices (Hu & Bentler, Reference Hu and Bentler1999). The SRMR showed that the fit of the modified single-factor structure was adequate for all groups (range from .012 to .041). In sum, all fit indices represented an adequate fit between the modified single-factor structure of the SWLS and the data, across all groups. In other words, the uni-dimensionality of the 5-item SWLS was confirmed across gender and status.
Table 4. Fit indices for a modified single-factor structurea of the SWLS for each gender and status group

Notes: df = degrees of freedom; GFI = goodness of fit index; NNFI = non-normed fit index; CFI = comparative fit index; NFI = normed fit index; RMSEA = root mean square error of approximation; SRMR = standardized root mean square residual.
a Modified single-factor model with correlation between error terms of Items 1 and 2.
b Satorra-Bentler χ2.
A detailed analysis of factor loadings and R 2 values was performed. All items had standardized factor loadings generally higher than .50 except for students (Item 4: .49 and Item 5: .48) and unemployed (Item 1: .48, Item 4: .49, and Item 5: .44). These findings supported the modified single-factor structure for the overall sample and all groups (Hair, Black, Anderson, & Tatham, Reference Hair, Black, Anderson and Tatham1995). Moreover, the factor loadings represented the same pattern across different groups as well as the overall sample, where the third item showed the highest factor loading (except for the ‘retired’ group) and Item 5 showed the lowest factor loading compared to other items (except for the ‘housekeeper’ group where the lowest factor loading is related to Item 1). This result regarding Item 5 is consistent with the results of previous studies (e.g., Gouveia, Milfont, Da Fonseca, & de Miranda Coelho, 2009; Pavot & Diener, Reference Pavot and Diener1993).
In all groups and in the overall sample, R 2 values ranged from .23 Footnote 4 to .88, exceeding the cut-off value of .20 indicated by Hair et al. (Reference Hair, Black, Anderson and Tatham1995). This indicates a relatively strong linear association between the SWLS construct and its items. In addition, the R 2 pattern was generally the same across the seven groups and the overall sample, where the fifth item showed the lowest R 2 value (except for the ‘housekeeper’ group where the lowest R 2 is related to Item 1) and Item 3 showed the greatest contribution to the SWLS variance (the highest R Footnote 2 value) except for the ‘retired’ group where the greatest R 2 is related to Item 1. This pattern is consistent with recent studies (e.g., Gouveia et al., Reference Gouveia, Milfont, da Fonseca and de Miranda Coelho2009).
Reliability analysis of the SWLS
Reliability analysis of the SWLS was conducted by computing corrected item total correlation, Cronbach’s alpha, and omega coefficients (Ω) for the total sample and for every group. The corrected item-total correlation was higher than .39 (related to Item 4 for the ‘student’ group) for all items in all groups. Correlations were higher than the cut-off value of .25 (Nunnally & Bernstein, Reference Nunnally and Bernstein1994). The corrected item-total correlation was relatively lower for Items 4 and 5 across all groups, consistent with previous studies (e.g., Gouveia et al., Reference Gouveia, Milfont, da Fonseca and de Miranda Coelho2009). Cronbach’s alpha coefficient for the whole sample was .80. As for the groups, it ranged from .68 (for the ‘student’ group) to .84 (for the ‘housekeeper’ group). Overall, these results indicate an adequate reliability for the entire sample as well as for the seven groups (Hair et al., Reference Hair, Black, Anderson and Tatham1995).
The assumption of equality of all factor loadings of the SWLS (i.e., every item contributes equally to the SWLS) was not satisfied. Thus, we applied the omega coefficient (Ω), as another measure of reliability that does not require tau-equivalence. A similar result was seen in the reliability of the entire sample (Ω = .80). Also, the omega coefficients indicated similar reliability estimates for all groups, ranging from .68 to .84. Moreover, Cronbach’s alpha coefficient did not improve if any item was deleted.
Factorial invariance analysis
There are two types of factorial invariance: structural (configural) Footnote 5 and measurement (metric Footnote 6 and scalar Footnote 7 ) invariance. Analysis of structural invariance relates to whether groups have the same factor structure. Analysis of measurement invariance relates to whether groups have the same factor loadings (metric) and the same item intercepts (scalar). We used the following procedure, which is widely applied in the literature (e.g., Atienza et al., Reference Atienza, Balaguer and García-Merita2003; Clench-Aas, Nes, Dalgard, & Aarø, Reference Clench-Aas, Nes, Dalgard and Aarø2011; Wu & Yao, Reference Wu and Yao2006).
Structural invariance. We used the modified single-factor model (see section Scale dimensionality) as our baseline model to test for structural invariance i.e. whether the SWLS factor structure is invariant by gender and status. We tested this model by applying confirmatory factor analysis for every group (see Table 4). We also examined structural invariance using pairwise comparison for gender (Appendix D) and single-routine comparison for status (Appendix C). As per Table 5, Appendix C, and Appendix D, structural invariance held for gender (CFI = .99; RMSEA = .057) and status (CFI = .99; RMSEA = .047), indicating equality of factor structure across groups. Since structural invariance was supported for gender and status, we then moved to the next step, measurement invariance.
Table 5. Structural and Measurement (Metric, Scalar, and Partial Scalar) Invariance between Groups

Notes: * For Items 1, 2, and 5. ** For Items 1, 2, 3, and 5. *** For Items 1, 2, 4, and 5. **** For Items 1 and 3.
Measurement invariance. We examined measurement invariance (metric and scalar) by imposing restrictive constraints (e.g., equality of factor loadings or item intercepts across groups) on the model. Metric invariance relates to whether the groups have the same factor loadings. We constrain the factor loadings of items to be equal across gender and status groups to test for invariance of the factor loadings. Scalar invariance relates to whether the groups have the same item intercepts. The intercepts are forced to be equal to test whether the intercept equality constraint is rejected or not.
For metric and scalar invariance across gender, we conducted pairwise comparison. We applied confirmatory factor analysis to determine whether the factor loading (metric invariance) and item intercept (scalar invariance) equality constraints were rejected. We used the difference between CFI (∆CFI) of models (i.e., between baseline and metric, and between metric and scalar) which is the most reliable global fit index for pairwise comparison (Cheung & Rensvold, Reference Cheung and Rensvold2002; Clench-Aas et al., Reference Clench-Aas, Nes, Dalgard and Aarø2011). A ∆CFI value of less than or equal to .01 would lead to failure to reject invariance across gender (Cheung & Rensvold, Reference Cheung and Rensvold2002). We also checked the RMSEA for major changes to make sure the constrained model still fitted the data well (Clench-Aas et al., Reference Clench-Aas, Nes, Dalgard and Aarø2011). Furthermore, we used the chi-square difference (∆χ2), however, with caution, given the large sample size and the resulting high-power situation. As per Table 5 and Appendix D, metric (ΔCFI = 0; RMSEA = .051) and scalar (ΔCFI = 0; RMSEA = .049) invariance held for gender.
For metric and scalar invariance across status, we conducted a single-routine comparison—comparing all five status groups at the same time. We applied confirmatory factor analysis to determine whether the factor loading and item intercept equality constraints, among all five groups, were rejected. We used the ∆χ2, CFI, and the RMSEA as indices for rejecting metric and scalar invariance (Cheung & Rensvold, Reference Cheung and Rensvold2002). We also checked ∆CFI for major changes. As per Table 5 and Appendix C, metric invariance held for status (∆χ2 = 23.93, nonsignificant; CFI = .99; ∆CFI = 0; RMSEA = .045), indicating that there is no difference between the groups in terms of factor loadings. However, scalar invariance did not hold (∆χ2 = 89.76, p < .001; CFI = .96; ∆CFI = .03; RMSEA = .072), indicating that the intercepts of items are different, at least, between two groups. As a result, we conducted pairwise comparison for all possible status group combinations. This is helpful to better identify the sources of difference among groups and to assess the combinations in depth.
We applied confirmatory factor analysis on group combinations—pairwise comparison—to determine whether the item intercept equality constraints (scalar invariance) were rejected. We used the ∆CFI of models (Cheung & Rensvold, Reference Cheung and Rensvold2002; Clench-Aas et al., Reference Clench-Aas, Nes, Dalgard and Aarø2011) and the RMSEA (Clench-Aas et al., Reference Clench-Aas, Nes, Dalgard and Aarø2011) as fit indices for rejecting scalar invariance. Furthermore, we checked ∆χ2, however, with caution, given the large sample size and the resulting high-power situation. If the hypothesis of scalar invariance (item intercept) was rejected, a partial scalar invariance model would be specified in which one or two intercepts would not be constrained to be equal across groups.
The fit indices for factorial invariance models for gender and all status group combinations are presented in Appendix D. A summary of the findings is presented in Table 5.
Structural and metric invariance held for gender and status. This means that factor structure and loadings could be assumed to be equal. Scalar invariance held for gender but did not hold for status. We thereby conducted pairwise comparison for all combinations of status groups. Pairwise scalar invariance was only supported for four combinations of status groups: ‘student-worker,’ ‘worker-retired,’ ‘worker-housekeeper,’ and ‘retired-housekeeper’. For combinations whose scalar invariance was not supported we checked for partial scalar invariance, item by item, and identified items for which scalar invariance held (Byrne, Shavelson, & Muthén, Reference Byrne, Shavelson and Muthén1989). For example, as per Table 5, the ‘student-retired’ combination had sufficient evidence for structural and metric invariance. However, scalar invariance was not supported for this combination. Upon examination of partial scalar invariance, we identified the intercepts of Items 1, 2, and 5 to be invariant for this combination. Partial scalar invariance held for all combinations whose scalar invariance was rejected. If partial scalar invariance was obtained, a cross-group means comparison could still be made – but with caution (Byrne et al., Reference Byrne, Shavelson and Muthén1989).
SWLS variance and mean: Comparison between groups
Our findings of invariance, metric and scalar (full and partial), allowed us to compare groups for SWLS variance and mean differences. The results indicated equality of variance (∆CFI = 0; RMSEA = .050) and equality of means (∆CFI = 0; RMSEA = .049) across gender. The results of the two-sample t-test supported these findings as well, with no significant difference in variances (F = 2.077, p = .15) and in means (t = 1.086, p = .28). Our results also showed that variances between status groups were equal except for the ‘student-housekeeper’ combination. In this case, we used an adjusted model for the t-test to check for equality of means. Means of SWLS between status groups were equal, except for the ‘student’ group whose mean was greater than those of the ‘retired,’ ‘housekeeper,’ and ‘unemployed’ groups. Please refer to Table 5.
Concurrent validity analysis
To assess concurrent validity, we studied the relationship between SWLS and an alternative single-item measure of global life satisfaction. We also assessed the association between SWLS and the related constructs of subjective health, satisfaction with social life, self-esteem, satisfaction with leisure time, and global job satisfaction. The correlations between SWLS and other variables are summarized in Appendix E. As expected, SWLS was positively and significantly correlated with global life satisfaction with an r ranging from .44 (‘retired’) to .65 (‘housekeeper’) with an average value of .63 for the overall sample. In the total sample and the groups, SWLS was positively and significantly associated with subjective health (ranging from .28 to .40), satisfaction with social life (ranging from .17 to .30), satisfaction with leisure time (ranging from .21 to .36), and self-esteem (ranging from .42 to .60). SWLS was also positively but weakly related to global job satisfaction (r = .11, p = .004).
Discussion
The contribution of this study is threefold. Firstly, we tested the psychometric properties of the Spanish version of the SWLS in the context of Chile. Secondly, we tested the factorial invariance of the Spanish version of the SWLS across gender and different status groups. Thirdly, we provided normative data of the SWLS in the context of Chile to aid in the interpretation of scores on the scale. Table 6 shows the percentiles corresponding to the total score in the SWLS. In this table, we present normative data from the Chilean population for the SWLS based on percentile ranks corresponding to raw scores. We do so for the entire sample and for the status groups, by gender.
Table 6. Normative Data from the Chilean Population for the SWLS Based on Percentile Ranks Corresponding to Raw Scores

Notes: Raw scores were calculated by addition of the five items (range: 5–25); M = male; F = female; () = total number of individuals in the category.
The psychometric properties of the Spanish version of the SWLS were satisfactory in a representative sample of the Chilean population. In this study, through confirmatory factor analysis, our results supported a modified single-factor structure that allowed the error terms of Items 1 and 2 to correlate. We believe, the need for modification is due to item wording (specificity) and not to measurement error. The specific component of Items 1 and 2 is that they use the extreme words ideal and excellent, which are not shared by the other three items (Saris & Satorra, Reference Saris, Satorra, Saris and Gallhofer1987). The wording of items 1 and 2 makes them more similar than they fundamentally are. Based on this result we recommend that future research substitutes these extreme words or allows for correlation among error terms of Items 1 and 2. A consequence of this modification was that the modified single-factor structure had the best fit indices and was more parsimonious than the two-factor structure where we have very high correlation between the two factors. Our result is consistent with Sachs (Reference Sachs2003) who suggested a modified single-factor structure that allowed error terms of items 1 and 2 to correlate due to extreme wording. Comparing both the single- and two-factor models, Sachs (Reference Sachs2003) suggested that the two-factor model with ‘present’ and ‘past’ items was not a better framework with which to interpret the SWLS. Also, in line with previous research (Pavot & Diener, Reference Pavot and Diener1993), this study shows that item five exhibits the weakest item-total correlation and factor loading across all groups and on the overall sample.
Internal reliability coefficients for the total sample and groups were above the acceptable threshold of 0.70 (Hair et al., Reference Hair, Black, Anderson and Tatham1995) and in the range of previous studies (Vassar, Reference Vassar2008), except for the ‘student’ group, where the coefficient was close to the acceptable threshold (α = .68). Items 4 and 5 for this group had the lowest factor loadings (0.49 and 0.48, respectively) and R 2 (.24 and .23, respectively). These two items are related to satisfaction with past achievements (Sachs, Reference Sachs2003; Vautier et al., Reference Vautier, Mullet and Jmel2004). We believe that this lower value of internal reliability, compared to other groups, is due to age. Students have a younger mean age (92.1% were less than 25 years old) than other groups (Table 1) and are therefore expected to have fewer achievements, hence, their answers might be less accurate for Items 4 and 5, leading to higher measurement error. Furthermore, satisfaction is a cognitive assessment of ideals, where the respondent’s reference when answering the questions is the ideal situation (Andrews & McKennell, Reference Andrews and McKennell1980). Therefore, groups with older individuals might assess their satisfaction with less measurement error. The implication of this finding is that the scale might not be appropriate for younger individuals, specifically students, and should be used with caution since satisfaction is a cognitive assessment of ideals and might be impacted by age. However, we have acceptable fit indices for this group, as they were inflated due to its low power resulting from low reliability coefficients.
SWLS was strongly correlated to a single-item measure of life satisfaction in the total sample (r = .63) and in all groups. SWLS was also positively and significantly associated to the related construct of subjective health (r = .35) in the total sample. Several studies have shown that subjective health is strongly correlated with life satisfaction (e.g., Diener, Suh, & Oishi, Reference Diener, Suh and Oishi1997). Regarding the relationship between life satisfaction and job satisfaction of workers, we found a correlation of .11. This association is weak compared to meta-analyses that show a moderate correlation (ranging from .31 to .44) between both constructs (Bowling, Eschleman, & Wang, Reference Bowling, Eschleman and Wang2010). Finally, in our study SWLS was strongly associated with self-esteem (r = .57) for the total sample. Many studies have reported a similar size of this association (Arrindell, van Nieuwenhuizen, & Luteijn, Reference Arrindell, van Nieuwenhuizen and Luteijn2001). For example, Arrindell et al. (Reference Arrindell, van Nieuwenhuizen and Luteijn2001) reported a correlation of .58 in the total sample.
Our results also indicated factorial invariance of the Spanish version of SWLS across gender. This is consistent with the results of other studies that examined the factorial invariance of the SWLS across gender in university students and adults (e.g. Wu & Yao, Reference Wu and Yao2006). Núñez et al. (Reference Núñez, Martín-Albo and Domínguez2010) also found their Spanish version of the SWLS to be invariant across gender in a sample of adults engaged in physical activity. In contrast, using Atienza et al.’s (2000) Spanish version of the scale, Atienza et al. (Reference Atienza, Balaguer and García-Merita2003) found that the SWLS was sensitive to gender in a sample of Spanish junior high school students. These authors found that factor loadings of Items 2 and 5 were not equal for males and females.
As for factorial invariance across status groups, our results indicated that structural and metric invariance hold for a single-routine comparison. This means that the factorial structure and factor loadings of the items are invariant across status groups. However, scalar invariance did not hold for the single-routine comparison. Therefore, we examined scalar invariance across all status group combinations – pairwise comparison. Scalar invariance held for the combinations of ‘worker’ with ‘student,’ ‘retired,’ and ‘housekeeper,’ and for the ‘retired-housekeeper’ combination. This means that for these combinations all item intercepts were invariant. Partial scalar invariance held for the combinations for which scalar invariance was not met. Establishing factorial invariance is a condition for meaningful comparison across groups. Accordingly, we call for caution when comparing mean levels of life satisfaction between those group pairs whose SWLS was only partially invariant in this study.
The results of the current study should be considered in light of several methodological limitations. Firstly, we did not test the discriminant validity of the SWLS. In addition to showing that a measure behaves in a manner that is consistent with the nomological network (concurrent validity), it is also important to show that the measure is distinguishable from other constructs. Secondly, people tend to report greater life satisfaction when interacting directly with another person rather than in an anonymous interview (Schwarz, Strack, Hippler, & Bishop, Reference Schwarz, Strack, Hippler and Bishop1991). In our study, canvassers administered the survey, which may have led to responses that are socially desirable. Thirdly, functional, and to some extent structural, factorial invariance cannot be directly tested using statistical methods. Expert judgments and qualitative methods are best for identifying these forms of non-equivalence (Berry, Poortinga, Segall, & Dasen, Reference Berry, Poortinga, Segall and Dasen2002). Fourthly, the ‘student’ and ‘unemployed’ groups exhibited lower statistical power than other groups and potentially, inflated fit indices. Finally, the generalizability of our findings is restricted to the paper’s context (country: Chile; groups: gender and status). We recommend that future research tackles these limitations through samples that include a larger number of students and unemployed; ideally from different countries.
Appendix A
Spanish version of the SWLS items used to collect data

Appendix B
Comparative table: Different versions of the SWLS
Appendix C
Fit indices for different factorial invariance models based on a single-routine comparison between all status groups

Appendix D
Fit indices for different factorial invariance models based on a pairwise comparison between groups

Appendix E
Mean, standard deviation, and correlation for variables used for concurrent validity analysis


