


One of the main insights in contemporary social science is that no man is an island (Flap, Reference Flap, Favereau and Lazega2002); this includes CEOs. Regardless of their hierarchical position in the firm, CEOs are social actors embedded in a network that influences their strategic decisions (Brass, Reference Brass and Kozlowski2012). According to social capital theory, this network becomes a critical resource for the members facilitating the actions of certain individuals within that social structure (Coleman, Reference Coleman1994). Additionally, it is a unique strategic resource, and difficult to imitate for competitors (Rodrigo-Alarcón et al., Reference Rodrigo-Alarcón, García-Villaverde, Ruiz-Ortega and Parra-Requena2018). The sum of the current and potential resources embedded within, available through, and derived from that network is entitled social capital (Nahapiet & Ghoshal, Reference Nahapiet and Ghoshal1998).
Specifically, CEOs obtain two benefits through their social capital: Strategic information and access to scarce resources (Blyler & Coff, Reference Blyler and Coff2003; Knoke, Reference Knoke, Leenders and Gabbay1999). Nonetheless, the information and the resources are useless without a set of organizational capabilities that transform them into competitive advantages. Thus, beyond searching for resources, CEOs must foster the development of organizational capabilities, especially dynamic capabilities.
Dynamic capabilities are the “capacities of an organization to create, extend or modify its resource base intentionally” (Helfat et al., Reference Helfat, Finkelstein, Mitchell, Peteraf, Singh, Teece and Winter2009, p. 1). According to this approach, the source of the advantages in the market is the capability of the firm to create new resources and to extend and transform existing resources. Hence, from the dynamic capabilities approach, the mode of the transformation of resources determines their value (Wójcik, Reference Wójcik2015). Scholars have determined the positive effects of these capabilities for the firms. These capabilities allow them to increase firm performance (Bitencourt et al., Reference Bitencourt, de Oliveira Santini, Ladeira, Santos and Teixeira2019; Fainshmidt et al., Reference Fainshmidt, Pezeshkan, Frazier, Nair and Markowski2016), competitive advantages (Di Stefano et al., Reference Di Stefano, Peteraf and Verona2014; Peteraf et al., Reference Peteraf, Stefano and Verona2013), external fitness (Helfat & Peteraf, Reference Helfat, Finkelstein, Mitchell, Peteraf, Singh, Teece and Winter2009), firm survival (Dixon et al., Reference Dixon, Meyer and Day2014), and innovation outcomes (Mitchell & Skrzypacz, Reference Mitchell and Skrzypacz2015). However, although organizational benefits of dynamic capabilities have been reported, their origins are unclear. Consequently, scholars have focused on exploring their sources (Bitencourt et al., Reference Bitencourt, de Oliveira Santini, Ladeira, Santos and Teixeira2019; Helfat et al., Reference Helfat, Finkelstein, Mitchell, Peteraf, Singh, Teece and Winter2009; Hodgkinson & Healey, Reference Hodgkinson and Healey2011; Kurtmollaiev, Reference Kurtmollaiev2017; Salvato & Vassolo, Reference Salvato and Vassolo2014).
In these settings, CEO social capital has evidenced a positive relationship with dynamic capabilities (e.g., Chu et al., Reference Chu, Feng and Lai2018; Debrulle et al., Reference Debrulle, Maes and Sels2014); however, results are inconclusive. Several authors have revealed positive effects since it allows access to strategic information and scarce resources that the competition cannot go without (Acquaah, Reference Acquaah2007; Zhu et al., Reference Zhu, Su and Shou2017). Nonetheless, results have wide unexplained heterogeneity. Correlations reported vary from zero (e.g., Boso et al., 2013; Chen et al., Reference Chen, Chang and Lee2015;Wei et al., Reference Wei, Hou, Wang and Wang2011) to .6 (e.g., Mudalige et al., Reference Mudalige, Ismail and Malek2016; Rodrigo-Alarcon et al., Reference Rodrigo-Alarcón, García-Villaverde, Ruiz-Ortega and Parra-Requena2018; Yu et al., Reference Yu, Lu, Li, Lin and Shapira2019). Consequently, there is a gap concerning the correlation of CEO social capital with dynamic capabilities, and the moderator variables that explain the heterogeneity in the results.
The synthesis of results and the exploration of heterogeneity in the findings can be solved by meta-analytic strategies. Meta-analysis allows the integration of results in the literature and to explore new hypotheses that have not previously been included in primary research (Sartal et al., Reference Sartal, González-Loureiro and Vázquez2021). Additionally, it is useful to explore the heterogeneity in the results of primary studies (Carlson & Ji, Reference Carlson and Ji2011; Sartal et al., Reference Sartal, González-Loureiro and Vázquez2021). As a result, the present study integrates the findings regarding the association between CEO social capital and dynamic capabilities estimating an overall correlation, and explores a set of moderators proposed in the literature.
We have detected a set of moderators in the literature and tested their effects on the correlations. The list of these moderators was created using the same papers selected in the meta-analysis. In these papers, a number of possible moderators were proposed by their authors and we tested them using information reported in the same papers or by adding external information. Moderators identified were classified in levels from macro to micro. Macro variables are further separated from CEOs and micro variables are related with their individual social capital. In order, moderators proposed are variables at the country level (Gu et al., Reference Gu, Hung and Tse2008; Lee & Law, Reference Lee and Law2017), the environment at the firm level (Gu et al., Reference Gu, Hung and Tse2008), characteristics of the firm (Lu et al., Reference Lu, Zhou, Bruton and Li2010), and CEO social capital variables (Li et al., Reference Li, Poppo and Zhou2008; Phelps et al., Reference Phelps, Heidl and Wadhwa2012; Zhou et al., Reference Zhou, Li, Sheng and Shao2014). Finally, we explore two methodological variables: the year of publication and sampling.
In summary, we intend in this paper to offer four main contributions to the microfoundations literature. First, we estimate the correlation between CEO social capital and dynamic capabilities using the primary studies reported in the literature. This estimation offers support to positive correlations between these variables. Secondly, we test a set of moderators that explain a percentage of the heterogeneity in the results. We aim to explain 60.67% of the heterogeneity of the results; this contribution would allow us to expand current understanding of the contextual conditions that control the relationship between CEO social capital and dynamic capabilities. Third, we offer support to the microfoundations approach in its effort to explore the sources of dynamic capabilities. Findings show that CEO social capital is a relevant variable in the explanation of the development of dynamic capabilities. It is a trigger of the causal mechanism to pursue the articulation of those capabilities. Finally, this paper highlights the social nature of management activities which are always evolved in a social context.
In the following sections, we describe the concept of dynamic capabilities, their sources, and the role of CEOs using the model of Bendig et al. (Reference Bendig, Strese, Flatten, da Costa and Brettel2018). After that, we describe the concept of social capital, its relationship with dynamic capabilities, the moderator proposed, the methodological details, results, and the implications to the literature.
Literature Review
Dynamic Capabilities
Organizational capabilities are divided into two types: ordinary and dynamic capabilities. Ordinary capabilities are related to the technical functions which are necessary to carry out the tasks of within the organization, such as those concerned with administration, operations, and governance. They transform resources into products or services but they cannot create new resources or change organizational processes. As such, ordinary capabilities are not a source of competitive advantages. Additionally, they are easily measurable because they are assessed via effectivity and efficacy indicators (Teece, Reference Teece2014).
In contrast, dynamic capabilities allow the creation, modification, or extension of firm resources (Helfat et al., Reference Helfat, Finkelstein, Mitchell, Peteraf, Singh, Teece and Winter2009). They are classified into three types: Sensing, seizing, and reconfiguration (Teece, Reference Teece2007). Sensing refers to the capacity to scan the organizational environment; in other words, being able to accumulate and filter information from the environment “to create a conjecture or a hypothesis about the likely evolution of technologies, customer needs, and marketplace responses” (Teece, Reference Teece2007, p. 1323). Seizing involves the mobilization of resources to address needs and opportunities and to capture value from doing so (Teece, Reference Teece2014, p. 332); in other words, developing and selecting business opportunities that fit with the organization’s environment and its strengths and weaknesses (Teece, Reference Teece2007). Finally, reconfiguration is the “ability to recombine and to reconfigure assets and organizational structures as the enterprise grows, and as markets and technologies change” (Teece, Reference Teece2007, p. 1335). It includes enhancing, combining, protecting, and reconfiguring business assets. It is characterized by the actual realization of strategic renewal within the organization through the new organization of resources, structures, and processes (Teece, Reference Teece2007).
Sources of Dynamic Capabilities
Salvato and Vasolo (Reference Salvato and Vassolo2014) note that scholars have proposed two approaches to study the sources of dynamic capabilities: The organizational-level approach and the microfoundations approach. In terms of the former, dynamic capabilities are the outcome of several organizational variables such as access to resources, knowledge management strategies, and institutional alliances (Bitencourt et al., Reference Bitencourt, de Oliveira Santini, Ladeira, Santos and Teixeira2019). On the other hand, the microfoundations approach highlights individual-level activity and the patterns of collective action as the source of dynamic capabilities.
When these two explanations are compared, the microfoundations approach offers theoretical advantages in terms of explaining the sources of dynamic capabilities (Barney & Felin, Reference Barney and Felin2013; Ployhart & Hale, Reference Ployhart and Hale2014). First, organizational-level explanations overlook the fact that behind each organizational variable there is a micro-founded phenomenon (Bendig et al., Reference Bendig, Strese, Flatten, da Costa and Brettel2018). The roots of dynamic capabilities are in the psychological (Hodgkinson & Healey, Reference Hodgkinson and Healey2011) and social interactions between individuals (Salvato & Vassolo, Reference Salvato and Vassolo2014). Organizational-level variables described as predictors of dynamic capabilities hinder micro-founded mechanisms; hence, we must explore the sources of dynamic capabilities in individuals and social interactions, not only in organizational variables (Kurtmollaiev, Reference Kurtmollaiev2017).
Second, organizational-level explanations do not solve the problem of agency; in other words, where are the organizational capabilities (Kurtmollaiev, Reference Kurtmollaiev2017). Organizational-level explanations suppose that dynamic capabilities are actions deployed by a firm; however, they are a reification of the concept of organization that bypasses the collective process behind dynamic capabilities (Salvato & Vassolo, Reference Salvato and Vassolo2014). In contrast, the microfoundations approach recognizes individual resources and social interactions as the building blocks of organizational dynamic capabilities (Felin et al., Reference Felin, Foss and Ployhart2015; Miron-Spektor et al., Reference Miron-Spektor, Ingram, Keller, Smith and Lewis2018; Ployhart & Hale, Reference Ployhart and Hale2014; Teece, Reference Teece2007).
Based on these arguments, in this paper we use the microfoundations approach to study the relationship between CEO social capital and dynamic capabilities. In this approach, it is crucial to demarcate the role of the CEOs in the development of these special firm capabilities.
Role of the CEOs in the Development of Dynamic Capabilities
As per the microfoundations literature, CEOs cannot create dynamic capabilities; they are merely organizational agents with power and influence who trigger the causal mechanisms that generate dynamic capabilities. The role of the CEOs focuses on fostering the interactions among organizational resources (Bendig et al., Reference Bendig, Strese, Flatten, da Costa and Brettel2018).
As Adner and Helfat (Reference Adner and Helfat2003) state, CEOs are in possession of individual resources which can be used to benefit their organizations. Among these resources, CEO social capital facilitates access to unique strategic information at a low cost and the control of scarce resources. The information and the access to resources trigger managerial actions that mobilize firm resources, changing the conditions under which employees work. Thus, CEOs create settings of interaction among employees facilitating the development of dynamic capabilities. Figure 1 depicts the causal mechanism.
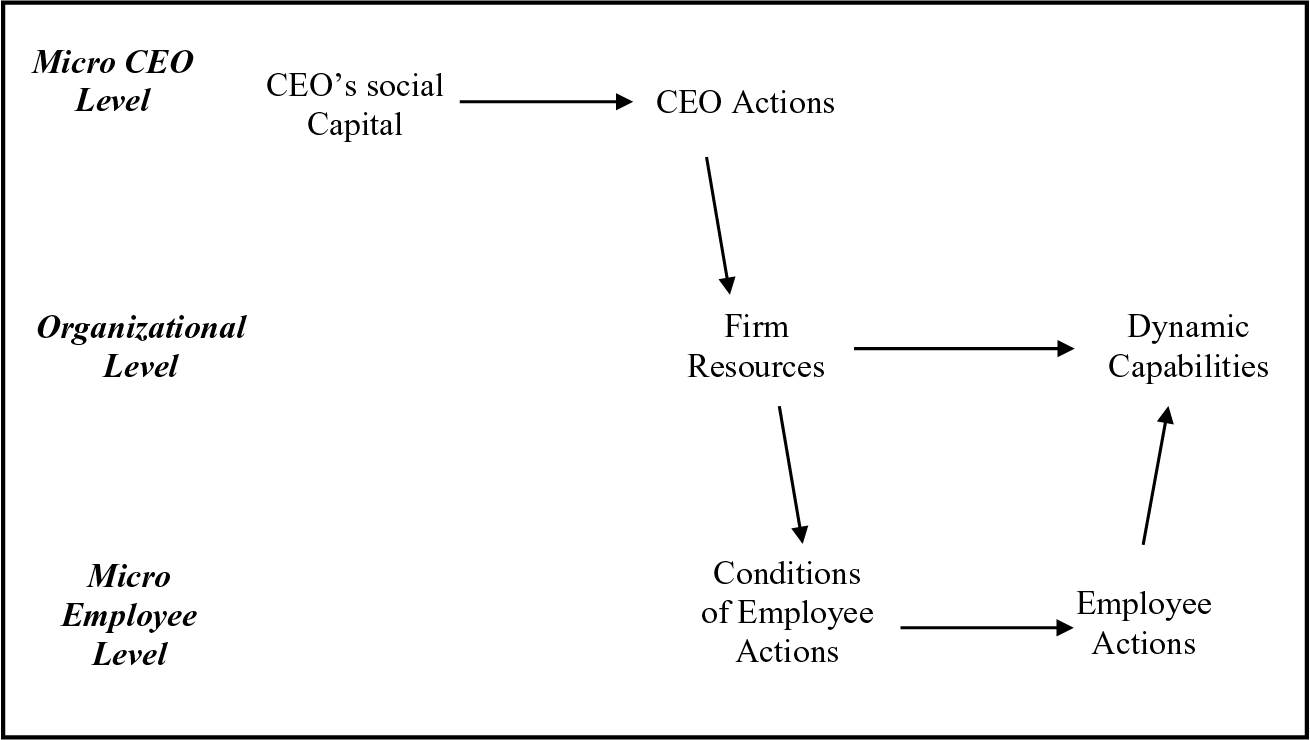
Figure 1. Model of Bendig et al. (Reference Bendig, Strese, Flatten, da Costa and Brettel2018)
Note. It is an extension of the model of Bendig et al. (Reference Bendig, Strese, Flatten, da Costa and Brettel2018). In this model the CEO variable is the social capital.
From the model of Bendig et al. (Reference Bendig, Strese, Flatten, da Costa and Brettel2018), it follows that CEOs use their social capital to trigger the underlying mechanism that support dynamic capabilities. When CEOs receive strategic information or have access to scarce resources, they drive their managerial actions to incentivize resource complementarity and the emergence of coordinated actions among firm members. In this coordination among resources arises dynamic capabilities which pursue the exploitation of the information or resources obtained by the CEO. Coordination is the outcome of the social interactions among firm employees. In the absence of strategic information or access to scarce resources, there are no drivers to start the development of dynamic capabilities, therefore, CEO social capital is a trigger of new dynamic capabilities. Subsequently, we expand the concept of social capital and highlight its strategic value.
Social Capital
The concept of social capital has been explored in many academic disciplines such as sociology, economics, and social psychology (Lin et al., Reference Lin, Cook and Burt2017). It can be defined as “the sum of the actual and potential resources embedded within, available through, and derived from the network of relationships possessed by an individual or social unit” (Nahapiet & Ghoshal, Reference Nahapiet and Ghoshal1998, p. 243). Social capital comprises both networks and assets that may be mobilized through the network in question. Social units might be individuals (Burt, Reference Burt2000), communities (Putnam, Reference Putnam2001), nations (Fukuyama, Reference Fukuyama1995), or organizations (Nahapiet & Ghoshal, Reference Nahapiet and Ghoshal1998). Regardless, in all cases, social units obtain access to advantages, resources, or preferential information for being part of the network.
Putnam (Reference Putnam2001) classifies social capital in two forms: Bonding and bridging. In bonding social capital, units are strongly homogeneous and promote common goals, shared identities, and access to tacit knowledge (Edelman et al., Reference Edelman, Bresnen, Newell, Scarbrough and Swan2004). Bonding social capital is configured by friends, family, and every social unit with strong ties. On the other hand, bridging is composed of weak, heterogeneous, and divergent ties (Putnam, Reference Putnam2001). To elaborate, bridging refers to connections with social ties with divergent political ideas, cultural practices, and social contexts. Indeed, bonding improves cohesion between social ties and access to specialized knowledge, whereas bridging enables connections with different social units, creating innovative tensions and generating new knowledge (Lee et al., Reference Lee, Tuselmann, Jayawarna and Rouse2019).
The strategic value of social capital has been extensively reported. CEOs use their social connections to reap organizational benefits (Adner & Helfat, Reference Adner and Helfat2003) embedded in social networks (Abosag & Naudé, Reference Abosag and Naudé2014; Brass, Reference Brass and Kozlowski2012; Geletkanycz & Hambrick, Reference Geletkanycz and Hambrick1997; Uzzi, Reference Uzzi1997). CEO social capital generates strategic value because it is a source of strategic information and access to scarce resources that can be transformed to provide advantages for the firm (Adner & Helfat, Reference Adner and Helfat2003; Knoke, Reference Knoke, Leenders and Gabbay1999). Consequently, CEOs obtain organizational benefits to be part of those networks (Johnson, Reference Johnson2013).
In terms of informational benefits, CEO social capital offers strategic information to interpret the environment that decreases the level of uncertainty in the decision making (Peng & Luo, Reference Peng and Luo2000). CEOs gain quick access to reliable information at low costs, allowing them to sense potential opportunities (Kemper et al., Reference Kemper, Schilke and Brettel2013). Through CEOs’ networks, organizations exchange and combine information, creating new knowledge for their own benefit (Ling-Yee, Reference Ling-Yee2010). Furthermore, networks provide a highly efficient process in the screening of information so that the most relevant and valuable information is received (Nahapiet & Ghoshal, Reference Nahapiet and Ghoshal1998).
In addition, organizations obtain access to resources using CEO social capital. Without resources, the sensing of opportunities will always remain just an opportunity (Chen & Wu, Reference Chen and Wu2011). On the other hand, CEO social capital can facilitate innovation by providing access to scarce resources (Lin, Reference Lin2001). Using this social capital, CEOs can acquire essential external resources and facilitate innovation (Zhang & Li, Reference Zhang and Li2010). Further, CEO social capital plays a role in acquiring resources such as hiring competent employees, availing intellectual resources, and finance (Shane & Cable, Reference Shane and Cable2002).
Based on these arguments, CEO social capital enables organizations to obtain strategic information and access scarce resources to trigger the mechanism described by Bendig et al. (Reference Bendig, Strese, Flatten, da Costa and Brettel2018). CEO social capital also influences the managerial actions performed, thus encouraging the articulation of dynamic capabilities to seize the strategic information and the scarce resources in the market. This leads to the following hypothesis.
H 1: There is a positive relationship between CEO social capital and dynamic capabilities.
Moderator Variables
Although the expected association between CEO social capital and dynamic capabilities is positive, there is substantial variability in the results. Hence, CEO social capital requires a contextual approach that highlights the conditions that control these correlations. We have organized the moderators from macro to micro variables according to the closeness of the CEO. Figure 2 depicts the moderators and the set of hypotheses.
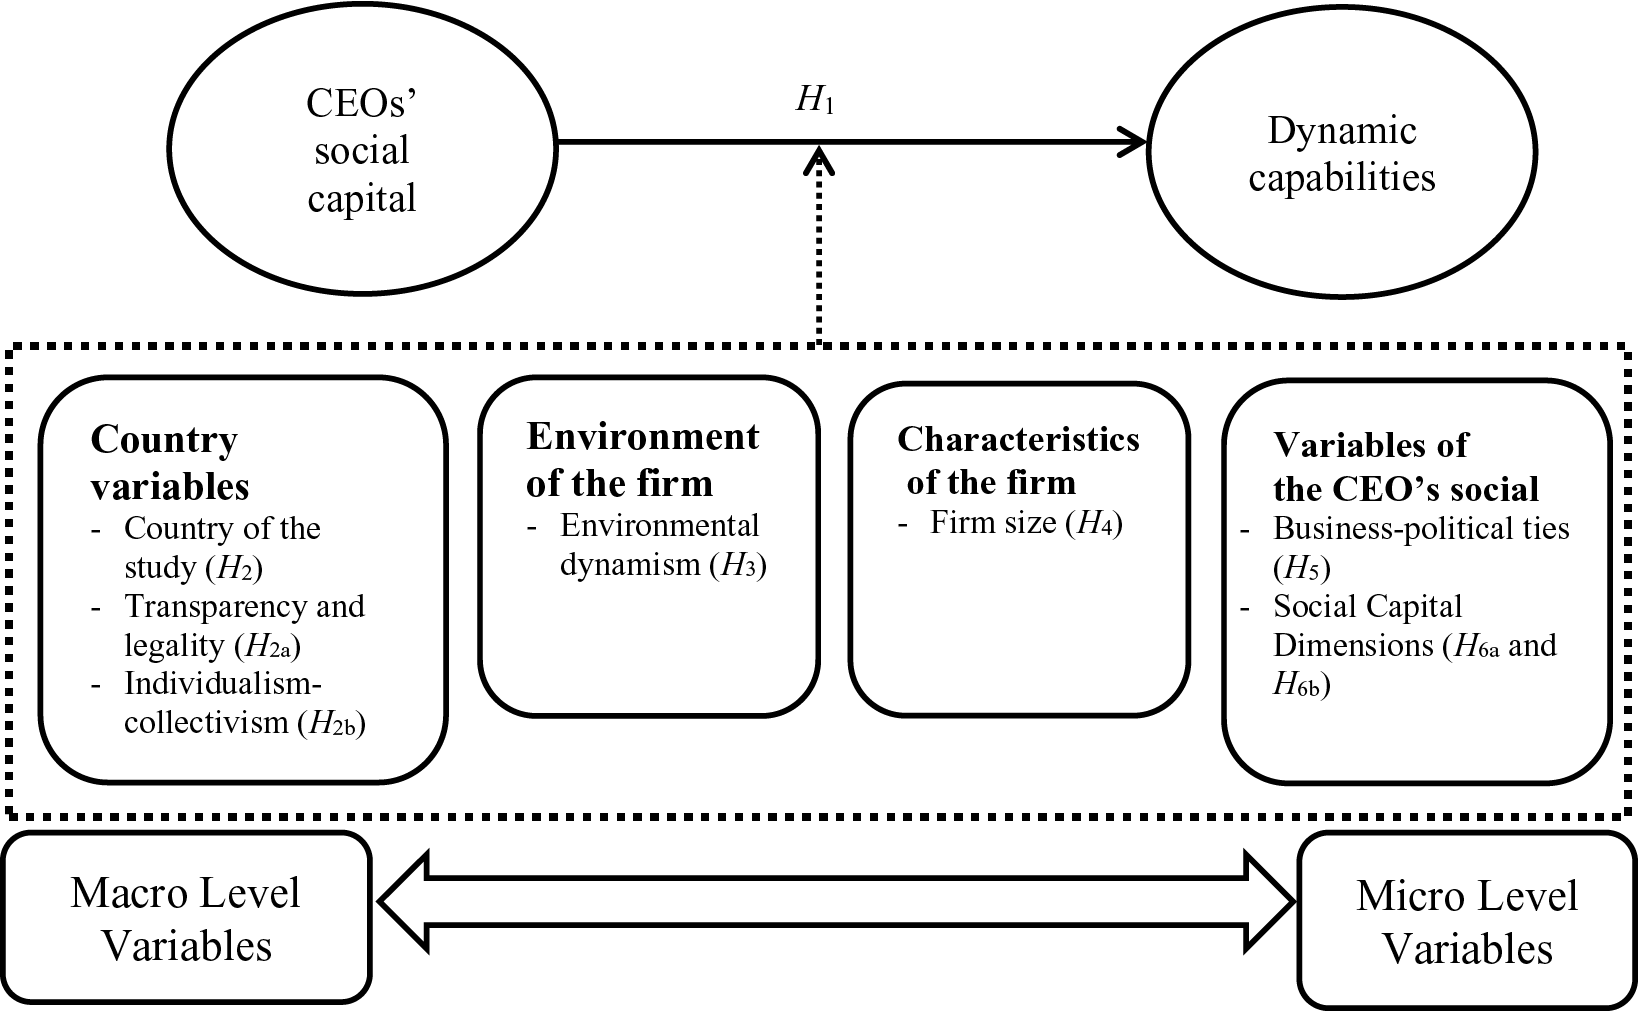
Figure 2. Research Model
Note. Moderators are organized from macro to micro variables. Macro variables are farther to CEOs. Dot line represents the moderator effect.
Country Variables
To study the effect of the country, we have proposed an overall hypothesis, including two sub-hypotheses. The overall hypothesis states that countries in the studies have their differences, while the sub-hypotheses test social practices and the values that explain the differences among countries.
Country. Among countries, there are differences in the social capital built. The social capital of the country is related to the innovative activity because countries with higher social capital have trust in their institutions, higher cooperation in the community, and a willingness to share information (Lee & Law, Reference Lee and Law2017). Social capital also increases altruistic preferences in the population (Javakhadze et al., Reference Javakhadze, Ferris and French2016). Additionally, the relevance of social capital among countries is different because of the existence of diverse beliefs and social practices (Luo et al., Reference Luo, Huang and Wang2012). For instance, in China, social capital is a powerful cultural practice with a special name: Guanxi. This term refers to particular interpersonal ties, which are cultivated and maintained through trust, obligation, and reciprocity (Guo & Miller, Reference Guo and Miller2010). Guanxi has a pervasive influence in business and is a critical determinant of firm survival, growth, and performance (Luo et al., Reference Luo, Huang and Wang2012). In comparison to social capital in Western cultures, guanxi denotes mandatory relationships that the ties have to provide. The principles of guanxi are driven by morality and social norms, whereas the principles of relationships in the West are driven by the law and rules of behavior (Wang, Reference Wang2007).
Based on these arguments, we expect different correlations among countries. We thus propose the following hypothesis:
H 2: The strength of the correlation between CEO social capital and dynamic capabilities among countries will be different.
Individualism-collectivism. A characteristic associated with social capital is the extent of individualism compared to collectivism in the culture (Acquaah, Reference Acquaah2007). According to Hofstede (Reference Hofstede2011), individualism and collectivism have opposing societal characteristics; “On the individualist side, ties between individuals are loose: Everyone is expected to look after him/herself and his/her immediate family. On the collectivist side, people from birth onwards are integrated into strong, cohesive in-groups, often extended families that protect them in exchange for unquestioning loyalty, and oppose other in-groups” (Hofstede, Reference Hofstede2011, p. 11).
Acquaah (Reference Acquaah2007) highlights the enhanced effect of social capital in collectivistic cultures indicating that they have strong relationships with local community leaders (e.g., chiefs, kings, priests, and industry leaders), providing substantial resource allocation and information dissemination roles. People in collectivist cultures, such as China, Italy, Israel, and South Korea, draw on family and friends as important social resources; this is also true of Latin cultures in which family ties constitute a vital social resource (Gu et al., Reference Gu, Hung and Tse2008). Similarly, Viswanathan et al. (Reference Viswanathan, Sridharan and Ritchie2010) identified that local market information sharing is a community activity that is more likely to occur in collectivist societies.
Conversely, the role of social capital is more dampened in individualistic cultures because the use of social networks for reaping advantages is unprompted. Using social ties to facilitate the ascertainment of advantages, resources, or information is an undervalued practice (Luo et al., Reference Luo, Huang and Wang2012). Consequently, we propose the following hypothesis:
H 2a: In countries with higher individualism, the relationship between CEO social capital and dynamic capabilities will be weaker.
Perception of transparency and legality. Business environments perceived as opaque, with weak legal and regulatory institutions, and underdeveloped markets are characterized by relatively high uncertainty in terms of the actions and decisions taken by CEOs (Acquaah, Reference Acquaah2007). As Peng and Luo (Reference Peng and Luo2000) reveals, social capital enables people to face uncertainties in developing countries. In countries perceived as less transparent, social ties and networks are relevant because they are a mechanism for obtaining information and resources via bypassing prevailing legal and regulatory inadequacies. Thus, the importance of social capital is enhanced in non-transparent or non-regulated cultural contexts.
In countries with underdeveloped or unclear rules for business, social interactions can provide information and opportunities, whereas in countries with strong institutions the rules are controlled by the regulatory agents. On this basis, we propose the following hypothesis:
H 2b: In countries with higher perceived transparency and legality, the relationship between CEO social capital and dynamic capabilities will be weaker.
Environment of the Firm
In a second level we describe the environment into the firm is embedded describing the concept of environmental dynamism.
Environmental Dynamism. This is defined as the degree and the instability of changes in a firm’s competitive environment (Simerly & Li, Reference Simerly and Li2000). It is also a source of uncertainty for CEOs. Highly dynamic environments are characterized by fast technological change, higher spending on research and development (R&D), and more knowledge workers. Where there are rapid technological improvements in industry, technological turbulence can “reallocate opportunities, shift industrial standing, and redistribute power in the industries and among members in a network” (Gu et al., Reference Gu, Hung and Tse2008, p. 18). In highly dynamic environments, ideas can emerge that disrupt the market (Simerly & Li, Reference Simerly and Li2000), thus changing the industrial structure.
Higher environmental dynamism increases perceived uncertainty. As a result, CEO social capital is a tool to cope with this perceived uncertainty and subsequently gain competitive advantages (Peng & Luo, Reference Peng and Luo2000). CEOs require reliable information and their networks may offer this. CEO social capital provides selective information about the business environment that facilitates the decision-making process (Debrulle et al., Reference Debrulle, Maes and Sels2014). In other words, in turbulent environments, CEO social capital can be a relevant mechanism for acquiring the information and resources required to overcome environmental difficulties (Kemper et al., Reference Kemper, Schilke and Brettel2013). Thus, the following hypothesis is proposed
H 3: In higher environmental dynamism, the relationship between CEO social capital and dynamic capabilities will be stronger.
Characteristics of the Firm
Here, we propose that firm size can moderate the relationship between CEO social capital and dynamic capabilities.
Firm Size. The impact of CEO social capital could differ according to firm size. In large firms, CEO social capital could be increased by other sources such as organizational social capital. Organizations acquire social capital based on their brand recognition and reputation which intensifies the number of ties and the reputation of their CEO (Lu et al., Reference Lu, Zhou, Bruton and Li2010). Moreover, large firms have other sources of social capital such as employees and managerial teams.
In contrast, small and medium enterprises (SMEs) use CEO social capital as their sole source of information and resources (Hernández-Carrión et al., Reference Hernández-Carrión, Camarero-Izquierdo and Gutiérrez-Cillán2017). Furthermore, SMEs exploit CEO social ties for strategic information and resources in the absence of other sources. Thus, we propose the following hypothesis:
H 4: In large firms, the relationship between CEO social capital and dynamic capabilities will be stronger than SMEs.
Variables of CEO Social Capital
These variables examine two characteristics of CEO social capital: The source of the social capital and the social capital dimension. Specifically, we compare two sources of social capital, namely business and political ties, and three social capital dimensions, namely structural, relational, and cognitive.
Source of the Social Capital. Scholars have studied two main sources of social capital: Business and political ties. Business ties are horizontal relationships between CEOs and other units involved in business transactions such as suppliers, buyers, and other CEOs. In contrast, political ties are vertical (hierarchical) relationships with governments, politicians, and regulatory authorities (Park & Luo, Reference Park and Luo2001).
Business ties are informal business-to-business networks that facilitate the obtaining of information and scarce resources, reduce uncertainties, and gain legitimacy via network members (Acquaah, Reference Acquaah2007; Chung et al., Reference Chung, Wang, Huang and Yang2016). Business ties serve as conduits for acquiring information about the current situation in the market, as well as sensing future opportunities and industry trends (Chung, Reference Chung2012), and provide access to information that is timely, relevant, and reliable (Sheng et al., Reference Sheng, Zhou and Li2011), therefore incentivizing knowledge transfer and technological acquisition (Li et al., Reference Li, Poppo and Zhou2008; Zhou et al., Reference Zhou, Li, Sheng and Shao2014). Such ties also induce cooperative norms in the solving of problems that concomitantly lead to reducing transaction costs, contractual disputes (Khanna & Rivkin, Reference Khanna and Rivkin2001; Sheng et al., Reference Sheng, Zhou and Li2011), and opportunism (Zhu et al., Reference Zhu, Su and Shou2017), while facilitating access to critical resources (Chen & Wu, Reference Chen and Wu2011).
In contrast, political ties represent the networks of a CEO with political leaders, as well as regulatory and supporting organizations within the government (Chung et al., Reference Chung, Wang, Huang and Yang2016). Political ties are more instrumental and utilitarian than cooperatives. This implies that CEOs will proactively seek to establish networks with political leaders to reap advantages in terms of resources, preferential treatment, and timely government approvals (Chen & Wu, Reference Chen and Wu2011). These ties offer access to financial resources, bank loans, and low-interest rates, in addition to human resources controlled by authorities (Li et al., Reference Li, Poppo and Zhou2008), governmental information about industrial changes or strategic information about policy changes and reforms (Chen & Wu, Reference Chen and Wu2011), and access to government plans (Park & Luo, Reference Park and Luo2001). Moreover, political ties enable organizations to gain political legitimacy (Sheng et al., Reference Sheng, Zhou and Li2011) and avoid uncertainty by accessing preferential information, favorable treatment, and security vis-à-vis access to scarce resources (Chung et al., Reference Chung, Wang, Huang and Yang2016).
From social capital theory, the business ties are an example of bonding linking, whereas political ties represent bridging linking. In business ties, CEOs are embedded in the network to maintain business transactions, cooperation, and coordination. On the other hand, political ties are located outside of the network of the business transactions; they are instead links with utilitarian interests. Consequently, these two types of ties offer different benefits for the firm; relationships with business ties pursue cooperation and transmission to information among members, and political ties pursue benefits from the government. As the mechanism described by Bendig et al. (Reference Bendig, Strese, Flatten, da Costa and Brettel2018) requires the information of the environment to be a trigger, it is expected that business ties obtain stronger correlations than political ties because they acquire more information on the environment. We therefore propose the following hypothesis:
H 5: The relationship between CEO social capital and dynamic capabilities will be stronger when environmental information will be obtained from business ties rather than political ties.
Social Capital Dimension. Nahapiet and Ghoshal (Reference Nahapiet and Ghoshal1998) proposed that social capital can be grouped into three complementary dimensions: Structural (network size and diversity in the network), relational (trust and norms), or cognitive (language, codes, and narratives shared). In this paper, we compare these social capital dimensions because they offer dissimilar information.
The structural dimension denotes the configuration of the links among the units (Burt, Reference Burt2000). In the structural dimension, social units are either linked or unlinked, but the quality of the links is irrelevant. On the other hand, the relational dimension describes the kind of relationship between units (Nahapiet & Ghoshal, Reference Nahapiet and Ghoshal1998). This refers to the perceived quality of such relationships (Moran, Reference Moran2005). Social ties develop different links between themselves, and they can be labelled as friendship, trust, loyalty, and benevolence (Wu, Reference Wu2008). These names, and their associated emotions, emerging through the history of social interactions, cannot be bought, traded, or transferred because they have been developed over a long period of time. Positive relationships among ties characterized by friendship and trust provide the diffusion of new and valuable information (Vlaisavljevic et al., Reference Vlaisavljevic, Cabello-Medina and Pérez-Luño2016), increase the disposition to share and receive knowledge, enable access to strategic information (Phelps et al., Reference Phelps, Heidl and Wadhwa2012), and reduce opportunistic behaviors among partners.
Accordingly, the structural dimension may produce lower correlations because it does not offer information about the quality of the relationship. This argument leads to the following hypothesis.
H 6a: The relationship between CEO social capital and dynamic capabilities will be weaker in the structural than the relational dimension.
Additionally, the cognitive dimension refers to the shared interpretations of the world among social units. They have common signs, codes, and narratives that provide shared meanings (Nahapiet and Ghoshal, Reference Nahapiet and Ghoshal1998). When social units have shared goals, they develop similar approaches to tasks, promoting the interchange of ideas and integrating their knowledge (Parra-Requena et al., Reference Parra-Requena, Ruiz-Ortega and García-Villaverde2013).
The cognitive dimension supposes shared goals and cultural practices that increase cooperation and reduce conflicts (Nahapiet & Ghoshal, Reference Nahapiet and Ghoshal1998); CEOs may gain higher benefits from cognitive social capital because their ties pursue the same goals and so they are willing to share information to achieve these goals. In addition, communication is easier because CEOs share cultural practices with social units in the network. Cognitive social capital promotes mutual understanding and the exchange of ideas and resources (García-Villaverde et al., Reference García-Villaverde, Rodrigo-Alarcón, Ruiz-Ortega and Parra-Requena2018). As a result, the cognitive social capital dimension may exhibit stronger correlations than its relational counterpart because it catches additional information that the latter does not identify. These arguments lead to the following hypothesis:
H 6b: The relationship between CEO social capital and dynamic capabilities will be weaker in the relational than the cognitive dimension.
Figure 2 summarizes the conceptual model proposed.
Method
Sample
We used the Web of Science, Scopus, EBSCO (Business search complete), ProQuest, and Google Scholar databases to examine academic papers in the area of business and management published before January 31, 2021. In Google Scholar, we selected the first 500 search results, ordered by relevance. In each database, we filtered by title, abstract, and keywords. We decided to exclude unpublished papers because they had not gone through a peer review process and their quality was thus unknown. According to Dalton et al. (Reference Dalton, Aguinis, Dalton, Bosco and Pierce2012), excluding such studies does not influence subsequent findings.
Subsequently, we describe the equation used in the search:
(‘social capital’ OR ‘managerial social capital’ OR ‘networking capability’ OR ‘social ties’ OR ‘social networking’ OR ‘managerial networking’ OR ‘ties managers’ OR ‘organizational networking’ OR ‘political ties’ OR ‘business ties’) AND (‘organizational strategy’ OR ‘competitive advantage’ OR ‘renewal’ OR ‘dynamic capabilities’ OR ‘strategic decision’ OR ‘pioneering advantage’ OR ‘absorptive capacity’ OR ‘exploitation’ OR ‘exploration’ OR ‘strategic adaptation’).
This search identified 1951 papers that were filtered in two steps. First, we read titles, abstracts, and the methodological section to identify studies that employed a quantitative approach and reported measures of CEO social capital and dynamic capabilities. We dropped the measures of the top management teams focusing on CEO measures. In this selection, the definition of dynamic capabilities proposed by Helfat et al. (Reference Helfat, Finkelstein, Mitchell, Peteraf, Singh, Teece and Winter2009) was used as a conceptual reference; therefore, we include capabilities to create, extend, or modify resources. All measures of ordinary capabilities were not taken into account. At the end of this filter, 307 papers were maintained.
In the second filter, we read the papers selected and dropped those that did not report correlations or information for the estimation. We used the procedure described by Peterson and Brown (Reference Peterson and Brown2005) to estimate the correlation using the beta coefficients of a regression model in two selected papers.
Each of the authors conducted the selection process independently; the inter-author agreement was .88 according to Cohen’s Kappa. Divergences were resolved in a meeting between the authors. Subsequently, the final sample consisted of 29 papers published between 2008 and 2021 and covering studies in the United States, China, Taiwan, Czech Republic, Ghana, Belgium, Hong Kong, Germany, Sri Lanka, the United Arab Emirates, and Spain. These papers contained a total of 89 correlations based on data from 9,272 CEOs. The screening process is depicted in Figure 3.
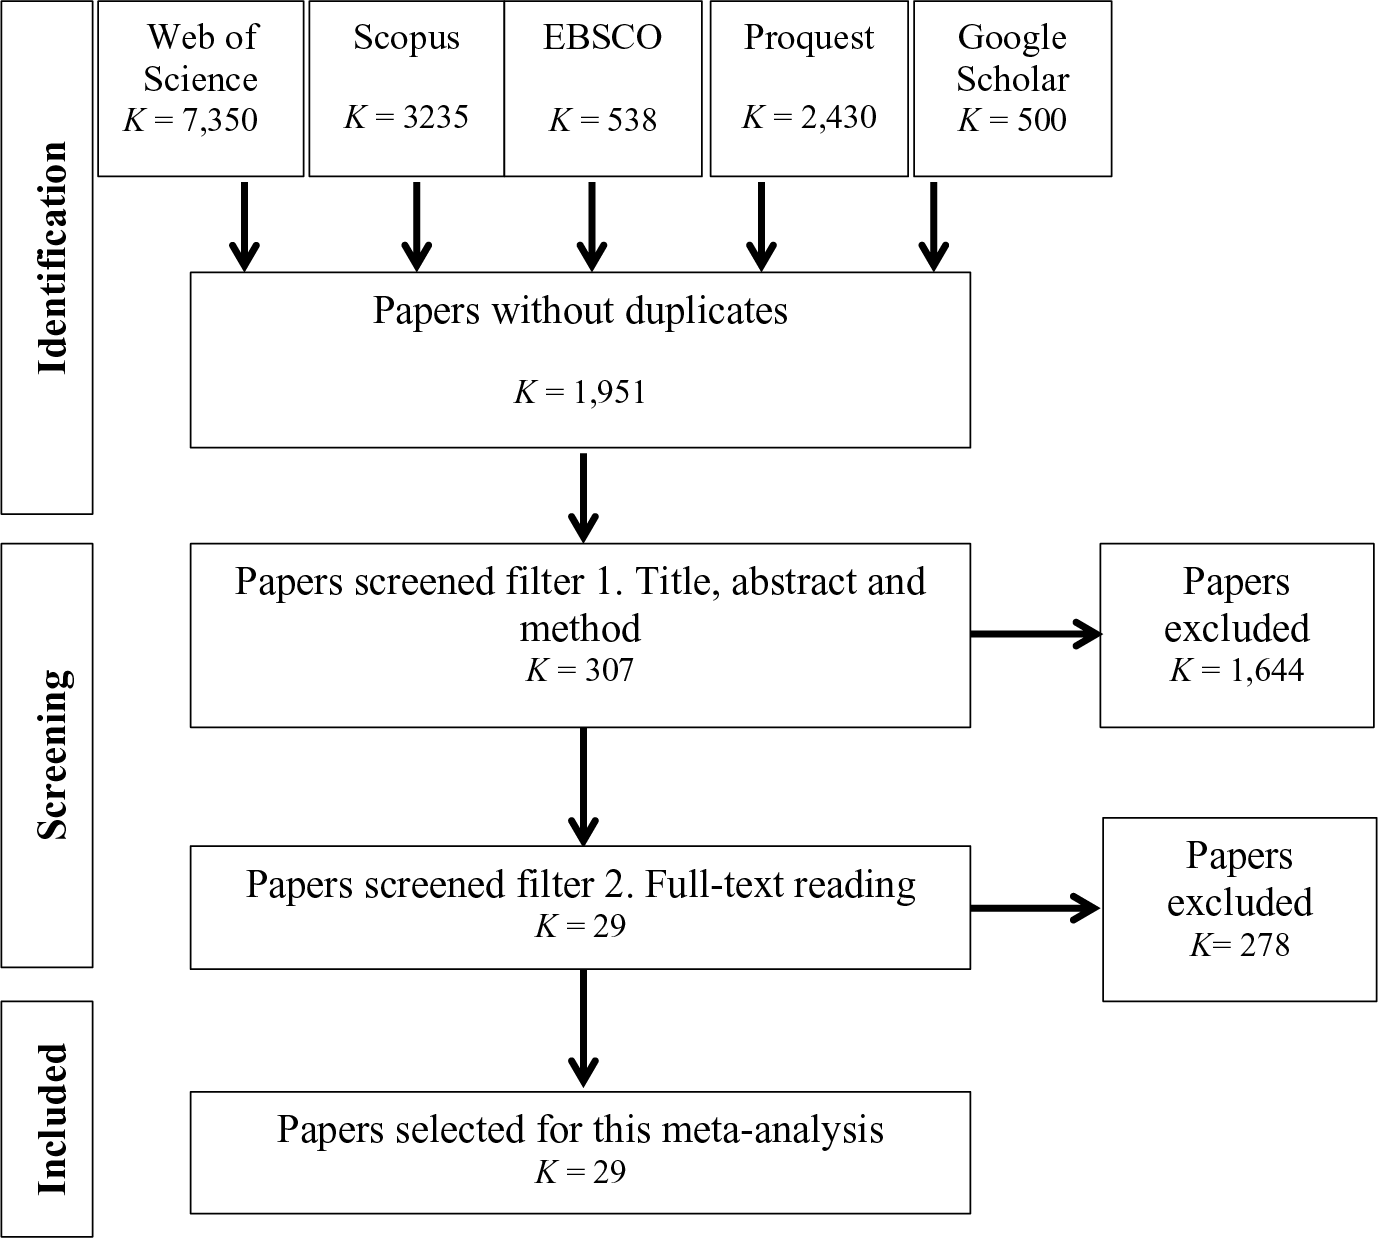
Figure 3. PRISMA Flowchart
Note. Flowchart of the screening process applied in this meta-analysis.
Finally, we instituted an additional process to support the selection of the dynamic capabilities in the papers. Three independent judges with PhDs in business and domain-relevant expertise reviewed the organizational capabilities identified in the search and evaluated if such capabilities were dynamic. Inter-judge agreement was quantified as very high (Fleiss’ Kappa = .83).
Coding Process
The information reported in the papers was used to build a database structured in two blocks: bibliographical information and methodological settings. The first block was formed by the title, authors, publication year, and journal. The second block was formed by the country in which the paper was conducted; sampling (probabilistic-non-probabilistic); firm size (SMEs-large firms); sample size (number of employees reported in the paper); source of information (CEO-other source); CEO social capital variable measured; dynamic capability measured; reliability, Cronbach’s alpha for both variables; and correlation (Pearson’s r). Reliability was used to correct the correlation following the Hunter and Schmidt (Reference Hunter and Schmidt2004) procedure.
For the moderation analysis, particular variables were created. Dimensions of social capital and the source of social capital were created using the information reported in the papers. The authors explicitly clarified the dimension measured, whether structural, relational, or cognitive. Similarly, sources of social capital were reported by the authors in the papers, being they political or business ties.
However, for the other moderators we used external information. Individualism-collectivism values were created using the country scores determined by Hofstede (Reference Hofstede2011). Hofstede’s model describes six dimensions of national culture that allow the comprehension of the differences among countries. In terms of the perception of transparency and legality, we use the Corruption Perception Index (CPI; Transparency International, 2019). This measures how corrupt a country’s public sector is perceived to be by experts and business executives. It is an index ranging between 0 (extremely corrupt) and 100 points (extremely honest). CPI values are reported each year whereby we used values from one year before the publication of the paper. We used this criterion because the measures reported in the papers are usually conducted some time prior to publication. This is a better index of the perception at the time when the data were gathered.
For environmental dynamism, we created a variable using the economic sector reported in each paper. Higher environmental dynamism is characterized by rapid technological change, higher spending on R&D, more knowledge workers, higher levels of turbulence, and emerging ideas that disrupt the market (Simerly & Li, Reference Simerly and Li2000). To build this measure, we use the technological intensity as a proxy using the classification of the Organization for Economic Co-operation and Development (OECD; 2016). This is calculated by dividing average R&D spending by the firm’s revenue in the sector. Papers that used samples focused on biotechnology, information and telecommunications, and hardware and software were classified as high dynamism. If a paper used samples from various sectors, the largest sample was used to classify it as demonstrating high or low dynamism. Finally, firm size was demarcated based on the number of employees, with fewer than 250 employees denoting SMEs and large firms employing more than 250 individuals (OECD Observer, 2000).
Data Analysis
This meta-analysis employed a three-level random-effects model (Cheung, Reference Cheung2014; Fernández-Castilla et al., Reference Fernández-Castilla, Jamshidi, Declercq, Beretvas, Onghena and den Noortgate2020) incorporating Pearson’s correlation coefficients with a method of restricted maximum likelihood-REML (Raudenbush et al., Reference Raudenbush, Cooper, Hedge and Valentine2009). We followed the guidelines established by Assink and Wibbelink (Reference Assink and Wibbelink2016). The three-level random-effects model distinguishes between three sources of variance to improve the quality of the estimations (Cheung, Reference Cheung2014; van den Noortgate et al., Reference van den Noortgate, López-López, Marín-Martínez and Sánchez-Meca2013; Wibbelink et al., Reference Wibbelink, Hoeve, Stams and Oort2017). In the first level, this procedure calculates the sampling variance; the second level calculates the within-study variance, and the third level the between-study variance. In brief, the first level is the variation between CEOs (related to the sample size), within-study the variation between correlations reported, and between-study the variation associated with each study (Assink & Wibbelink, Reference Assink and Wibbelink2016).
To achieve maximum validity of the meta-analysis, we applied a sensitivity analysis with the Cook’s distances and standardized values. Sensitivity analysis using Cook’s distances calculates the individual influence of each correlation in the estimation (Aguinis et al., Reference Aguinis, Gottfredson and Joo2013). Cook’s distances allow researchers to estimate the influence of each piece of data in the analysis. A single observation is deemed to be influential if its omission changes the analysis substantially (Cook, Reference Cook1977). Moreover, we analyzed the standardized values to identify outliers.
The exploration of methodological variables used the year of publication of the paper, and the type of sampling (probabilistic versus non probabilistic). It was not possible to explore the effect of the source of the information because CEOs were the most common informants; specifically, 28 papers applied instruments only to CEOs.
In the estimation of the percentage of variance explained by moderator variables, we compared the residual heterogeneity using Q value and I 2 statistic. Q value quantifies the grade of heterogeneity in the effect sizes analyzed (Huedo-Medina et al., Reference Huedo-Medina, Sánchez-Meca, Marín-Martínez and Botella2006) and I 2 describes the proportion of the variance due to heterogeneity and not associated with sampling errors (Higgins & Thompson, Reference Higgins and Thompson2002). According to Higgins and Thompson (Reference Higgins and Thompson2002), I 2 statistic around 25%, 50%, and 75% would mean low, medium, and high heterogeneity, respectively. Q value and I 2 were estimated using a meta-regression with the moderators that evidenced a significant effect. Additionally, we compared within-study and between-study heterogeneity to identify changes in the variance. All the analyses were executed in R (R Core Team, 2014) using the ‘metafor’ package (Viechtbauer, Reference Viechtbauer2010) and Metaviz for the associated visualization (Kossmeier et al., Reference Kossmeier, Tran and Voracek2020).
Results
The correlation between CEO social capital and dynamic capabilities was quantified as r(88) = .30, p < .001, 95% CI [.24, .36], with medium heterogeneity within-study = .010, p < .001, I 2 = 27.64% and between-study = .023, p < .001, I 2 = 64.84%. Sampling-variance was calculated as 7.52%. The test of residual heterogeneity showed a significant value, Q(88) = 1,498.29, p < .001. Paper of Mudalige et al. (Reference Mudalige, Ismail and Malek2016) exhibited an excessive influence and was also an outlier, z = 2.63, p < .001; for these reasons, this study was dropped and the meta-analysis was re-run. Nonetheless, the estimation did not show relevant changes r(87) = .29, p < .001, 95% CI [.23, .34], therefore, we maintained all the studies in the analysis.
Dynamic capabilities identified in the search were adaptive capability, marketing capability, technological capability, innovativeness, resource-bridging capability, creativity of the firm, proactiveness, opportunity exploration capability, technological innovation capability, exploratory learning capability, responsive capability, R&D capability, linking capability, leveraging capability, absorptive capacity, product innovation capability, and measures of dynamic capabilities as a general factor. All of these are focused on firms’ capabilities to create, extend, or modify organizational resources.
Likewise, we seek evidence of publication bias with the Eggers’ test and the funnel plot. According to this test, publication bias was present in this sample, z = –4.50, p < .001, the dotted line in the funnel plot depicted in Figure 4 illustrates the tendency identified by the Eggers’ test. Furthermore, the publication bias was evident in the funnel plot. Studies with higher correlations and higher standard error are not represented in the figure. Nonetheless, if missed correlations were included the estimation would be higher than the value reported in this meta-analysis and so it is not a threat for the analysis. We did not use a trim and fill strategy because it is not recommended by three-level random-meta-analysis (Cheung, Reference Cheung2014; Fernández-Castilla et al., Reference Fernández-Castilla, Jamshidi, Declercq, Beretvas, Onghena and den Noortgate2020).

Figure 4. Funnel Plot with the Estimated Correlation
Note. This funnel plot in the left-side shows the significant effects of the studies. Dots into the white funnel are non-significant. Dots in grey area are significant to the 95% of confidence. Dots outside of the grey area are significant to the 99% of confidence. Funnel plot in the right-side shows the estimate correlation in this meta-analysis. Finally, the dashed line shows the tendency of the Egger’s test.
Moreover, Figure 4 shows the comparison between the funnel around the r = 0, absence of correlation, and r = .30, the value estimated in this meta-analysis. The grey area represents the studies producing a result different from zero with 95% confidence and outside of the funnel the values with 99% confidence. Therefore, dots inside the funnel are not statistically different from zero. Then, 85% of the dots are different from zero. According to this evidence, H 1 was supported.
Additionally, we explore differences in the type of dynamic capabilities, sensing r(29) = .31, p < .001, 95% CI [.24, .39], seizing r(39) = .28, p < .001, 95% CI [.21, .35], and reconfiguring r(14) = .34, p < .001, 95% CI [.25, .43]. There were no significant differences between them F(2, 82) = 1.01, p = .37. The role of CEO social capital is similar among the three manners of dynamic capabilities proposed by Teece (Reference Teece2007).
Results of Moderation Tests
Once the overall correlation was estimated, we tested each moderator effect proposed. Table 1 summarizes the results.
Table 1. Moderation Analysis

Note. Individualism and perceived transparency are continuous variables; Capital social dimension, Source social capital.
Environmental dynamism and Firm size are categorical variables. K = Number of studies. J = Number of effects on each study.
* p < .05. ** p < .01. *** p < .001.
Moderators were analyzed from macro to micro variables. Firstly, countries had differential correlations among them, F(10, 78) = 3.307, p = .001. We identified significant correlations in Germany, China, Ghana, Spain, Sri Lanka, and the United Arab Emirates; in contrast, Belgium, Hong Kong, Czech Republic, Taiwan, and the United States did not show significant correlations. According to this result, H 2 was supported.
Secondly, there was no evidence of moderation by Individualism-Collectivism, F(1, 87) = 1.00, p = .32. Levels of individualism did not modify the correlations between CEO social capital and dynamic capabilities. As a result, H 2a was rejected. However, the perception of transparency had a significant and negative moderator effect, F(1, 87) = 4.31, p = .04, therefore, H 2b was supported. Higher levels of perceived transparency were associated with weaker correlations between CEO social capital and dynamic capabilities. Effectively, environments with explicit and clear rules and business procedures decrease the relevance of CEO social capital.
Additionally, environmental dynamism also exhibited a significant moderator effect, but in the reverse direction to the proposed hypothesis, F(1, 87) = 7.50, (r_low= .37; r_high= .23), p = .008; thus, H 3 was not supported. Where lower environmental dynamism prevailed, the correlation between CEO social capital and dynamic capabilities was higher; hence the role of CEO social capital was crucial in relatively stable environments. In other words, leveraging networks to gain information or access to scarce resources requires time, but rapidly changing environments are characterized by a lack of time.
Firm size did not show a moderator effect F(1, 79) = .35, (r_SMEs = .30; r_Large = .34), p = .55, and so H 4 was not supported. Correlations between CEO social capital and dynamic capabilities are similar in large firms and SMEs. No statistically significant moderating effect was revealed in terms of the source of social capital F(1, 56) = 1.44, (r_political ties = .26; r_business ties = .31), p = .24. Business ties presented higher correlations compared to political ties, but the difference was not statistically significant. Based on this result, H 5 was rejected.
Moreover, dimensions of social capital did not exhibit a moderating effect on the relationship between CEO social capital and dynamic capabilities F(2, 86) = 1.479, (r_structural = .33; r_relational = .26; r_cognitive = .27), p = .23. Both comparisons demonstrated non-significant effects. Although the highest correlation was found in the structural dimension and the lowest in relational social capital, the difference was not significant. Hence, H 6a and H 6b were both rejected.
Finally, the exploration of the methodological variables showed positive effects by year of publication F(1, 87) = 6.74, p = .01. Nonetheless, no effects appeared according to the type of sampling F(1, 87) = 1.22, (r_Probabilistic = .34; r_Non probabilistic = .27), p = .27. Consequently, papers have reported stronger correlations each year and no differences existed between probabilistic and non-probabilistic sampling techniques.
Once significant moderators were identified, we apply a meta-regression to calculate the percentage of variance explained. As country is a macro variable that includes the information of perception of transparency and legality, the use of them in the same model generates multicollinearity problems. To avoid this, we use these variables in different models. Table 2 presents the heterogeneity test using the year of publication as a control variable in all models.
Table 2. Heterogeneity Tests

Note. Percentage of variance explained is compared with the heterogeneity value without moderators previously reported in results, Q (88) = 1,498.29, p < .001. I 2 means the percentage of non-explained variance in the model.
* p < .05. ** p < .01. *** p < .001.
The variable who most heterogeneity explains is the country of study, with a percentage of 60.37%. This percentage slightly increases to 60.67% when the environmental dynamism is added to the model. On the other hand, transparency and legality, and environmental dynamism explain similar percentages of heterogeneity, 32.86% and 33.47%, respectively. When these variables are added to the same model, the percentage of variance explained increases marginally to 33.53%.
Moreover, the country of the study allows us to explain between-study heterogeneity, reducing the percentage of non-explained variance in the model to low levels, I 2 = 22.46%. By contrast, transparency and legality, and environmental dynamism have medium heterogeneity within and between studies. Nonetheless, within-studies heterogeneity reduces heterogeneity more than between-studies.
Discussion
This meta-analysis estimates the correlation between CEO social capital and dynamic capabilities, and tests a number of moderator variables that explain 60.67% of the heterogeneity in the results. We offer support to the proposition that CEO social capital is associated with dynamic capabilities, therefore, the access to information and scarce resources through the social capital networks increased the presence of these organizational capabilities in the firms. Findings extend the microfoundations research of the organizational variables, positioning CEO social capital as a variable relevant to the process. Specifically, it is an input of the process, as described by Bendig et al. (Reference Bendig, Strese, Flatten, da Costa and Brettel2018). However, it is moderated by the country, the perception of transparency and legality, and the environmental dynamism.
To discuss the findings of this paper, we analyze the results by each moderator level before displaying an overall analysis. At the country level, the perception of transparency and legality moderated the correlations. These findings reinforce extant evidence about the influence of the social context in managerial practices, highlighting that CEOs are not isolated actors; rather, they are social agents embedded in a context (Acquaah, Reference Acquaah2007; Brass, Reference Brass and Kozlowski2012; Luo et al., Reference Luo, Huang and Wang2012). In cultures perceived as being less transparent, the relevance of CEO social capital increases because it can be leveraged to obtain information and resources through legal holes (Acquaah, Reference Acquaah2007). Countries with lower transparency and legality lack clear social and business rules because regulatory institutions are unable to apply them. This lack of regulations raises uncertainty and CEO social capital is a tool to address this ambiguity.
At the firm environment level, we found evidence that environmental dynamism moderates the correlations in the opposite direction than proposed in the hypothesis. Correlations are stronger in economic sectors with low environmental dynamism. CEO social capital is crucial when CEOs have the time to use their social ties. In those sectors characterized as highly dynamic, firms must adapt faster and CEOs cannot spend time in exploiting their networks. Hence, the mechanism to activate the benefits of social capital could be slower because they require coordination with several social agents.
At the firm level, correlations are similar for large firms and SMEs. We failed to find evidence that the other sources of social capital, such as brand recognition or reputation of large firms, increase the correlation significantly. Although large firms can obtain more social capital by adding diverse sources (Lu et al., Reference Lu, Zhou, Bruton and Li2010), the generation of dynamic capabilities is not an issue concerning the quantity of information, but rather its interpretation and use. The information obtained by the social capital is useless without a CEO interpreting and fostering internal processes to articulate dynamic capabilities. This finding highlights the active role of the CEOs as a filter in the development of dynamic capabilities in the firm.
Finally, at the level of CEO social capital we do not find evidence of moderation. Both the sources and the dimensions of social capital have similar correlations between CEO social capital and dynamic capabilities. Even if relationships with business ties are horizontal and political relationships are hierarchical (Park & Luo, Reference Park and Luo2001), the two sources equally contribute to the construction of dynamic capabilities. In addition, the dimensions of social capital do not show evidence of moderation. Although the theoretical framework suggests that each dimension identifies differential information about CEO social capital (Phelps et al., Reference Phelps, Heidl and Wadhwa2012), we have not found changes in the correlations. Consequently, we assert that the three dimensions show similar correlations. Although the relational dimension obtaining information concerning the trust in the ties decreases perceived uncertainty (Chung et al., Reference Chung, Wang, Huang and Yang2016; Peng & Luo, Reference Peng and Luo2000), it does not strengthen the organizational capacity to create, extend, or modify resources. In addition the goals shared across the members in the network and the similar cultural practices do not modify the correlation.
An overall view of the heterogeneity analysis allows us to generate two interpretations about the moderator variables. The first interpretation concerns the possibility that CEO actions influence the relation between CEO social capital and dynamic capabilities. In line with this interpretation, variables in the macro level are either out of control or not influenced by CEO actions but, in contrast, micro level variables can be influenced by them. In short, CEOs have no influence on the social practices related to transparency and legality, the individualism-collectivism values in the country, or the environmental dynamism in the sector. Nonetheless, they can influence the source of the social capital by choosing to interact with business or political ties, as well as the dimension of the social capital established in their networks, simple contact, trust, or shared goals. In the case of firm size, it is an intermediate variable that could be influenced by CEO actions, although it is harder to change than CEO social capital variables. Consequently, from this interpretation, the relation between CEO social capital and dynamic capabilities is moderated for non-controlled variables which are imposed in the social practices. Hence, acknowledging those imposed practices allows CEOs to use their social capital strategically.
The second interpretation of the moderators contrasts where the CEOs social capital is placed and who participate in the network. While macro variables state where the network is developed, micro variables concern who interacts within it. From this second interpretation, the relationship between CEO social capital and dynamic capabilities is moderated by the place or the contextual conditions. The participants in the network cannot change the relationship. Hence, in social context with lower perceptions of transparency and legality or lower environmental dynamism the relation will be higher, no matter what social agents are included in the network.
From a meta-analytical perspective, it seems implausible to offer any other moderators of the relationship between CEO social capital and dynamic capabilities, hence we encourage the exploration of additional moderators in primary studies. The moderators analyzed have succeeded in explaining a percentage of this variance but future research should explain the missing percentage, especially at the within-study level. The heterogeneity analysis demonstrated that the country of the study is a relevant moderator of the correlations and a portion of this effect is explained by the perception of transparency and legality. Nonetheless, this variable does not account for the total effect of the country. There is a potential avenue for new research to offer sociocultural variables that explain the differences among countries.
Even if a percentage of the non-explained variance is related to sampling error, we encourage researchers to formulate additional variables by each level proposed in this paper, especially in those levels with only one variable explored. Specifically, at the level of the environment of the firm we suggest variables related to the competency or market structure (e.g. oligopoly, monopoly). At the level of firm characteristics, we suggest firm age, the innovative orientation of the firm, interactions with organizational social capital, or internal social capital (employees). It is highly plausible that internal social capital allows the mobilization of resources and information into organizations, and increases the coordination and knowledge shared. Another research avenue is the interaction of CEO social capital with individual differences of the CEOs as human capital, personality traits, or cognitive processes.
It is also relevant to include new methodological designs. Studies usually apply cross-sectional designs, hindering the inferences of causal relationships. We have strong evidence of positive correlations between CEO social capital and dynamic capabilities but we cannot assert causal relationships. Future studies should apply longitudinal designs to advance current academic knowledge; new cross-sectional and correlational studies would generate few original insights.
Limitations
First, we have reported evidence of publication bias in the meta-analysis since a proportion of the papers was not identified. Papers missing have higher correlations and higher errors which could be associated with grey literature. Although searches in the databases included these and other non-published documents, we were unable to obtain this type of study. This is thus a limitation for the generalization of the conclusions.
Additionally, papers represent a proportion of the countries around the world, specifically those that have reported studies. Some geographic areas are wholly unrepresented such as Latin America, the United Kingdom, and Oceania. Results are focused on Europe and Asia, but they are unable to offer conclusions to unexplored countries.
Practical implications
From these findings, we highlight the five main implications of this study for the CEOs. First, CEOs should remember that they are embedded in a social network that influences their management activities. CEOs are not isolated in their hierarchical position Abosag & Naudé, Reference Abosag and Naudé2014; Geletkanycz & Hambrick, Reference Geletkanycz and Hambrick1997; Uzzi, Reference Uzzi1997). Second, findings remind the CEOs that social capital is a source of strategic information and resources that the competency cannot avail of because its place in the network is non-transferable. Social capital is another resource for the CEOs that can be exploited for the benefit of the firm.
The third implication is that the building of wide social networks increases the probability of obtaining strategic information and resources; therefore, the time and economic inversion in the social capital is beneficial for the firm. Fourth, these findings highlight that social capital is relevant for SMEs and large firms; both can invest in the formation of social networks. Finally, there is no evidence that focusing solely on business or political ties increases the benefits differently; we therefore encourage CEOs to maintain wide social networks with both.
Supplementary Materials
To view supplementary material for this article, please visit http://doi.org/10.1017/SJP.2022.4.


