The Perceived Stress Scale (PSS; Cohen, Kamarak, & Mermelstein, Reference Cohen, Kamarak and Mermelstein1983) is one of the most widely used measures for evaluating stress (Pedrero & Olivar, Reference Pedrero and Olivar2010). However, the manner in which stress is evaluated depends on the framework that is used to define it. Currently, the most common models of stress are process models, which are based on the transactional theory of stress (Lazarus & Folkman, Reference Lazarus, Folkman and Gentry1984). This theory regards stress as a transactional relationship between the individual and his environment. In this approach, the stress response is activated when the individual views the situation (stressor) as taxing his resources and threatening his well-being. Evaluating the situation as a threat, harm, or challenge triggers the characteristic stress response at the physiological and behavioral level.
This perspective is consistent with the PSS, which was designed to measure the degree to which life situations are perceived as stressful (Remor & Carrobles, Reference Remor and Carrobles2001). There are 3 versions of the scale: the PSS14, the PSS10, and the PSS4 (Cohen & Williamson, Reference Cohen, Williamson, Spacapan and Oskamp1988). The numbers that follow the acronym indicate the number of scale items, and the PSS14 is the most widely used version.
The original English version of the PSS14 has been adapted into many languages, and there are Dutch, Hebrew, Greek, Italian, German, French, Bulgarian, Hungarian, Korean, Chinese, Taiwanese, Thai, Polish, Turkish, and Russian versions, as well as Spanish versions adapted for Spain, Chile, Puerto Rico, and Mexico, which can be viewed and accessed at the web page for the Laboratory for the Study of Stress, Immunity and Disease at Carnegie Mellon University (http://www.psy.cmu.edu/∼scohen/scales.html).
González and Landero (Reference González and Landero2007) adapted the Spanish version of the PSS (Remor & Carrobles, Reference Remor and Carrobles2001) for its use in Mexico. This scale exhibits adequate internal consistency and exploratory and confirmatory factor analyses confirmed the two-factor model reported by Cohen and Williamson (Reference Cohen, Williamson, Spacapan and Oskamp1988).
The two-factor structure of the PSS14 (with two factors that group positive and negative items, respectively) has been confirmed for other countries, such as Japan (Mimura & Griffiths, Reference Mimura and Griffiths2008), Colombia (Campo-Arias, Bustos-Leiton, & Romero-Chaparro, Reference Campo-Arias, Bustos-Leiton and Romero-Chaparro2009), and Spain (Pedrero & Olivar, Reference Pedrero and Olivar2010).
The availability of different language versions of the PSS makes it possible to obtain stress scores and compare stress levels in widely diverse samples. However, for most versions of the PSS, there are no normative data or applications for large samples. Recently, Cohen and Janicki-Deverts (Reference Cohen and Janicki-Deverts2012) presented normative data for the United States based on samples from 1983, 2006, and 2009. This work motivated the present study, which collected data in Mexico.
The goal of the present study was to obtain normative data regarding gender and different age groups based on a sample of 1990 Mexican participants to validate the underlying factor structure of the construct.
Method
Participants
The sample was drawn from studies conducted in the past 2 years, in which the PSS was administered to students, parents, and housewives, as well as a small group of women with breast cancer (less than 10% of the sample). Although the sample initially included 2870 participants, the sample sizes of the different age groups were unequal when cases with incomplete data were eliminated. As a result, participants over 65 years of age (n = 41) were excluded, and randomized sampling was used to reduce the size of age group 1 (participants under 25 years of age) to ensure that the size of this age group and the proportion of male and female participants in this group were similar to that of the other age groups.
The final sample included 1990 participants (37.5% males, 62.5% females) with an average age of 35.5 years old (SD = 13.3). The age groups that were studied corresponded to the age groups in Cohen and Janicki-Deverts (2012; see Table 1).
Table 1. Sample distribution by gender and age group

Instruments
The present study used the 14-item version of the PSS (Cohen et al., Reference Cohen, Kamarak and Mermelstein1983) that was culturally adapted for Mexico (González & Landero, Reference González and Landero2007). The scale exhibited an adequate level of internal consistency Cronbach’s alpha coefficient = .83, and a confirmatory factor analysis (CFA) indicated that the goodness of fit was adequate for the two-factor solution.
Scores for the PSS4 and PSS10 could be obtained from the PSS14. Although the PSS14 is more widely used, Cohen and Janicki-Deverts (Reference Cohen and Janicki-Deverts2012) obtained normative data for the PSS10 for the United States. As a result, this study included data for all 3 versions of the PSS.
Statistical analysis
Kolmogorov-Smirnov tests found that the data met the assumption of normality for the PSS14 (p = .353 for age group 1 and p = .072 for age group 3) and for the PSS10 (p = .060 for age group 1 and p = .092 for age group 5). The data did not meet the assumption of normality for any of the studied groups for the PSS4, although the Q-Q plots suggested that the distances were minimal.
Exploratory factorial analysis (EFA) explores the dimensionality of the data to identify factors that underlie the relationships among items. If the items are not correlated to some extent, the factor model will be inadequate, due to the absence of underlying factors. However, the presence of extremely high correlations among items does not support the existence of a theoretical construct but suggests that the highly correlated items provide redundant information. As a result, the data were first examined for collinearity and the presence of atypical cases that might affect the factor estimates. A correlational analysis examined the bivariate collinearity of the data, and variance inflation factors (VIF) were used to determine the extent of multivariate collinearity. To detect atypical cases, box-and-whisker plots for each item were examined, and Mahalanobis distances were estimated (p < .001).
The EFAs were performed using principle components extraction with oblique rotation without imposing the constraint of orthogonality of factors. The confirmatory factorial analyses (CFAs) used the maximum likelihood estimation method because it allows for the contrast of estimates and has been found to be robust to departures from the assumption of multivariate normality (Rodríguez Ayán & Ruiz, Reference Rodríguez Ayán and Ruiz2008). The data exhibited a normalized Mardia coefficient (1970, 1974) of 32, which suggests a departure from the criterion of multivariate normality, although it was below than the limit of 50 suggested by Rodríguez Ayán and Ruiz. For this reason, the CFI and RMSEA indices that adopted the number 8 criterion suggested by Bentler (Reference Bentler2007) were included in the evaluation of the confirmatory models. We examined the stability of the model estimates using the multigroup confirmatory procedure. The procedure facilitates the simultaneous estimation of the parameters of the model for two groups (e.g., men and women and two randomized subsamples) and the testing of hypotheses regarding the equality of factor loadings, structural covariances, and residuals.
Results
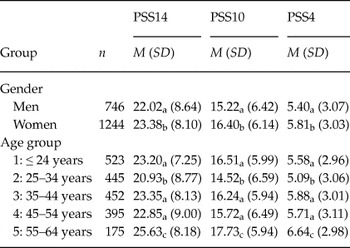
Neither the bivariate correlational analysis (with absolute values of Pearson’s r, which ranged from .11 to .75) nor the VIFs (which ranged from 1.2 to 3.3) identified bivariate or multivariate collinearity. The univariate analysis based on the box-and-whisker plots identified 8 cases as atypical, and Mahalanobis distances identified 58 cases as atypical multivariates; 2 cases were common to both analyses. Because the factor analyses that were conducted with and without the atypical cases provided the same results, no cases were rejected; the final sample consisted of 1990 cases. Table 2 presents the mean scores and standard deviations for the different groups.
Table 2. Mean scores for the PSS14, PSS10, and PSS4 by gender and age group

Note:
Different subscripts for different categories of the same factor indicate significant differences, p < .01.
For age group 1 (individuals who were less than 25 years of age), the EFA provided a one-factor model for the data based on the PSS4. Otherwise, the EFAs for the data for all of the PSS scales provided a solution with two orthogonal or weakly correlated factors for all of the groups, with age group 2 (the 25 to 34 year age group) exhibiting the highest correlation coefficient. Details of the analysis are presented in Tables 3, 4, and 5. The factor loadings and communalities are provided in the Appendix A, B and C.
Table 3. Exploratory factor analysis for the PSS14

Note:
Factor 1 corresponded to items 1, 2, 3, 8, 11, 12, and 14; factor 2 corresponded to items 4, 5, 6, 7, 9, 10, and 13.*p < .05; **p < .01.
Table 4. Exploratory factor analysis for the PSS10

Note:
Factor 1 corresponded to items 1, 2, 3, 8, 11, and 14; factor 2 corresponded to items 6, 7, 9, and 10.
* p < .05; **p < .01.
Table 5. Exploratory factor analysis for the PSS4

Note:
a For the two-factor model, factor 1 corresponded to items 6 and 7, and factor 2 corresponded to items 2 and 14, except for age group 1 (≤ 24 years), which had a one-factor solution.*p < .05; **p < .01.
Confirmatory factor analysis for the PSS14
The comparison of the confirmatory models for the PSS14 was consistent with the hypothesis that the factor loadings were the same (p = .257) but not the structural covariances or residuals (p < .001). The correlation between the factors was .165 and .226 for men and women, respectively (p < .001), revealing modest but significant differences between the two genders. All of the hypothesis tests were significant (p < .001) for the comparisons based on age, indicating that the model parameters were not equal across the different age groups. The correlation between the two factors was .163 (p < .001) for age groups 1, 3, 4, and 5, while the correlation was .424 (p < .001) for age group 2 (the 25 to 34 year age group). Table 6 presents the goodness of fit indices.
Table 6. Indices of global fit for the two-factor model based on the PSS14

Note:
1 = Gender multigroup analysis; 2 = Age multigroup analysis.
Confirmatory factor analysis for the PSS10
Compared to confirmatory models for the PSS14, the confirmatory models for the PSS10 led to different conclusions in regard to the stability of the model estimates across groups. Specifically, the hypothesis tests regarding the equality of the parameters for men and women were significant in all cases (p < .05), with correlations between the two factors of .189 and .278 for men and women, respectively (p < .001). With regard to the age groups, the results were consistent with the hypothesis of equality of factor loadings (p = .073) but not the equality of the other parameters (p < .001). The correlation between the two factors was .21 (p < .001) for age groups 1, 3, 4, and 5, while the correlation was .43 (p < .001) for age group 2 (the 25- to 34-year-old age group). Table 7 presents the goodness of fit indices.
Table 7. Indices of global fit for the two-factor model based on the PSS10

Note:
1 = Gender multigroup analysis; 2 = Age multigroup analysis.
To evaluate the comparability between the measurements provided by the 3 versions of the PSS, a common metric (0 to 56 points) was used, and the whole-part correlation and the corrected correlations for items common to the 3 versions of the instrument were determined. Although the corrected correlation coefficients were less than the whole-part correlation, they were all of considerable magnitude, and the shared variance for the items common to all the versions ranged from 21% for age group 1 to 52% for age group 2. For the total sample, the shared variance was 38% for the PSS14 and PSS10, 50% for the PSS10 and PSS4, and 64% for the PSS14 and PSS4.
Tests of mean differences and variances between the scores based on the 3 versions of the PSS based on the common metric were performed, and effect sizes for age and gender were calculated (Cohen, Reference Cohen1988). The only group that did not display significantly different means was age group 1 (p = .475); the differences were significant (p < .001) for the other groups. However, the effect sizes for men and women, age groups 2 to 5, and the entire sample were modest with d values lower than .1 and r values lower than .05, which indicated that the observed differences in the scores provided by different versions of the scale were of little practical importance.
The means of the PSS10 for the different gender and age groups for the sample from northern Mexico was not significantly different (p = .996) from the results reported by Cohen and Janicki-Deverts (Reference Cohen and Janicki-Deverts2012).
Confirmatory factor analysis for the PSS4
The confirmatory factor analysis of the data based on the PSS4 indicated that the two-factor model provided a good fit to the data, as revealed by the indices of global fit presented in Table 8.
Table 8. Indices of global fit for the two-factor model based on the PSS4

Note:
1 = Gender multigroup analysis; 2 = Age multigroup analysis.
However, in contrast to the results for the other two versions of the questionnaire, the multigroup comparison indicated that the parameters differed between men and women, as well as among age groups (p < .05). Although the proposed two-factor model was adequate, the estimates were not invariant between the groups.
Finally, Table 9 presents the means and standard deviations of stress scores based on the PSS14 for studies conducted in different countries and for different populations.
Table 9. Average stress scores based on the PSS14 found in different studies

Discussion
The primary goal of this study was to obtain reference values for the 4-, 10-, and 14-item versions of the PSS. As noted above, the PSS14, which has been translated into different languages, is the most widely used scale. The average stress level found in studies performed in different countries ranged from 19.5 to 30.3 (see Table 9), while the mean scores for the different groups analyzed in the current study ranged from 20.93 to 25.63 (see Table 2). In the present study, individuals aged 55 to 64 years exhibited the highest levels of stress on average; similarly, based on the PSS14, women displayed higher mean stress levels than men. The results presented in Table 9 indicate that college women in Japan, individuals with substance addictions in Spain, and individuals with fibromyalgia in Spain and Mexico experience higher levels of stress on average. These findings might serve as the basis for future studies that compare the reference values provided in Table 2 with results of the PSS for other samples.
For the PSS10, the average scores reported by Cohen and Janicki-Deverts (Reference Cohen and Janicki-Deverts2012) ranged from 12.07 to 18.64 compared to the average scores in the present study, which ranged from 14.52 to 17.73. For two of the three samples reported by Cohen and Janicki-Deverts, the age group with the highest average levels of stress was the age group that was younger than 24 years of age; in the present study, the group with the highest average stress level was the 55 to 64 year age group. In both studies, the stress scores were higher for women on average.
Based on the above, we propose that scores within one standard deviation of the mean for each group serve as reference values. In addition, specific characteristics of the individuals with stress scores one or two standard deviations above the mean should be further analyzed to evaluate their physical health or other consequences of stress, such as burnout.
The PSS10 was found to be equivalent to the PSS14. The PSS14 has the advantage of being more widely distributed and provides comparison data with a great diversity of samples and countries, while the PSS10 is a more economical version that provides the same information regarding the perceived stress of the individuals being evaluated. The PSS4 is an abbreviated version of the PSS with a factor structure that is consistent with other versions of the instrument that have been applied to different populations. The results of the multigroup analysis revealed that the use of this shorter version with normative data distinguished between both gender and age groups.
With respect to the reliability and factor structure of the PSS, the study results provided evidence that the scale was adequate for use in the evaluation of perceived stress.
The study results were also consistent with previous studies (Campo-Arias et al., Reference Campo-Arias, Bustos-Leiton and Romero-Chaparro2009; Cohen & Williamson, Reference Cohen, Williamson, Spacapan and Oskamp1988; González & Landero, Reference González and Landero2007; Mimura & Griffiths, Reference Mimura and Griffiths2008; Pedrero & Olivar, Reference Pedrero and Olivar2010), which found that a two-factor model that grouped into the PSS14 into positive and negative items exhibited adequate goodness of fit and internal consistency.
Although the factor structure identified two weakly associated factors, the PSS might be appropriately interpreted as based on a single factor that represents all of the items, rather than two independent subscales. If so, each factor identified by the factor analysis of the scale items does not reflect the underlying bipolar continuum but only one of its poles. From this perspective, the presence of two weakly related unipolar factors does not invalidate the bipolarity of the underlying dimension (Lloret & González, Reference Lloret and González2000). It would be worthwhile to employ structural equation modeling to test this hypothesis.
Finally, the limitations of this study must be addressed. Although this study examined a large sample, the sample was not representative because study subjects were exclusively from northern Mexico. As a result, future studies should be performed throughout different regions in Mexico to obtain normative data for the PSS4, PSS10, and PSS14 and confirm the reference scores obtained in the present study. We recommend that similar research be conducted in different countries, as well.
Appendix A
Communalities and factor loadings for the PSS14 items by age group and gender

Appendix B
Communalities and factor loadings for the PSS10 items by age group and gender

Appendix C
Communalities and factor loadings for the PSS4 items by age group and gender