


Happiness is considered the highest good and the essential motivation for all human actions. Pursuit of happiness and well-being has traditionally been, and continues to be, a key element of interest for researchers and psychologists (Ryan & Deci, Reference Ryan and Deci2000). Its study has considered two different components: Hedonia and eudaimonia (Grinde, Reference Grinde2012; Peiró, Ayala, Tordera, Lorente, & Rodríguez, Reference Peiró, Ayala, Tordera, Lorente and Rodríguez2014), and a large amount of research has analyzed the possible pathways leading to each of these components of happiness (Peterson, Park, & Seligman, Reference Peterson, Park and Seligman2005). Personality has been found to be one of the main predictors of happiness (Gale, Booth, Mõttus, Kuh, & Deary, Reference Gale, Booth, Mõttus, Kuh and Deary2013). In addition, other personal factors such as human values about well-being and happiness, and more specifically, orientations to happiness, have been considered important pathways in the development of hedonic and eudaimonic well-being (Peterson et al., Reference Peterson, Park and Seligman2005; Seligman, Reference Seligman2002). Orientation to happiness is defined as the personal priorities, reasons, motives for acting, values, and goals behind a person’s chosen behaviors, the “why” of behavior (Huta, Reference Huta and Vittersø2016). Thus, these orientations can influence life decisions, choices, and, in turn, people’s experience of happiness and well-being. Therefore, it is important to have reliable and valid tools to measure hedonic and eudaimonic orientations to happiness.
The distinction between hedonia and eudaimonia (Ryff, Reference Ryff1989) has been the subject of discussion by psychologists for decades. The hedonic component suggests that maximizing pleasure and minimizing pain is the main pathway to happiness (Ryan & Deci, 2001). It is composed of three constructs: emotional responses (high positive affect and absence of or low negative affect), domain satisfactions (e.g. job satisfaction) and global judgments about life satisfaction (Diener, Suh, Lucas, & Smith, Reference Diener, Suh, Lucas and Smith1999); these facets can be divided into narrower categories reflecting a general dispositional tendency or a more temporary state response (Tenney, Poole & Diener, Reference Tenney, Poole and Diener2016). The eudaimonic component maintains that true happiness entails identifying one’s virtues, cultivating them, and living in accordance with them. Ryff (Reference Ryff1989) includes six aspects of this positive functioning: Purpose in life, personal growth, self-acceptance, positive relationships, environmental mastery, and autonomy. The two components have been adopted and integrated by more recent psychologists to develop a science of well-being, resulting in extensive discussion and debate about both perspectives and trying to point out the merits of pleasure (hedonic component) and meaning (eudaimonic component) as routes to happiness. In fact, research suggests that hedonic and eudaimonic elements are interrelated and part of the same overall structure of well-being (Peiró et al., Reference Peiró, Ayala, Tordera, Lorente and Rodríguez2014), and that both can be supported by data (Ryan & Deci, Reference Ryan and Deci2000).
According to Huta and Waterman (Reference Huta and Waterman2014), measures assessing hedonia and eudaimonia fall into different categories, with orientations viewed as the criteria people use to decide whether an action is worthy of being pursued, thus representing motives for acting, ways of living, and priorities. In fact, Huta (Reference Huta and Joseph2015) defines eudaimonia and hedonia primarily as orientations, arguing that people choose their way of life more directly than their experiences or functioning, and that well-being is an outcome of their way of living. Therefore, the current study focuses on the orientations that can lead to happiness (hedonic and eudaimonic). Orientations are trait-like, individual-difference characteristics, and they address the “why” of behavior (Huta & Waterman, Reference Huta and Waterman2014). One of the most relevant contributions to the measurement of happiness orientation is the Orientation to Happiness Questionnaire (OTHQ) (Peterson et al., Reference Peterson, Park and Seligman2005). It is an 18-item self-report measure composed of three subscales called the Life of Pleasure (hedonia indicator), the Life of Meaning, and the Life of Engagement (Eudaimonia indicators). People who pursue high orientations to happiness are said to live a full life, whereas those who do not are said to live empty lives (Seligman, Reference Seligman2002).
We base our study on the OTHQ because it has been successfully applied in different contexts and in cross-cultural research (Ruch, Huber, Beermann, & Proyer, Reference Ruch, Huber, Beermann and Proyer2007; Vella-Brodrick, Park, & Peterson, Reference Vella-Brodrick, Park and Peterson2009). It has been translated and validated in different languages and types of samples. For example, Chen (Reference Chen2010) validated it using a Chinese sample, and Köse (Reference Köse2015) translated it into Turkish and validated it using a Turkish and Russian university student sample. These previous studies found evidence for the Orientations to Happiness Questionnaire’s reliability and validity. In the Spanish language, there have been some validation attempts of the full scale. Góngora and Castro Solano (Reference Góngora and Castro Solano2015) validated it using a sample of Argentinean adolescents; Durón, García, and Galvez (Reference Durón, García and Gálvez2016) did so in the Mexican population; and San Martín, Perles, and Canto (2010) adapted the scale to Spanish using a sample of Spanish university students. Nevertheless, as far as we know, it has not been empirically validated using different types of evidence or using the validation criteria recommended by Fornell and Larcker (Reference Fornell and Larcker1981). Moreover, these previous studies are based on smaller samples consisting mainly of adolescents or students, and they are not carried out in a general population or in the work context. On the other hand, we consider it a challenge to achieve a short scale (and reliable) for ease of use that can measure hedonic and eudaimonic orientations, but with the least information possible. In this regard, Ruch, Martínez-Martí, Heintz, and Brouwers (Reference Ruch, Martínez-Martí, Heintz and Brouwers2014) validated a short form of the questionnaire for German-speaking countries. Short forms are useful in large-scale studies where different variables are measured and obtaining the most information with the fewest answers is a key criterion.
However, as some authors have pointed out (Anić & Tončić, Reference Anić and Tončić2013), the specificity level of the orientations in the original OTHQ is not completely clear, especially with regard to the life of engagement dimension. Moreover, there is an imbalance in the scope of the three orientations. The life of meaning and life of pleasure scales are clearly based on the two traditions about the pursuit of happiness or orientations to happiness, and the wording of the items resembles previous research contrasting hedonic and eudemonic orientations (Peterson et al., Reference Peterson, Park and Seligman2005). Thus, these two scales clearly express the two main happiness orientation components: Hedonia and eudemonia (Huta & Ryan, Reference Huta and Ryan2010). The life of engagement dimension included in the OTHQ was adapted from the work on flow by Csikszentmihalyi (Reference Csikszentmihalyi1990), and it refers to a state of “optimal experience” that occurs during the performance of a challenging task. Compared to the life of meaning and life of pleasure orientations, the state of flow is a difficult state to achieve, given its peculiarities, because it only occurs when our perceived skills match the perceived challenge of the task we are doing, and it might not be as immanent as the other two. Pleasure and meaning orientations can apply to several different situations in daily life and influence different complementary personal decisions (Huta, Reference Huta and Joseph2015). By contrast, flow only occurs under very specific circumstances, and it is rather rare in daily life (Anić & Tončić, Reference Anić and Tončić2013).
Huta and Waterman (Reference Huta and Waterman2014) also warn about the importance of clearly conceptualizing and operationalizing the happiness category (orientation, behavior, experience, and function) to which studies refer. They also note that findings based on different categories can be inconsistent. Indeed, research has shown that the category in which wellbeing is measured influences the relationship between this construct and its correlates (Park, Park, & Peterson, Reference Park, Park and Peterson2010). To develop our short version, we selected the items on the OTHQ that showed higher saturations in each dimension and were clearly worded as orientations to happiness (pursuits, goals, or values) rather than behaviors, experiences, or functions. Thus, we wanted to ensure that the items measured “the why of behavior”. Almost all the items in the life of engagement dimension are expressed in terms of experiences, behaviors, or personal disposition (e.g. “Regardless of what I am doing, time passes very quickly”), and not in terms of values or orientations. Thus, this dimension seems more indicative of flow (experience) than of engagement (orientation).
For all of these reasons, we have not included the life of engagement dimension in the short version.
In summary, this study focuses on the hedonic and eudaimonic orientations to happiness, trying to adapt, develop, and validate a measure that can briefly measure both orientations in the Spanish work context: the SOTH Scale. For this purpose, we use a large and broad sample of Spanish workers in terms of sociodemographic factors.
Hypothesis 1a: The SOTH Scale represents a 2-factor structure (i.e. hedonic and eudaimonic).
Hypothesis 1b: The SOTH subscales show satisfactory internal consistencies.
Relationships between orientations to happiness and sociodemographic variables are generally small or nonexistent, although younger individuals usually score higher on pleasure (Ruch et al., Reference Ruch, Martínez-Martí, Heintz and Brouwers2014).
Hypothesis 2: Younger participants score higher than older participants on the hedonic orientation.
Previous research has provided evidence of an association between the orientation to happiness and different indicators of well-being, mainly life satisfaction (Pollock, Noser, Holden, & Zeigler-Hill, Reference Pollock, Noser, Holden and Zeigler-Hill2016; Vella-Brodrick et al., Reference Vella-Brodrick, Park and Peterson2009). Life satisfaction is understood as “the standards of the respondent to determine what a good life is” (Diener, Reference Diener1984, p. 543). Its relevance is justified, for example, by the notion that well-being transcends and goes beyond economic prosperity and its indicators, and the fact that people evaluate the conditions surrounding them differently depending on their own personal background, values, and expectations (Diener et al., Reference Diener, Suh, Lucas and Smith1999). As noted above, life satisfaction has traditionally been considered a component of hedonic well-being (Diener et al., Reference Diener, Suh, Lucas and Smith1999). Evidence of construct validity requires examining correlations between the measure to be examined and variables that are known to be related to the construct, in this case, life satisfaction (Anić & Tončić, Reference Anić and Tončić2013; Chen, Reference Chen2010; Peterson et al., Reference Peterson, Park and Seligman2005
In some previous research using the OTHQ, both orientations were equally related to life satisfaction (e.g. Chan, Reference Chan2009; Ruch, Harzer, Proyer, Park, & Peterson, Reference Ruch, Harzer, Proyer, Park and Peterson2010). However, other studies have found that the eudaimonic orientation shows a stronger relationship with life satisfaction (e.g. Schueller & Seligman, Reference Schueller and Seligman2010; Vella-Brodrick et al., Reference Vella-Brodrick, Park and Peterson2009). Some authors have pointed out that these results could be due to the fact that the hedonic orientation is more oriented toward short-term well-being, whereas the eudaimonic orientation is more related to long-term well-being. Thus, whereas affective hedonic measures will be more related to the hedonic orientation, cognitive evaluations, such as life satisfaction, will be more related to eudaimonic orientations (Huta, Reference Huta and Joseph2015; Huta & Ryan, Reference Huta and Ryan2010).
Hypothesis 3a: Hedonic and eudaimonic orientations are positively related to hedonic well-being (life satisfaction), showing a stronger relationship with the eudaimonic orientation.
We consider it relevant to obtain further evidence of convergent validity by also analyzing the correlations with eudaimonic outcomes such as purpose in life or personal growth (Ryff, Reference Ryff1989). According to the author, people who score high on purpose in life have goals and a sense of directedness, feel there is meaning in present and past life, hold beliefs that give life purpose, and have aims and objectives for living. People who score high on personal growth have a feeling of continued development, see themselves as growing and expanding, are open to new experiences, and have a sense of realizing their potential.
Hypothesis 3b: Hedonic and eudaimonic orientations are positively related to eudaimonic well-being (personal growth and purpose in life), showing a stronger relationship with the eudaimonic orientation.
Method
Participants and procedure
The sample is composed of 1,647 Spanish workers (45.5% male and 54.5% female) from different areas in Spain. Four hundred and thirty-two (27%) were younger than 35 years old, 910 (56.8%) were between 35 and 50 years old, and 259 (16.2%) were older than 50. They worked in 22 different companies (27% were public companies, 58.9% were private, and 14.1% were dedicated to public and private education). Eighty-three percent belonged to the services sector, and 18.7% belonged to the secondary sector of the economy. The research team contacted key informants (mainly human resource managers) in different organizations and presented the study objectives and methodology to them. Employees of these organizations were asked to complete a paper and pencil or on-line questionnaire during work breaks in their workplaces. The overall response rate was approximately 59.6%.
Instruments
Orientation to Happiness. The scale is based on the 18-item original scale by Peterson et al. (Reference Peterson, Park and Seligman2005). We selected the items with the highest factor loadings in the hedonic and eudaimonic factors (see Peterson et al., Reference Peterson, Park and Seligman2005, page 31), checking that the wording of the items inquired about priorities, reasons, or motives for acting, that is, the “why” of behavior (Huta, Reference Huta and Vittersø2016), rather than experiences or behaviors. Afterwards, the selected items were translated into Spanish through a translation and back translation procedure. This first version of the Spanish scale was administrated to 277 workers from different occupational levels, and a researcher was present to identify potential comprehension problems, which were resolved through discussion among the authors. The final scale is composed of 6 items. An example item for the hedonic orientation is “For me, the good life is the pleasurable life”, and an example item for the eudaimonic orientation is “I have a responsibility to make the world a better place”. Answers are given on a 5-point Likert scale ranging from 1 (very much unlike me) to 5 (very much like me).
Life Satisfaction. Life satisfaction was measured using the Satisfaction with Life Scale (SWLS; Diener, Emmons, Larsen, & Griffin, Reference Diener, Emmons, Larsen and Griffin1985). It consists of five items that measure the individual’s evaluation of satisfaction with life in general. An example item is “I am satisfied with my life”, and answers are given on a 7-point Likert scale ranging from 1 (strongly disagree) to 7 (strongly agree). In this study, a Spanish translation of the SWLS was used, achieved through the translation and back translation method. The Cronbach´s alpha was .82.
Eudaimonic Well-Being. Purpose in life and personal growth are measured using the reduced scale by Ryff (Reference Ryff1989), composed of eight items. An example item for purpose in life is “I enjoy making plans for the future and working to make them a reality”, and an example item for growth is “I have the sense that I have developed a lot as a person over time”. Answers are given on a 7-point Likert scale ranging from 1 (strongly disagree) to 7 (strongly agree). A Spanish translation of the scale was used, achieved using the translation and back translation method. The Cronbach´s alpha was .72.
Statistical Analysis
To calculate means, standard deviations, skewness, kurtosis, and the correlation coefficients between the item and the rest of the scale, the IBM SPSS Statistics [v.22] software was used. In addition, sex and age differences for the subscales, using post-hoc tests and ANOVAs, were reported.
To obtain evidence of factorial validity based on the internal structure of the scale, two factor analysis procedures were conducted. To do so, the total sample was randomly split into two parts. With the first half (n 1 = 854), an EFA was performed along with Catell´s Scree Test (Cattell, Reference Cattell1966), and parallel analysis with the Monte Carlo Simulation Technique (Watkins, Reference Watkins2000); and with the second half (n 2 = 793), a CFA was performed, using SPSS 20 and AMOS 22, respectively. Moreover, as noted above, evidence of convergent validity based on the relationship with other variables was investigated through inspection of Pearson´s correlations between the hedonic and eudaimonic orientations and well-being indicators (life satisfaction, personal growth, and purpose in life).
The Kaiser-Meyer-Olkin (KMO) and Bartlett tests were performed to verify suitability of the data for an EFA. For EFA, we applied unweighted least squares as the extraction method and the oblique rotation criterion (Sass & Schmitt, Reference Sass and Schmitt2010). The CFA scale was conducted with the six items on the SOTH Scale, based on maximum likelihood estimation, because the data are continuous and follow a normal distribution. The goodness of fit of the model to the data was evaluated through the estimated factor loadings, which are significant when associated t-values are greater than 1.96, and using the following statistics: Chi-square (χ2), Root Mean Square Error of Approximation (RMSEA), Standardized Root Mean Square Residual (SRMR), Comparative Fit Index (CFI), and Accommodations and Care Fit Index (ACFI). As a rule of thumb, overall model fit is acceptable if RMSEA is closer to 0, SRMR < 0.08, and the other fit indexes have values of .90 or higher. The chi-square statistic indicates the absolute fit of the model, and it should be non-significant, but it is very sensitive to sample size and is usually significant in large samples.
Convergent and discriminant validity of the model were assessed using standardized factor loadings and AVE. The AVE “is calculated as the mean variance extracted for the item loading on a factor, and it is a summary indicator of convergence” (Hair, Black, Babin, & Anderson, Reference Hair, Black, Babin and Anderson2010, p. 687). Values greater than .50 are considered adequate (Fornell & Larcker, Reference Fornell and Larcker1981). Discriminant validity also occurs when the square root of the AVE between each pair of factors is higher than the estimated correlation between these factors.
Finally, the reliability (internal consistency) of the scale was demonstrated by Composite Reliability (CR). Values greater than .70 are considered adequate (Fornell & Larcker, Reference Fornell and Larcker1981).
Results
Preliminary and exploratory factor analyses
Means, standard deviations, and item correlations are displayed in Table 1. With regard to the correlations between the items that make up each subscale, they were all high, significant, and positive, as expected. Correlations between the two subscales were also positive and significant. Corrected item-total correlations were within the range recommended by Clark and Watson (Reference Clark and Watson1995), (range r = .39–.46; p < .01). None of the six items showed asymmetric values, with skewness and kurtosis within the range (< –1; > +1), and the elimination of any item would reduce the reliability of the scale.
Table 1. Means (M), Standard Deviations (SD) and Inter-correlations

Note: N = 1,647.
a Instead of correlations, the Corrected ITCs for each item are provided.
*** p < .001. ** p < .01. * p < .05.
Correlations between the subscales and well-being were positive and significant. The eudaimonic orientation showed higher correlations with both life satisfaction and eudaimonic well-being. These results supported Hypothesis 3a because the hedonic and eudaimonic orientations were positively related to life satisfaction. The eudaimonic orientation presented a stronger correlation, although Hotelling’s T test showed that the difference between the correlations was not significant, T (N = 1,647) = –2.75; n.s. Hypothesis 3b was also fully confirmed because the hedonic and eudaimonic orientations were positively related to eudaimonic well-being, and the eudaimonic orientation had a stronger correlation, T (N = 1,647) = 6.78; p < .001. These previous results showed evidence of convergent validity because positive relationships were found between both subscales and well-being outcomes.
An ANOVA was computed to check whether workers’ ages were related to their orientations to happiness. Significant differences in the two subscales were found based on age, where the youngest group (less than 35 years old) presented higher levels of a hedonic happiness orientation (F = 8.87; p < .001), whereas the older group (over 50 years old) presented higher levels of an eudaimonic orientation (F = 11.83; p < .001). No significant differences were found for the intermediate age group. A post hoc Tukey test showed that the youngest and oldest groups differed significantly at p < .05. Therefore, Hypothesis 2 was confirmed.
The measure of sampling adequacy was appropriate (KMO = .65; Bartlett test: χ2 = 2412.43, df = 15, p = .001). EFA (see Table 2) showed that all the items had high factor loadings, and the scale was composed of two factors that accounted for 51.8 % of the variance. The Scree Test (Cattell, Reference Cattell1966) also clearly supported these two factors and the screeplot derived from the results of parallel analysis with Monte Carlo also indicated a two-factor solution. The correlation between factors was low (r = .09), indicating discriminate validity.
Table 2. Exploratory Factor Analysis
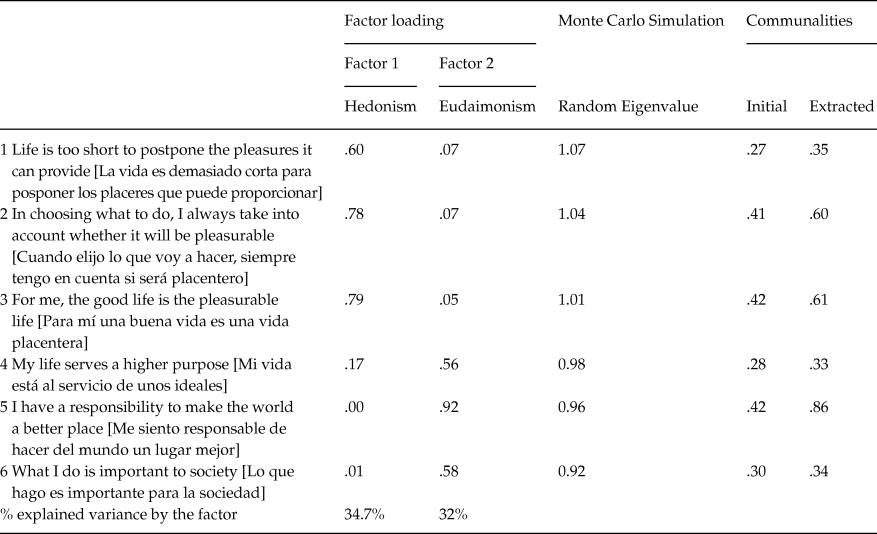
Note: Extraction method = unweighted least squares; Rotation method = oblique.
Dimensionality
CFA showed that three items defined the hedonic orientation factor, and the other three items defined the eudaimonic orientation factor. Results showed that the data fitted the model (χ2 = 36.61, df = 8, p < .001; RMSEA = .06; SRMR = .05; CFI = .97; ACFI = .96), except for the significance of χ2, which may have been significant due to the large sample size. This model was compared to another model with only one factor, but the data did not fit the model (χ2 = 510.22, df = 9, p < .001; RMSEA = .26; SRMR = .19; CFI = .55; ACFI = .56). Therefore, we can conclude that all the indexes except χ2 confirmed that the scale was composed of two factors, as Figure 1 shows.

Figure 1. Confirmatory Factor Analyses
Results of EFA and CFA confirmed our Hypothesis 1a.
Convergent and discriminant validity
After confirming the 2-factor measurement model, we assessed the extent to which items from a factor converged or shared a high proportion of variance. Two methods were used: (1) Assessment of standardized factor loadings and (2) the AVE index for each factor. For the first method, lambda factorial weight coefficients were all above .50, the lowest recommended value to assume the substantive meaning of an item within the factor, and they were statistically significant (p < .001). Regarding the AVE, both factors obtained satisfactory scores (hedonic factor, AVE = .51; eudaimonic factor, AVE = .50). Results of both methods showed evidence of convergent validity. On the other hand, discriminant validity was established because the square root of the AVE between the factors was higher than the estimated correlations (hedonic factor, √AVE = .71; eudaimonic factor, √AVE = .70).
Reliability
Reliability was demonstrated by Composite Reliability indices. Values greater than .70 are considered adequate (Fornell & Larcker, Reference Fornell and Larcker1981), and both subscales obtained satisfactory scores (Hedonic factor, CR = .76; eudaimonic factor CR = .73), confirming our Hypothesis 1b.
Discussion
The purpose of this study was to validate the SOTH Scale. To construct the scale, we based it on the Orientation to Happiness Questionnaire by Peterson et al. (Reference Peterson, Park and Seligman2005) for measuring hedonic and eudaimonic orientations, focusing on the life of pleasure and life of meaning dimensions. Selected items were translated and back-translated into Spanish, and they were included in a questionnaire that was responded to by 1,647 Spanish workers. After analyzing the reliability and validity of the scale, we can say that the results showed adequate psychometric properties and good fit indexes; except the chi square, which should be not significant. However, it is difficult to find a non-significant chi square in large samples such as ours, because it is very sensitive to sample size. Thus, in general, our results support a bifactorial structure (i.e. hedonic orientation factor and eudaimonic orientation factor). Results also supported the reliability of both subscales, and the structure analyses showed a high contribution of all the items to the factors and good fit indexes, providing evidence of factorial validity. Convergent validity was shown by the positive and significant correlations between both subscales and two different indicators of hedonic and eudaimonic well-being. Finally, satisfactory values for standardized factor loadings and AVE provided evidence of convergent and discriminant validity. At this point, it is worth noting that we found that life satisfaction had a higher correlation with the eudaimonic orientation than with the hedonic orientation. Even though life satisfaction has generally been considered a component of hedonic well-being (Diener et al., Reference Diener, Suh, Lucas and Smith1999), some authors propose that, because the eudaimonic orientation is more related to long-term well-being than the hedonic orientation, the former will show a higher relationship with life satisfaction (Huta, Reference Huta and Joseph2015). Our results parallel those obtained in previous research with the OTHQ, which found higher correlations of life satisfaction with the life of meaning orientation than with the life of pleasure dimension (e.g Schueller & Seligman, Reference Schueller and Seligman2010; Vella-Brodrick et al., Reference Vella-Brodrick, Park and Peterson2009). These results also provide support for some recent studies that pointing out that life satisfaction contains both hedonic and eudaimonic components (Díaz, Stavraki, Blanco, & Gandarillas, 2015). In addition, some authors suggest that hedonic components predict eudaimonic-cognitive elements such as purpose in life (Fredrickson, Reference Fredrickson2001). Other authors propose that hedonic and eudaimonic components make up a positive and iterative spiral, and that psychological well-being integrates all of them (Peiró el al., 2014). Thus, orientations to happiness could be expected to be related to all the components of psychological well-being. In any case, we agree with Huta and Ryan (Reference Huta and Ryan2010) about the need to empirically identify different patterns of well-being linked to hedonia vs. eudaimonia orientations, without assuming that life satisfaction belongs in the hedonic camp.
We also tested for the existence of significant differences in orientations to happiness based on age because previous research analyzing relationships between orientations to happiness and sociodemographic variables found small or nonexistent relationships (Ruch et al., Reference Ruch, Martínez-Martí, Heintz and Brouwers2014). Our results show that younger workers have higher levels of the hedonic orientation, and older workers have higher levels of the eudaimonic orientation to happiness. Research on age and generations at work has pointed to motivational differences depending on age and age cohorts that could be related to different happiness orientations. Thus, generational theory maintains that individuals in different generational cohorts develop unique values, belief systems, and peer personalities (MacManus, Reference MacManus, Thau and Heflin1997). Life span theories also propose changes in goals and motivations as people age. However, the findings may be inconclusive because educational or cultural aspects may have more weight than age, or other previous studies may have used samples with small age deviations. In this vein, the report published by Park, Peterson and Ruch (Reference Park, Peterson and Ruch2009) on orientations to happiness in 27 nations points out that differences across nations were evident, regardless of whether demographics were used as covariates.
The overall findings from the present study support the validation of the SOTH Scale. We think this scale is a necessary and useful tool for researchers and practitioners interested in well-being and happiness. The SOTH Scale makes it possible to quickly measure orientations to happiness in Spanish-speaking people. Research shows that orientations to happiness are important paths to different kinds of well-being, and so it is important to have validated instruments to measure them. Moreover, this scale helps in designing positive interventions to improve well-being. Giannopoulos and Vella-Brodrick (Reference Giannopoulos and Vella-Brodrick2011) provided evidence of the effectiveness of interventions that influence orientations to happiness in increasing well-being. From the Positive Psychology viewpoint (Seligman, Reference Seligman2002), applying intervention techniques to increase happiness makes sense because it aims to promote the factor that allows individuals and organizations to thrive. Thus, given the popularity of the idea of promoting happiness in employees, it is important to have a brief and reliable scale that can measure paths to happiness (i.e. orientations). Moreover, ways of living (i.e. orientations) are more direct targets of intervention than well-being outcomes (Huta, Reference Huta and Vittersø2016).
Recent studies have investigated orientations to happiness in work settings (e.g., Martínez-Martí & Ruch, Reference Martínez-Martí and Ruch2017; Schueller & Seligman, Reference Schueller and Seligman2010). This scale has been validated using a sample of workers, and so it may be a useful tool to analyze orientations to happiness in the work context and their relationships with job outcomes and other occupational variables. In addition, because most research on well-being at work focuses on hedonic components such as job satisfaction, we consider it appropriate to also analyze the relationship between the two orientations to happiness and other positive work outcomes, such as job performance. Future studies could analyze the role that orientations to happiness play in positive work outcomes, also taking work characteristics into account. By including employees’ orientations to happiness, we would extend the patterns that may arise in the workplace, for example, by expanding the Job-Demands Resources Theory (Bakker & Demerouti, Reference Bakker and Demerouti2016), which has been applied in hundreds of studies, but where individual orientations have not been included previously.
The main limitation of the present study is that our scale is limited to the two main components of orientation to happiness, hedonia and eudaimonia (Huta and Ryan, Reference Huta and Ryan2010). Other components of happiness are also important for an optimal existence (such as relationships, engagement, or physical health), but the distinction between hedonic and eudaimonic orientations is especially relevant because both “play major complementary roles in life” (Huta, Reference Huta and Joseph2015, p. 223). They follow different psychological processes and, thus, influence the choices and actions we take differently. Therefore, in developing a short measure, we focused on these core aspects of happiness orientation. Moreover, we wanted to ensure the correct specification of the orientation category of well-being (Huta & Waterman, Reference Huta and Waterman2014), with the scale focusing on the why of behavior, rather than on the behavior, experiences, or function. A more comprehensive approach could explore other orientations to happiness, such as the life of engagement dimension (Peterson et al., Reference Peterson, Park and Seligman2005), or try to integrate the hedonic/eudaimonic orientation distinction with other conceptualizations, such as the relationship/achievement orientation distinction (Uchida & Ogihara, Reference Uchida and Ogihara2012). However, it is also worth noting that these complementary differentiations could be overlapping other well-established constructs about values or goal orientations, such as individualism/collectivism. Moreover, it should be kept in mind that the eudaimonic orientation also considers the orientation to personal relations to some extent (Seligman, Reference Seligman2002). Moreover, the use of short measures is necessary in large-scale studies, where researchers try to obtain the most information in the least amount of time, that is, with the fewest answers, and large representative samples compensate for the possible lower reliability of short scales. Another limitation is that in this study, we did not take personality measures into account, although they could have shown a close relationship with well-being. This could contribute further to supporting the construct validity. However, the main interest of happiness orientations resides in their link to well-being. Finally, the data on all the variables considered in the study were collected by means of self-reports, and so they might be influenced by common method variance. Nevertheless, this is a common practice in studies that analyze and validate these types of variables.
We hope the SOTH Scale will be useful in further research and practice designed to improve happiness and well-being in Spain and other Spanish-speaking countries.


