


Self-efficacy (SE) is a construct derived from social cognitive theory (Bandura, Reference Bandura1997), which is conceptualized as the belief that one can produce desired outcomes as a result of his/her own actions on the surrounding environment from the combination of skills and capabilities, along with available resources (Bandura, Reference Bandura1997). This belief is considered the foundation of human motivation, well-being and accomplishments (Bandura, Reference Bandura2006).
SE can be directed to a specific area, such as family functioning (Jones & Prinz, Reference Jones and Prinz2005), academic achievement (Komarraju & Nadler, Reference Komarraju and Nadler2013), involvement in risk behaviors (Bandura, Reference Bandura1997), among others. However, some researchers recognize the existence of a more global sense of efficacy, entitled general self-efficacy (GSE; Scholz, Doña, Sud, & Schwarzer, Reference Scholz, Doña, Sud and Schwarzer2002). GSE beliefs refer to the global confidence in one´s coping ability across a wide range of demanding or novel situations (Scholz et al., Reference Scholz, Doña, Sud and Schwarzer2002).
The generalization of the concept of self-efficacy has allowed a better comprehension of a wider range of human behavior and of its function as a coping resource in face of stressful situations, such as cancer surgery (Schwarzer, Boehmer, Luszczynska, Mohamed, & Knoll, Reference Schwarzer, Boehmer, Luszczynska, Mohamed and Knoll2005), unemployment over time (Zenger, Berth, Brähler, & Stöbel-Richter, Reference Zenger, Berth, Brähler and Stöbel-Richter2013), etc. These researches demonstrate how GSE beliefs are a powerful resource in obtaining a positive outcome when dealing with different, novel and stressful situations.
The General Self-Efficacy Scale (GSES) is currently the world’s most widely used questionnaire to assess GSE. The GSES was originally developed by Ralf Schwarzer and Matthias Jerusalem in 1981, and subsequently published (Schwarzer & Jerusalem, Reference Schwarzer, Jerusalem, Weinman, Wright and Johnston1995). Since then, it has been translated to at least 31 languages, and its psychometric properties have been extensively evaluated (e.g., Luszczynska, Scholz, & Schwarzer, Reference Luszczynska, Mohamed and Schwarzer2005; Schwarzer, Bäbler, Kwiatek, Schöder, & Zhang, Reference Schwarzer, Bäbler, Kwiatek, Schröder and Zhang1997; Scholz et al., Reference Scholz, Doña, Sud and Schwarzer2002).
Some of these studies assessed the GSES´s psychometric properties across different cultures. For example, in a study employing samples from 25 nations (Scholz et al., Reference Scholz, Doña, Sud and Schwarzer2002; N = 19.120), the GSES has presented adequate reliability coefficients, with Cronbach´s α ranging from .75 to .91. The unidimensionality of the scale was also tested, and a confirmatory factor analysis (CFA) for the total sample presented good fit indexes (GFI = .98, AGFI = .97, NFI = .97, RMR = .03, and RMSEA = .05).
These results led Scholz et al. (Reference Scholz, Doña, Sud and Schwarzer2002) to argue that GSE is a universal construct, and that the GSES “meets the criteria required for multicultural assessment procedures” (Scholz et al., Reference Scholz, Doña, Sud and Schwarzer2002, p. 248). Thus, a series of cross-cultural comparisons were conducted in order to investigate, for example, mean differences between the international samples (Scholz et al., Reference Scholz, Doña, Sud and Schwarzer2002). However, surprisingly, none of these aforementioned studies provided evidences that the GSES was invariant across groups. Testing assumptions of measurement invariance, however, are mandatory before conducting any meaningful group comparison (Sass, Reference Sass2011). If the instrument is biased for one or more groups, score differences may be related not to real differences in the latent trait level, but to non-equivalent parameters of the questionnaire (Vandenberg & Lance, Reference Vandenberg and Lance2000). That is to say, bias on questionnaire´s response could lead authors to find unreal group differences.
Several techniques have been developed to assess the extent to which psychometric instruments provide accurate and unbiased information across different groups, such as MGCFA, Differential Item Functioning from Item Response Theory (IRT) framework, Weighted Multidimensional Scaling (WMDS), etc. All techniques have strengths, limitations and specificities, for which explanations are beyond the scope of this article. Notwithstanding, it is noteworthy to mention that among these, the MGCFA has been extensively used in the literature. The MGCFA is a flexible approach to assess measurement invariance (MI) in cross-cultural studies since it permits the inspection of several instruments parameters, such as factor structure (configural invariance), factor loadings (metric invariance) and items intercepts (scalar invariance) (Sass, Reference Sass2011). More than that, the MGCFA technique also allows, in a straightforward way, the inclusion of covariates in these analyses (Muthén & Muthén, Reference Muthén and Muthén2012). That is to say, MI results can be easily controlled for external sources of influence.
By conducting a non-systematic research on the literature, only three articles addressing the issue of measurement invariance of the GSES before conducting group comparisons were found (Bonsaksen, Kottorp, Gay, Fagermoen, & Lerdal, Reference Bonsaksen, Kottorp, Gay, Fagermoen and Lerdal2013; Peter, Cieza, & Geyh, Reference Peter, Cieza and Geyh2014; Schwarzer et al., Reference Schwarzer, Bäbler, Kwiatek, Schröder and Zhang1997). Bonsaksen et al. (Reference Bonsaksen, Kottorp, Gay, Fagermoen and Lerdal2013) tested the psychometric properties and measurement invariance of the GSES using Rasch analyses, with a Norwegian convenience sample of persons with morbid obesity (N = 141). According to the authors, several items had different functioning in relation to age, education and work status. Schwarzer et al. (Reference Schwarzer, Bäbler, Kwiatek, Schröder and Zhang1997), in turn, evaluated the GSES measurement invariance by employing a MGCFA approach. The authors tested measurement invariance of the GSES for German (n = 430), Costa Rican (n = 959) and Chinese (n = 293) non-representative samples (Schwarzer et al., Reference Schwarzer, Bäbler, Kwiatek, Schröder and Zhang1997). When the GSES was constrained to be invariant across the three groups, CFA fit indexes significantly dropped, when compared to the three separate models. These results led authors to argue that an item-by-item cross-cultural equivalence could not be supported by the data. On the other hand, measurement bias in a sample of Swiss people with spinal cord injury (N = 102) was not found for gender, age, education, and lesion levels in Peter´s et al. (2013) study.
Considering GSE as one of the most important concepts derived from social cognitive theory (Bandura, Reference Bandura1997), and considering the GSES as the most widely used scale to assess this construct, this study aims is to provide further evidence on the extent to which the GSES can be invariantly used in cross-cultural researches. Once the literature is scarce about cross-cultural measurement invariance studies with the GSES to date, a priori hypotheses were not formulated.
Method
Participants
The Brazilian data was collected in 2012. Invitations were sent through different sources, such as personal and media invitations, recruitment within social and occupational institutions (specially the adults and the elderly), etc. A total of 3.034 subjects agreed to participate in the study. Of these, 91.4% answered the questionnaires in a web-based platform, whereas the remaining 8.6% responded to the questionnaires in the paper-and-pencil form. From the total of 3.034, 2.394 (78.90%) fully completed the GSES and were included in this study. The mean age of the included sample was 30.11 years (SD = 10.98), and the percentage of women was 62.20%.
The German sample is based on a representative survey of the general population in 2001 (Hinz, Schumacher, Albani, Schmid, & Brähler, Reference Hinz, Schumacher, Albani, Schmid and Brähler2006). Data were collected with the assistance of the Independent Service for Surveys, Methods and Analyses (USUMA, Berlin). Data from German-speaking inhabitants, aged 14 years or older, were collected from 201 sample points distributed throughout Germany. Target sample had to be living in a private household. The sampling approach was constructed using a random-root procedure, starting with the definition of sample points. First, the entire area of Germany was taken into account, and sample points were chosen, with households and inhabitants allocated to each sample point, to achieve homogeneous sample points of similar size. Then, specific streets, houses, floors, and an apartment on these floors were chosen. In every third apartment of those chosen, the first interview was conducted. Finally, a target person at least 14 years old was randomly selected from all members of the chosen households. The first attempt to contact participants was made for 3.270 addresses, of which 3.641 were valid. Out of the initial sample, the final study sample consisted of 2.076 men and women (participation rate: 63.4% of valid addresses). The mean age of the sample was 48.08 years (SD = 17.68), and 52.9% were women. Participants were interviewed face to face in their homes by trained interviewers.
Regarding the Colombian sample, trained interviewers asked 2.372 people to participate in this survey. The study was conducted in 2012 using adult participants belonging to all socioeconomic strata of the general Colombian population. The research market company “Brandstrat Inc.” was hired to conduct the interviews in the eight main cities of Colombia. The sampling procedure guaranteed that each socioeconomic stratum was representatively included in the sample. Therefore, the sample can be assumed roughly representative of the Colombian population. Finally, 1.500 out of the 2.372 contacted people agreed to take part in the study and completed the interview (51.7% women). The mean age of the sample was 41.80 years (SD = 16.23). Table 1 presents comparative sociodemographic data for the samples. For all datasets, informed consent was obtained from all participants.
Table 1. Sociodemographic characteristics of the Brazilian, German and Colombian samples

Instruments
General Self-Efficacy Scale (GSES; Schwarzer & Jerusalem, Reference Schwarzer, Jerusalem, Weinman, Wright and Johnston1995): The GSES is a 10-item Likert-type scale (ranging from 1 – not at all true to 4 – exactly true) that assesses general self-efficacy by a single-factor solution. Its scores range from 10 to 40. Higher scores represent higher levels of general self-efficacy. For this study, the Brazilian (Sbicigo, Teixeira, Dias, & Dell´Aglio, Reference Sbicigo, Teixeira, Dias and Dell´Aglio2012), original German (Schwarzer & Jerusalem, Reference Schwarzer, Jerusalem, Weinman, Wright and Johnston1995) and Colombian (Padilla, Acosta, Guevara, Gómes, & González, Reference Padilla, Acosta, Guevara, Gómez and González2006) versions of the scale were used.
Preparing the dataset
Initially, we sought to pair all GSES items once the Brazilian, German and the Colombian versions of the scale have a different item order. For that, the authors of the present study based their pairing procedures taking the original German version as a basis. Also, due to language similarity, the Brazilian and Colombian versions were easily paired. An external judge, Brazilian native researcher, who fluently speaks English and German also contributed to the pairing procedures. Items order considered the original German structure (see Table 2).
Table 2. Comparative table of the semantic pairing of the Brazilian, German and Colombian versions of the GSES

Statistical Analysis
Initially, the factorial dimensionality of the GSES was evaluated by means of a confirmatory factor analysis (CFA) for the countries separately and for the total sample (N = 5.969). Aiming to control the influences of sex and age in the results and also aiming to seek for within measurement invariance in the sample due to these co-variates (Kim, Yoon, & Lee, Reference Kim, Yoon and Lee2012), a Multiple Indicators Multiple Causes (MIMIC) model was estimated, as shown in Figure 1.

Figure 1. Representational graph of the MIMIC model.
The MIMIC model can be interpreted as follows: The paths of the covariates (age and sex) on the latent variable self-efficacy (solid lines) refer to the direct influence of these variables on the latent trait of self-efficacy. The direct effects of the covariates on the items (dash lines) represent bias effects. In other words, if the direct effects between covariates and items are statistically significant, evidence of measurement non-equivalence are present due to the co-variates (Kim et al., Reference Kim, Yoon and Lee2012).
After estimating the MIMIC model for the total sample, the final model was fixed for all datasets (Brazil, Germany and Colombia) and a MGCFA was conducted to search MI across countries. That is to say that the MGCFA results were controlled for sex and age bias effects. Three different models were tested. Model 1 (unconstrained model/configural invariance) assessed whether the scale configuration (number of factors and items per factor) was acceptable for the countries. If the model is not supported, then the instrument’s factor structure cannot be considered equal for the groups. Model 2 (equal factor loadings/metric invariance) analyzed whether the items’ factor loadings were equal across groups. This model evaluates the extent to which the observed variables present the same importance to the latent trait. Model 3 (equal intercepts/scalar invariance) investigated whether the initial level (intercepts) of the observed items were equal among the different groups. The assessment levels of the models were ordered hierarchically. Each constrained model was nested within a less restricted one (Cheung & Rensvold, Reference Cheung and Rensvold2002). Unless MI invariance holds within configural, metric and scalar models, group comparisons cannot be safely conducted (Sass, Reference Sass2011). On the absence of these assumptions, differences found on the latent variable might be related not to real differences on the latent scores, but to non-equivalent parameters of the questionnaire (Chen, Reference Chen2008; Sass, Reference Sass2011). In the presence of metric and/or scalar non-invariance, evidence of non-invariance is present.
The goodness-of-fit of the unconstrained model was evaluated using the standardized root mean square residual (SRMR), the comparative fit index (CFI), the Tucker-Lewis index (TLI) and the root mean square error of approximation (RMSEA). According to several guidelines, the SRMR should be close to 0, the CFI and TLI must be higher than .90 or .95 or close to it, and RMSEA values that are less than .08 (with the upper-bound of the confidence interval not superior to .10) indicate an acceptable fit (Brown, Reference Brown2006). Measurement invariance of the constrained models was evaluated using the CFI difference test (ΔCFI, Cheung & Rensvold, Reference Cheung and Rensvold2002). Significant differences observed between the goodness-of-fit indices of the models (ΔCFI > .01) indicate that measurement invariance could not be achieved in the evaluated parameter. All analyses were carried out with the Mplus (v.7.11) computer program (Muthén & Muthén, Reference Muthén and Muthén2012).
Results
Initially, we conducted a CFA for all datasets separately. Acceptable fit indexes were found, which supported the expected one-factor solution for the GSES on all samples (Brazil, χ2(df) = 429.080 (35); CFI = .95, TLI = .93; RMSEA (90% CI) .070 (.064 – .076), SRMR = .057; Germany, χ2(df) = 418.639 (35); CFI = .95, TLI = .94; RMSEA (90% CI) .085 (.078 – .093), SRMR = .031; Colombia, χ2(df) = 313.185 (35); CFI = .96, TLI = .94; RMSEA (90% CI) .073 (.066 – .080), SRMR = .031).
Aiming to control the influences of sex and age in the results and to seek for within measurement non-invariance in the sample due to these co-variates, a MIMIC model was tested including these two variables in the model (See Figure 1). Due to limitations on model identification parameters, we followed a hierarchical approach. The first MIMIC model regressed sex and age on the latent trait ‘Self-efficacy’ (no bias model). Later, we evaluated by means of modification indexes (MI) which observed variables (items) would sex and age influence directly (bias model), besides the indirect effects. MI suggested that sex was influencing response to items 6 and 9, whereas age were biasing responses to items 1, 2, 5, 5, 6, 7, 8 and 9. All modifications were implemented and the revised MIMIC model (MIMIC-bias) was run. The MIMIC-bias presented acceptable fit indexes, with the lowest levels of residual compared with the no bias model. Table 3 presents the factor loadings of original unidimensional model as well as of the MIMIC and MIMIC-bias and their respective goodness-of-fit indexes.
Table 3. Factor loadings (standardized) and goodness-of-fit indexes for different estimated models
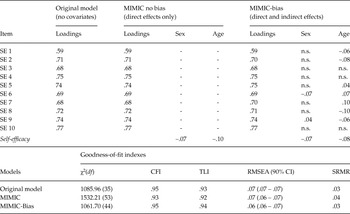
Note: χ 2 – chi-square; df – degrees-of-freedom; CFI – Comparative Fit Index; TLI – Tucker-Lewis Index; RMSEA – root mean square error of approximation; CI – confidence interval; SRMR – standardized root mean square residual.
Considering this final model, a MIMIC-MGCFA was tested to assess whether the GSES would present measurement invariance on all datasets, controlled by the sex and age bias. Results of the MGCFA are presented on Table 4. The configural model presented acceptable fit indexes. Then, we fixed factor loadings to be equal across groups (Metric Invariance). Results of the CFI difference test did not supported this model (ΔCFI = .02). MI were inspected in order to identify which items were contributing to the metric non-invariance. Items 1, 5, 7, 8 and 9 were not working equivalently across groups and were released to vary across sub-samples.
Table 4. Goodness-of-fit indexes of the MGCFA, Factor loadings and intercepts of the final model - Partial scalar invariance test (unstandardized loadings)

Note: a– Non-equivalent factor loading freed to vary across samples; b– Non-equivalent intercept freed to vary across samples. MGCFA – Multigroup confirmatory factor analysis; *Results controlled for sex and age on the latent scores and on items responses. χ 2 - chi-square; df – degrees-of-freedom; CFI - comparative fit index; TLI - Tucker-Lewis index; SRMR - standardized root mean-square residual; RMSEA - root mean-square error of approximation; BIC – Bayesian Information Criterion.
Subsequently, we assessed the extent to which items intercepts were invariant across groups. Once again, the ΔCFI test did not support the model (ΔCFI = .03). Similar to the procedures previously implemented, we assessed, by means of MI, which intercepts were not working equivalently across groups. Results showed that intercepts of all items were not equivalent when comparing the three countries. Table 4 presents factor loadings and intercepts for the final model (non-invariant items loadings and intercepts freed to vary). The average loadings for Brazilian, German and Colombian sample were .49, .53, and .54, respectively (results not presented on the Table 4); and the average intercepts were 3.17, 3.02, 3.19, respectively. Considering that the loadings are associated to the item discrimination and that the intercepts are related to the items endorsement (or difficulty), the results show a slight lower discrimination of the scores estimated for the Brazilian sample than to the other samples, as well as items slight easier to be endorsed by the German sample.
In order to evaluate the effect of the encountered bias for the different datasets (Brazil, Germany and Colombia), latent scores were generated and compared between two models: model with dataset bias (i.e., MGCFA model, controlling for the influence of sex and age), and the MIMIC-bias model (biased only by sex and age). All differences were calculated by subtracting the MIMIC-bias scores from the MGCFA scores (i.e., difference = Latent MGCFA – Latent MIMIC).
The difference on the latent trait levels of the two models ranged from –.24 to .36, with average equal to |.07|. For the German group, scores biases were higher than the average: mean = |.09|, regardless the signal of the difference; or mean = + .09, considering the signal. For the Brazilian and the Colombian groups, the bias were slight below the average: mean = |.06| and |.06|, respectively; or mean = +.03 (Brazilian), and – .010 (Colombian), considering the signal. These results indicate that the latent scores, if not controlled by the MGCFA, remains underestimated, even after controlling for the bias effect of age and sex, especially for the German sample.
The proportion of the biased scores were also analyzed. Considering that the SE of the estimated latent scores were equal to .30 in the MGCFA model, we established the cut-off points of .50 and .33 SE, respectively. These cut-off points represented approximately .15 and .10 of difference in the latent scores estimation. The results showed that, when compared to the MGCFA model, 5.9% of the MIMIC latent scores were biased in at least .15 (of these, 5.4% were negative biased); 22.8% of the scores were biased in at least .10 (of these, 19.6% were negative biased). For the German group specifically, the proportion of biased scores was above the average: 10.8% of the scores were biased in at least .15, and 33.5% were biased in at least .10. For the Brazilian and the Colombian samples, 2.5% and 2.3% of the scores were respectively biased in at least .15; and 17.9% and 15.5% were respectively biased in at least .10. For all groups, the scores tended to be negatively biased.
Discussion
The presented study aimed to gather further evidence on the extent to which the GSES was a psychometrically sound tool for cross-cultural comparisons. Two representative (German and Colombian) and a large Brazilian non-representative samples were employed. Individually, all three data sets provided acceptable psychometric properties. The MIMIC analyses showed that the direct influence of sex and age on the latent trait of self-efficacy was low. However, indirect effects (bias) for sex still found two items (items 6 and 9) and seven items for age (items 1, 2, 5, 6, 7, 8, and 9). By considering the positive and negative signs of the covariate effects as well as their magnitudes, one could argue that the bias are not severe enough to substantially affect the estimates. However, despite the encountered effect-sizes, we highlight the need of further researches to search for within-samples measurement invariance before conducting group comparison in their datasets while employing the GSES.
Regarding the cross-cultural comparisons, measurement invariance across countries could not be supported. In a total of 10, 5 items’ factor loadings of the GSES were not equivalent across the Brazilian, German, and Colombian samples. For scalar invariance, all items presented non-equivalent levels of intercepts. While testing scalar measurement invariance, the CFI presented an important decrease on the fit index when compared to the previous model (partial metric; ΔCFI = .032). This results shows that the items of the GSES do not have equal likelihood to be endorsed by participants of the different countries, even if they have the same level of the latent trait. If items´ intercepts vary for different groups, it states that differences on the levels of the latent trait are not directly related to the responses on the observed items (Meredith, Reference Meredith1993). For the German group, the items tended to be easily endorsed, even if the participant had the same level of the latent trait than another Brazilian or Colombian participant.
The bias on the items parameters have a straight effect on the estimation of the latent scores. The scores estimated by the MGCFA model were usually higher than the scores estimated by the MIMIC model, controlling the age and sex effects. For the German group, for example, almost 11% of the scores estimated by the MIMIC model were underestimated by at least .15 standard latent score. In synthesis, a model that not control for the country differences of the items parameters could bias the latent scores, and this effect was considerably higher for the German population. Contrary to what has been previously argued (Scholz et al., Reference Scholz, Doña, Sud and Schwarzer2002), although the GSES presents excellent psychometric properties for each country separately, as suggested by the CFA analyses, this result is not sufficient to attest that it meets the criteria required for multicultural assessment procedures.
One point is worth noting: Although we have found several items with differential functioning across countries, the present study does not have a clear explanation on the reasons of why these groups systematically differed. The GSES is a clear scale of general self-efficacy; all items are very similar in its content, which generally deal with questions related to solving problems beliefs. One possible explanation to the encountered biases is that general self-efficacy may be a universal construct (Scholz et al., Reference Scholz, Doña, Sud and Schwarzer2002), but its constitutive components and their relevance to the target construct may vary for different countries. If this hypothesis is correct, further efforts must be conducted to evaluate the cultural basis, as well as the cultural differences, of the general self-efficacy construct.
It is possible that these variations could be due to different kinds of problems, situations or experiences that people are exposed to in their daily life, which requires self-efficacy as a coping strategy; or that people of the different samples have diverse conceptions about what it means to “be efficacious” or to “do well in a task”. Even that theoretical explanations for our findings is not clear at all, our results converge to previous findings suggesting that to some extent, the GSES do not fulfill measurement invariance criteria (Bonsaksen et al., Reference Bonsaksen, Kottorp, Gay, Fagermoen and Lerdal2013; Schwarzer et al., Reference Schwarzer, Bäbler, Kwiatek, Schröder and Zhang1997).
Group comparisons employing the GSES must be carefully conducted. Without previous evaluation of measurement invariance, results of group comparisons may lead to erroneous conclusions (Sass, Reference Sass2011). Considering that theory development in the psychological field generally arises from empirical results (Schmidt, Reference Schmidt2010), further studies using the GSES must rely on measurement invariance evidence before using it to compare different groups.
Several ways of remedy items that present non-equivalent parameters have been discussed in the literature. Specifically, it has been argued that items with DIF should be excluded or rewrite/retranslated (Hambleton, Reference Hambleton, Hambleton, Merenda and Spielberger2005). The first suggestion seems not to be suitable for this specific situation. Since the GSES is a short measure, and since several items presented non-equivalent parameters among countries, in the cross-country comparisons, the exclusion of all these items could preclude the validity and reliability of the scale. Rewriting or retranslating the GSES items could be a more cautious approach to deal with the encountered biases. However, several aspects should be taken into consideration before conducting scale modifications. First, a revision of the most problematic items should not be focused in the increase of grammatical/idiomatic equivalence of the translations, once this approach often result in a worse readability to the items (Borsa, Damásio, & Bandeira, Reference Borsa, Damásio and Bandeira2012). More than that, before item modifications, researchers should be able to comprehend the cultural reasons that prompted the differences on the parameters estimation. Only with a thorough knowledge on how cultural aspects influence GSE is that authors must be able to initiate a procedure of developing cross-culturally equivalent items. Last but not least, to decide whether a revision of the GSES items is needed, further cross-cultural studies must be conducted in order to corroborate or not these results.
In cases that authors find only a few items with non-equivalent items parameters (which is not the case of the present study), latent scores comparisons may be conducted after estimating them by means of partial measurement invariance (Byrne, Shavelson, & Muthén, Reference Byrne, Shavelson and Muthén1989). The rationale behind this is that if the overall amount of non-invariance is small, the latent factor estimates should not be drastically affected (Sass, Reference Sass2011). However, group comparisons in cases of non-invariance is not consensual in the literature. Several researchers (e.g., Millsap & Kwok, Reference Millsap and Kwok2004; Sass, Reference Sass2011) highlights the need of establishing clear and precise criteria, in order to assist researchers in the decision of comparing or not latent mean scores in cases of measurement non-invariance.
Another possibility is to employ IRT calibration methods, such as common item equating (Bond & Fox, Reference Bond and Fox2001; Embretson & Reise, Reference Embretson and Reise2000). By employing equating methods, one is able to develop comparable scores, even in face of DIF for some items. In these scenarios, a set of anchor DIF-free items are identified and used to compute the latent scores. Once several different equating methods and techniques have been developed in the literature, a deep explanation of these procedures is beyond the scope of this article (for further information see, von Davier, Reference von Davier2011).
Our study has strengths and limitations that are worth mentioning. Firstly, as far as we know, this is the first time that the psychometric properties of the GSES are evaluated by a combined approach of MIMIC and MGCFA analyses. The employed method allowed us to control and evaluate the direct and indirect effects of age, sex, and group on the results. More than that, the use of two representative samples also strengthen the reliability of our findings. Notwithstanding, albeit the Brazilian sample was large, its non-representativeness is a limitation of the study. In addition, the sparsity of time in the data collection of the datasets may also explain some of the encountered differences, albeit we could not empirically test this hypothesis. Finally, it is possible that other sociodemographic variables beyond sex and age could also be found to be sources of bias, affecting, thus, the latent trait estimates for the different samples.
Further cross-cultural studies, employing modern and advanced techniques and controlling for several other sociodemographic variables are recommended to evaluate the circumstances to which the GSES could or could not be adequately used in multicultural studies. In accordance with Bonsaksen´s et al. (Reference Bonsaksen, Kottorp, Gay, Fagermoen and Lerdal2013) claim, we hope that the results of this and of future studies may accumulate enough evidence on the extent to which the GSES is a reliable scale to be used in cross-cultural measurement.
The authors would like to thank two anonymous reviewers for several constructive comments on previous versions of this article.


