Empathy is a multidimensional construct that is defined as the emotional understanding of other´s subjective experience – which allows Theory of Mind (ToM), social cognition, and the accurate comprehension of social situations, directing our behaviors in the social environment (Baron-Cohen et al., Reference Baron‐Cohen, Wheelwright, Hill, Raste and Plumb2001; Hall & Shwartz, Reference Hall and Schwartz2018; Melchers et al., Reference Melchers, Li, Haas, Reuter, Bischoff and Montag2016; Montgomery et al., Reference Montgomery, Allison, Lai, Cassidy, Langdon and Baron-Cohen2016).
Baron-Cohen and Wheelright (Reference Baron-Cohen and Wheelwright2004) developed the Empathy Quotient (EQ) scale to evaluate overall socio-cognitive impairs in clinically diagnosed patients with Autism, and compared their response to that of normally functioning adults. They found significant differences in the total scores of these groups, which were related to the degree of impairment involved. Over time, different validity studies have allowed using the EQ with healthy participants in many different contexts and languages (Hall & Shwartz, Reference Hall and Schwartz2018). In the Spanish idiom in particular there have been cross-cultural comparisons (Melchers et al., Reference Melchers, Li, Haas, Reuter, Bischoff and Montag2016), an adaptation to Spanish population (Redondo & Herrero-Fernández, Reference Redondo and Herrero-Fernández2018), and the recent development of the Mexican version of the EQ (Saracco-Álvarez et al., Reference Saracco-Álvarez, Fresán, Rodríguez-Pérez, Robles-García, Escamilla Orozco, Díaz-Martínez, Tovilla-Zárate and Olivares-Neumann2020). Nevertheless, countries such as Chile do not count with their own adapted EQ version.
The EQ measure also relates to multiple personality and interpersonal traits, such as the Big Five (Guilera et al., Reference Guilera, Batalla, Forné and Soler-González2019; Melchers et al., Reference Melchers, Li, Haas, Reuter, Bischoff and Montag2016; Wakabayashi & Kawashima, Reference Wakabayashi and Kawashima2015), the ability to systematize (Kidron et al., Reference Kidron, Kaganovskiy and Baron-Cohen2018), emotion recognition accuracy (Besel & Yuille, Reference Besel and Yuille2010), callousness-unemotional traits (López-Romero et al., Reference López-Romero, Gómez-Fraguela and Romero2014), the Dark Triad of personality (Turner et al., Reference Turner, Foster and Webster2019), and aggression (Pascual-Sagastizabal et al., Reference Pascual-Sagastizabal, Sánchez-Martín, Vegas, Muñoz, Braza, Carreras, del Puerto-Golzarri and Azurmendi2019), among others. Empathy has repeatedly been associated to many individual differences (Blair, Reference Blair2018; Deuse et al., Reference Deuse, Wudarczyk, Rademacher, Kaleta, Karges, Kacheva, Gründer and Lammertz2019), and it is important to investigate its scope in different contexts like the Chilean one. Therefore, we sought to estimate the Chilean EQ’s psychometric properties, convergent validity with other measure of empathy, and a closely related construct such as attachment; as well as noting the negative correlation of the EQ with aggression as an antisocial attribute.
According to a recent review, the gold standard for measuring empathy has been the Interpersonal Reactivity Index (IRI; Hall & Schwartz, Reference Hall and Schwartz2018) which was created by Davis (Reference Davis1983). The IRI assesses empathy from two cognitive components (perspective taking and fantasy), and two emotional components (empathic concern and personal distress), which have been tested in multiple idioms and cultures. However, there are some shortcomings of the IRI that the EQ (second in usage across language and contexts) does not comprise: (i) The isolation of the cognitive and affective components of this construct, (ii) the theoretical distance of the fantasy dimension from social cognition and prosociality, and (iii) the fact that personal distress is an emotional dimension that relates to anxiety in emergency situations, more so than an empathic trait reflecting other’s emotional understanding (Baron-Cohen & Wheelright, Reference Baron-Cohen and Wheelwright2004; Fernandez et al., Reference Fernández, Dufey and Kramp2011; Hall & Schwartz, Reference Hall and Schwartz2018).
One substantial line of research on the EQ has been targeted at differentiating the dimensions that are encompassed in the questionnaire (which were originally not set apart). Starting from the unidimensional presentation of Baron-Cohen and Wheelright (Reference Baron-Cohen and Wheelwright2004), Lawrence et al. (Reference Lawrence, Shaw, Baker, Baron-Cohen and David2004) estimated three discrete factors grouped in 28 items (cognitive empathy [CE], emotional reactivity [ER] and social skills [SS]). Different adaptations of the EQ have confirmed these dimensions with slight changes in the specific items that constitute them (Paolo Senese et al., Reference Paolo Senese, De Nicola, Passaro and Ruggiero2018), although criticism of some dimensions can also be found (Gouveia et al., Reference Gouveia, Milfont, Gouveia, Neto and Galvão2012). For example, Muncer and Ling (Reference Muncer and Ling2006) reported a short version of the EQ with 15 items (five items on each dimension proposed by Lawrence et al., Reference Lawrence, Shaw, Baker, Baron-Cohen and David2004), but these condensed factors attenuated the sex differences in social skills. Wakabayashi et al. (Reference Wakabayashi, Baron-Cohen, Wheelwright, Goldenfeld, Delaney, Fine and Weil2006) presented a three dimensional 28 items and 22 items (shortened) scales, which revealed gender differences as well as degree differences (humanities students scoring significantly higher than science students). A study of the Italian EQ (Paolo Senese et al., Reference Paolo Senese, De Nicola, Passaro and Ruggiero2018), estimated a 28 item and a 15 item version of the three factor scale, showing convergent validity with the IRI, as well as with measures of Alexithymia and Hypomania, and confirming gender invariance. So, considering the aforementioned evidence, our aim was to evaluate a Chilean adaptation EQ regarding its structure and dimensional configuration. Since evidence of women’s superior empathy compared to men, have been steadily found (Lawrence et al., Reference Lawrence, Shaw, Baker, Baron-Cohen and David2004; Zhang et al., Reference Zhang, Xiang, Wen, Bian, Sun and Bai2018; Zhao et al., Reference Zhao, Neumann, Cao, Baron-Cohen, Sun, Cao, Yan, Wang, Shao and Shum2018), we also evaluated sex-differences in the EQ dimensions.
Concerning the theoretical implications of empathy, it has been inversely linked to antisocial traits (Preston & Anestis, Reference Preston and Anestis2020). For example, inverse correlations of empathy are typically found in individuals with high levels of aggression and anger (Blair, Reference Blair2018; Pascual-Sagastizabal et al., Reference Pascual-Sagastizabal, Sánchez-Martín, Vegas, Muñoz, Braza, Carreras, del Puerto-Golzarri and Azurmendi2019). In an experimental work, Stanger et al. (Reference Stanger, Kavussanu, McIntyre and Ring2016) found that empathetic athletes presented decreased aggression, compared to their non-empathic counterparts; which suggests that perspective taking (a cognitive empathy feature) may lessen anger within empathetic individuals, which would in turn reduce aggression. Additionally, they observed that women were more empathetic and less aggressive than men. These results support the observed by Bennet et al. (Reference Bennett, Farrington and Huesmann2005), who propose that women would have superior prosocial skills and reduced aggression in comparison to men, being attributable to sex differences in socio cognitive skills. A meta-analysis by Gantiva et al. (Reference Gantiva, Cendales, Díaz and González2018), established that less cognitive empathy is characteristic of aggressive individuals, but this is not the case for affective empathy. Nonetheless, a recent work found that affective empathy is associated with aggression and sex differences, but not cognitive empathy (Dryburgh & Vachon, Reference Dryburgh and Vachon2019). Hence, in terms of our research we hypothesized that the EQ scores would be inversely related to aggression and that aggression would predict differently the three empathy dimensions.
On another realm, the link between empathy and attachment was originally exposed in Bowlby’s theory (Reference Bowlby1982). This has recently resurfaced considering that both (empathy and attachment) are prosocial traits that most likely coincide with the development of a stable affiliative pattern underlying interpersonal relationships (Angulo et al., Reference Angulo, Estévez, Iriarte and Troyas2019; Stern & Cassidy, Reference Stern and Cassidy2018). In children, parental empathy has been associated to sensitive attachment, and the mother’s empathic concern in the IRI predicts negatively child neglect and future psychopathology (Stern et al., Reference Stern, Borelli and Smiley2014). In college students, a Serbian work found that Psychology compared to Science majors scored significantly higher in empathy, mentalizing capacity, and secure attachment (Dimitrijević et al., Reference Dimitrijević, Hanak and Milojević2011). Theoretically, secure attachment is characterized as an emotional bond that conveys sensitivity to other’s need, caring and basic trust, plus a cognitive internal working model that represent others as close and receptive; bearing the self comfortable at establishing interpersonal relationships (Stern & Cassidy, Reference Stern and Cassidy2018). According to Stern et al. (Reference Stern, Borelli and Smiley2014, p. 2) “internal working models manifest in individuals’ emotional and behavioral responses to others’ distress and correspond to individual differences in brain structure and function” which allow for the presence of empathy. Consequently, attachment closeness and dependence should be positively associated with the EQ and its dimensions, while anxiety should be inversely correlated. Thus, we predicted the different attachment components should account for particular variance in the empathy factors.
Based on prior research on the EQ, the goals of this study were two. First, assessing the structural validity of the translated version of the EQ in the Chilean population, and then applying a robust confirmatory approach as the scale discrete scoring merits (see Melchers et al., Reference Melchers, Li, Haas, Reuter, Bischoff and Montag2016). For this, we used a robust method for ordinal scales (Paolo Senese et al., Reference Paolo Senese, De Nicola, Passaro and Ruggiero2018) based on confirmatory factor analysis (CFA), and Parallel Analysis (PA) to determine dimensions and items to be retained in the translated scale (Matsunaga, Reference Matsunaga2010). In addition, we compared the fit of CFA to an Exploratory Structural Equational Modeling (ESEM) method (Marsh et al., Reference Marsh, Morin, Parker and Kaur2014), an increasingly recommended alternative for multidimensional scales with intercorrelated factors (Asparouhov & Muthén, Reference Asparouhov and Muthén2009). This is a more realistic approach for evaluating the scale, since discrete items can load freely on all dimensions (Joshanloo, Reference Joshanloo2018); particularly bearing in mind that the instrument was originally conceived as unidimensional. The second goal of our research was to assess the convergent validity of the EQ with the IRI, the most widely used measure of empathy previously adapted to Chile (Fernández et al., Reference Fernández, Dufey and Kramp2011), also evaluating the convergent validity of the EQ with a measure of aggression (Valdivia-Peralta et al., Reference Valdivia-Peralta, Fonseca-Pedrero, González-Bravo and Lemos-Giráldez2014). As another analysis of convergent validity we selected the dimensions of adult attachment as directly associated to empathy (closeness and dependence) and an inversely related trait (anxiety), which were assessed simultaneously with the EQ in an independent small community sample. Finally, we explore the prediction of the empathy dimensions from the convergent constructs.
Method
Participants
A sample of 376 adults voluntarily participated on the structural and initial convergent validity. All of them came to the laboratory to complete the measures, and then took part in a short experimental task not reported here. They were paid an incentive of $2,000 Chilean pesos (equivalent to $3.00 USD). Ethical approval was granted by the first author’s Institutional Ethics Committee, given that all participants received, read, and signed an informed consent before beginning to complete the scales. University students represented 58.4% of the sample, the remaining were professionals or technicians (23.8%), and 17.6% were workers with no additional University studies. Self-reported SES distribution was 12.9% medium-high, 57.8% medium, and 29.5% medium-low. We eliminated 43 participants that did not complete more than 70% of the questionnaires, ending up with a final sample of 336 individuals for the structural analysis (42.9% women), with a mean age of 24.98 (SD = 9.71), and no sex differences by age (t 332 = 1.387, p = .166).
For the second convergent validity analysis, we selected a voluntary and accidental community sample that did not receive any additional incentive, but excluded college students. Participants received the informed consent, EQ and attachment measure, to be completed in paper and pencil format. We followed the snowball method until reaching 102 individuals (65% women), mean age = 28.59 (SD = 12.04) with no mean age differences by sex (t 99 = 1.022, p = .309). This sample incorporated 78.4% of professionals or technicians, 17.6% workers, and 3.9% homemakers. The self-reported SES of this group was 9.8% medium-high, 63.7% medium, and 26.5% medium-low.
Measures
Empathy Quotient (EQ)
The original EQ (Baron-Cohen & Wheelright, Reference Baron-Cohen and Wheelwright2004) is a self-administered scale composed by 40 statements and 20 filler items. The 40 statements are descriptions of affective or cognitive empathy traits (e.g. “I can easily tell if someone else wants to enter a conversation”), and the 20 filler items are general assertions (e. g. “I prefer animals to humans”). A 4-point Likert scale is used, ranging from 1 (strongly agree) to 4 (strongly disagree). Each positively scored item is re-coded with zero points if it is equal to or below two, with one point if there is moderate empathy (a score of 3), and with two points if it is strongly empathetic (a score of 4). The filler items are discarded from the analysis. Half of the items are reverse scored (Baron-Cohen & Wheelright, Reference Baron-Cohen and Wheelwright2004), and the instrument has an informed global internal consistency of Cronbach’s alpha = .92. Zhao et al. (Reference Zhao, Neumann, Cao, Baron-Cohen, Sun, Cao, Yan, Wang, Shao and Shum2018) reported that, among all the validation studies, the unidimensional Cronbach’s alpha of the EQ ranges between .79 and .89. In the present study, overall Cronbach’s alpha for the first sample was .83, and for the community sample it was Cronbach’s alpha = .84.
We obtained the original EQ questionnaire from the Autism Research Centre, and we followed their terms and conditions for cross-cultural researchFootnote 1. The scale was translated and back translated by two bilingual Experimental psychologists following the recommendations for cross-cultural comparisons. First, one psychologist translated the EQ into Spanish, and then the second psychologist retranslated the scale into English. At that point the original and back translated versions were compared for semantical equivalence, and any discrepancies were discussed and revised until correspondence was reached. This process was continued until no differences in the meaning of the translated and back translated scales remained (Hableton & de Jong, Reference Hambleton and de Jong2003).
Interpersonal Reactivity Index (IRI)
IRI was developed by Davis (Reference Davis1983) and adapted to Chilean Spanish by Fernández et al. (Reference Fernández, Dufey and Kramp2011). The IRI is a measure of empathy encompassing four dimensions: Fantasy Scale (FS), which reflects the tendency to identify with fiction characters in books and novels; Perspective taking (PT), which reflects the capability to comprehend the point of view of others; Empathic concern (EC), which reflects the tendency to experiment sympathy and compassion for other people’s pain; and Personal distress (PD), which reflects the evoked anxiety and physiological commotion in face of an emergency or another person’s suffering. Each scale is composed by seven statements (nine of them inverted), which are scored on a 5-point Likert scale, ranging from 1 (does not describe me well) to 5 (describes me very well). Fernández et al. (Reference Fernández, Dufey and Kramp2011) reported Cronbach’s alpha for the IRI dimensions ranging from .70 to .76. For the current study, they ranged between Cronbach’s alpha = .70–.78.
Buss Perry Aggression Questionnaire (BPAQ)
BPAQ is a measure of different aggressive traits (physical aggression, verbal aggression, anger and hostility), which is widely used cross-culturally. 29 items compose the BPAQ and they are scored on a 5-point Likert scale, ranging from 1 (extremely uncharacteristic of me) to 5 (extremely characteristic of me). The Chilean adaptation (Valdivia-Peralta et al., Reference Valdivia-Peralta, Fonseca-Pedrero, González-Bravo and Lemos-Giráldez2014) found Cronbach’s alpha for the dimensions of the BPAQ ranging from .60 to .80, and in our results ranged between Cronbach’s alpha = .57 to .73.
Adult Attachment Scale
The Adult Attachment Scale was developed by Collins (Reference Collins1996) and adapted to Chilean Spanish by Fernández and Dufey (Reference Fernández and Dufey2015). The instrument evaluates three continuous dimensions of adult attachment: Closeness (feeling comfortable with relational intimacy), dependence (feeling supported by others affect), and anxiety (preoccupation for being abandoned or unloved). The scale presents 18 statements scored in a 5-point Likert scale, ranging from 1 (not at all characteristic of me) to 5 (very characteristic of me). The Cronbach’s alpha for the dimensions range from .73 to .83 in the adaptation studies and for our community sample it ranged from Cronbach’s alpha = .66 to .88.
Data Analysis
Analyses were carried out initially to test the unidimensional, and then the three-dimensional structure of the scale with Mplus 7.0 software. For these, and the following SEM analyses, we specified a simple structure. We used the weighted least square mean and variance adjustment (WLSMV), a robust estimator appropriate for categorical data with oblique target rotation option (Assis Gomes et al., Reference Assis Gomes, Almeida and Núñez2017). To evaluate model fit we considered the χ2/df statistic < 3, comparative fit index (CFI) ≥ .95, the Tucker-Lewis index (TLI) ≥ .95, root mean square error of approximation (RMSEA) ≤ .08, and weighted root mead square residual (WRMR) ≤ 1.00 (DiStefano et al., Reference DiStefano, Liu, Jiang and Shi2018).
Exploratory factor analysis and PA were used to establish the components configuring the Chilean EQ scale by means of SPSS 23 software and it was compared to Monte Carlo simulations described by Matsunaga (Reference Matsunaga2010).
EQ reliability was estimated with JASP 0.9.1.0 freeware and assessed with McDonald’s omega coefficient (ω), which is recommended for ordinal data as it allows item’s variance to vary freely (Dunn et al., Reference Dunn, Baguley and Brunsden2013). Cronbach’s alpha was also estimated since it is still widely reported in previous EQ research.
The final EQ factors correlation was estimated using the indices from the ESEM and the Pearson correlation coefficient. The dimensions were compared by sex using t-test. Convergent validity estimations were performed by means of Pearson correlational analyses of the EQ factors with the other instruments. Other measure’s internal consistency was estimated in SPSS 23. Multiple linear regressions followed by stepwise regressions were used to estimate the amount of variance explained by the convergent instruments on the EQ factors.
Results
Missing data did not exceed 5% in any of the items of the EQ, and the assumptions of univariate normality were verified by analysis of asymmetry and kurtosis, which presented values not exceeding the ± 2 criteria (Li, Reference Li2015). Demographic variables show no significant changes in neither sample by working area (Fs < 1.3, ps > .230), or SES (Fs < 1.4, ps > .830). However, there was a significant direct correlation between ER and age in the larger sample (r = .14, p = .010), which was also found in the community sample (r = .29, p = .003). Additionally, a direct significant correlation of SS and age (r = .26, p = .009) was found.
Confirmatory Factor Analysis of the Original Chilean Adaptation of the EQ Scale and Dimensions
Initial CFA of the original 40 items unidimensional scale (Baron-Cohen & Wheelright, Reference Baron-Cohen and Wheelwright2004) was carried out, but the fit statistics revealed that this would not be an acceptable fit to the data (see Table 1). Next, we tested Lawrence et al.’s (Reference Lawrence, Shaw, Baker, Baron-Cohen and David2004) three factor scale, but again, as Table 1 shows, fit statistics did not support this model.
Table 1. Confirmatory and Exploratory Analyses and Fit Indices of the Original EQ and Alternative CFA and ESEM Models
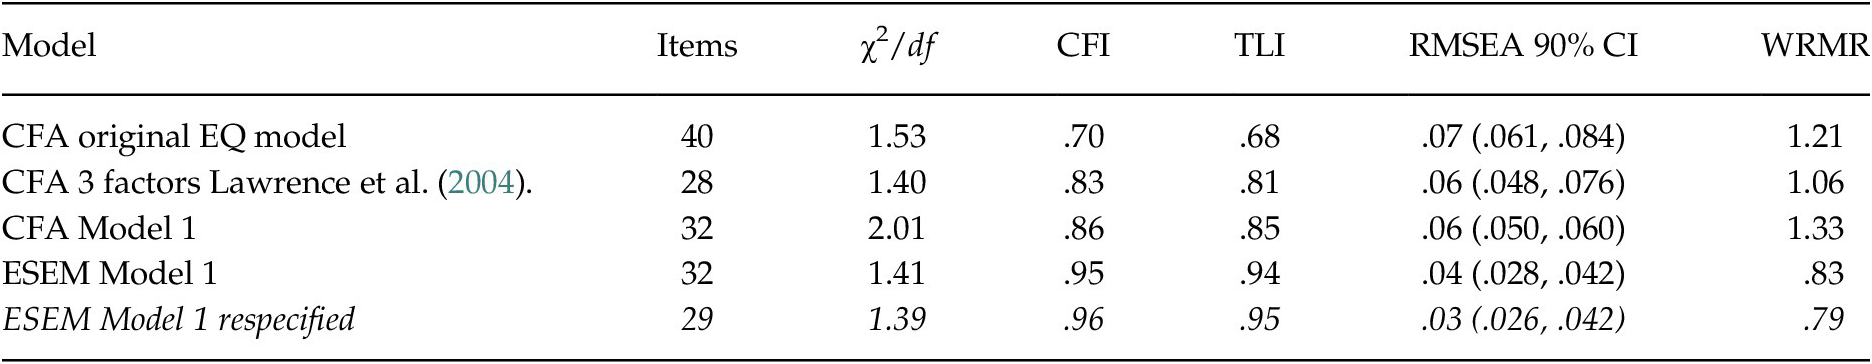
Note. The model retained appears in italics. It corresponds to the respecified model in the present adaptation.
Factor Exploration and Parallel Analyses
Due to the lack of fit of the original models, an EFA with principal axis factoring and Promax rotation was conducted with the 40 components of the questionnaire, resulting in a reasonable to factorize data matrix (Kaiser- Mayer- Olkin = .861; Barlett’s Test of Sphericity equal to χ2 3014.688, df = 780, p < .001). Three factors were extracted explaining 24,86% of the scale variance and distributed among 32 items (see Table 2).
Table 2. Parallel Analysis of the Actual and Simulated Data Extraction
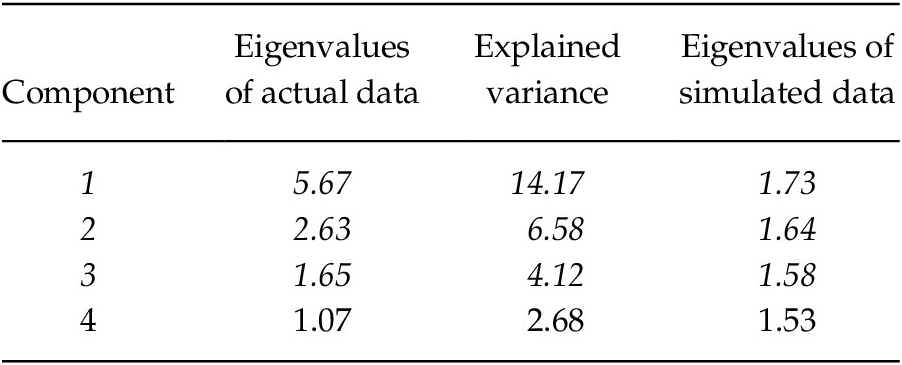
Note. Eigenvalues and variance explained on the actual data surpassing the values of simulated data appear in italics, and are the three factors of the EQ retained.
Confirmatory Factor Analysis and Exploratory Structural Equational Modeling of the EQ
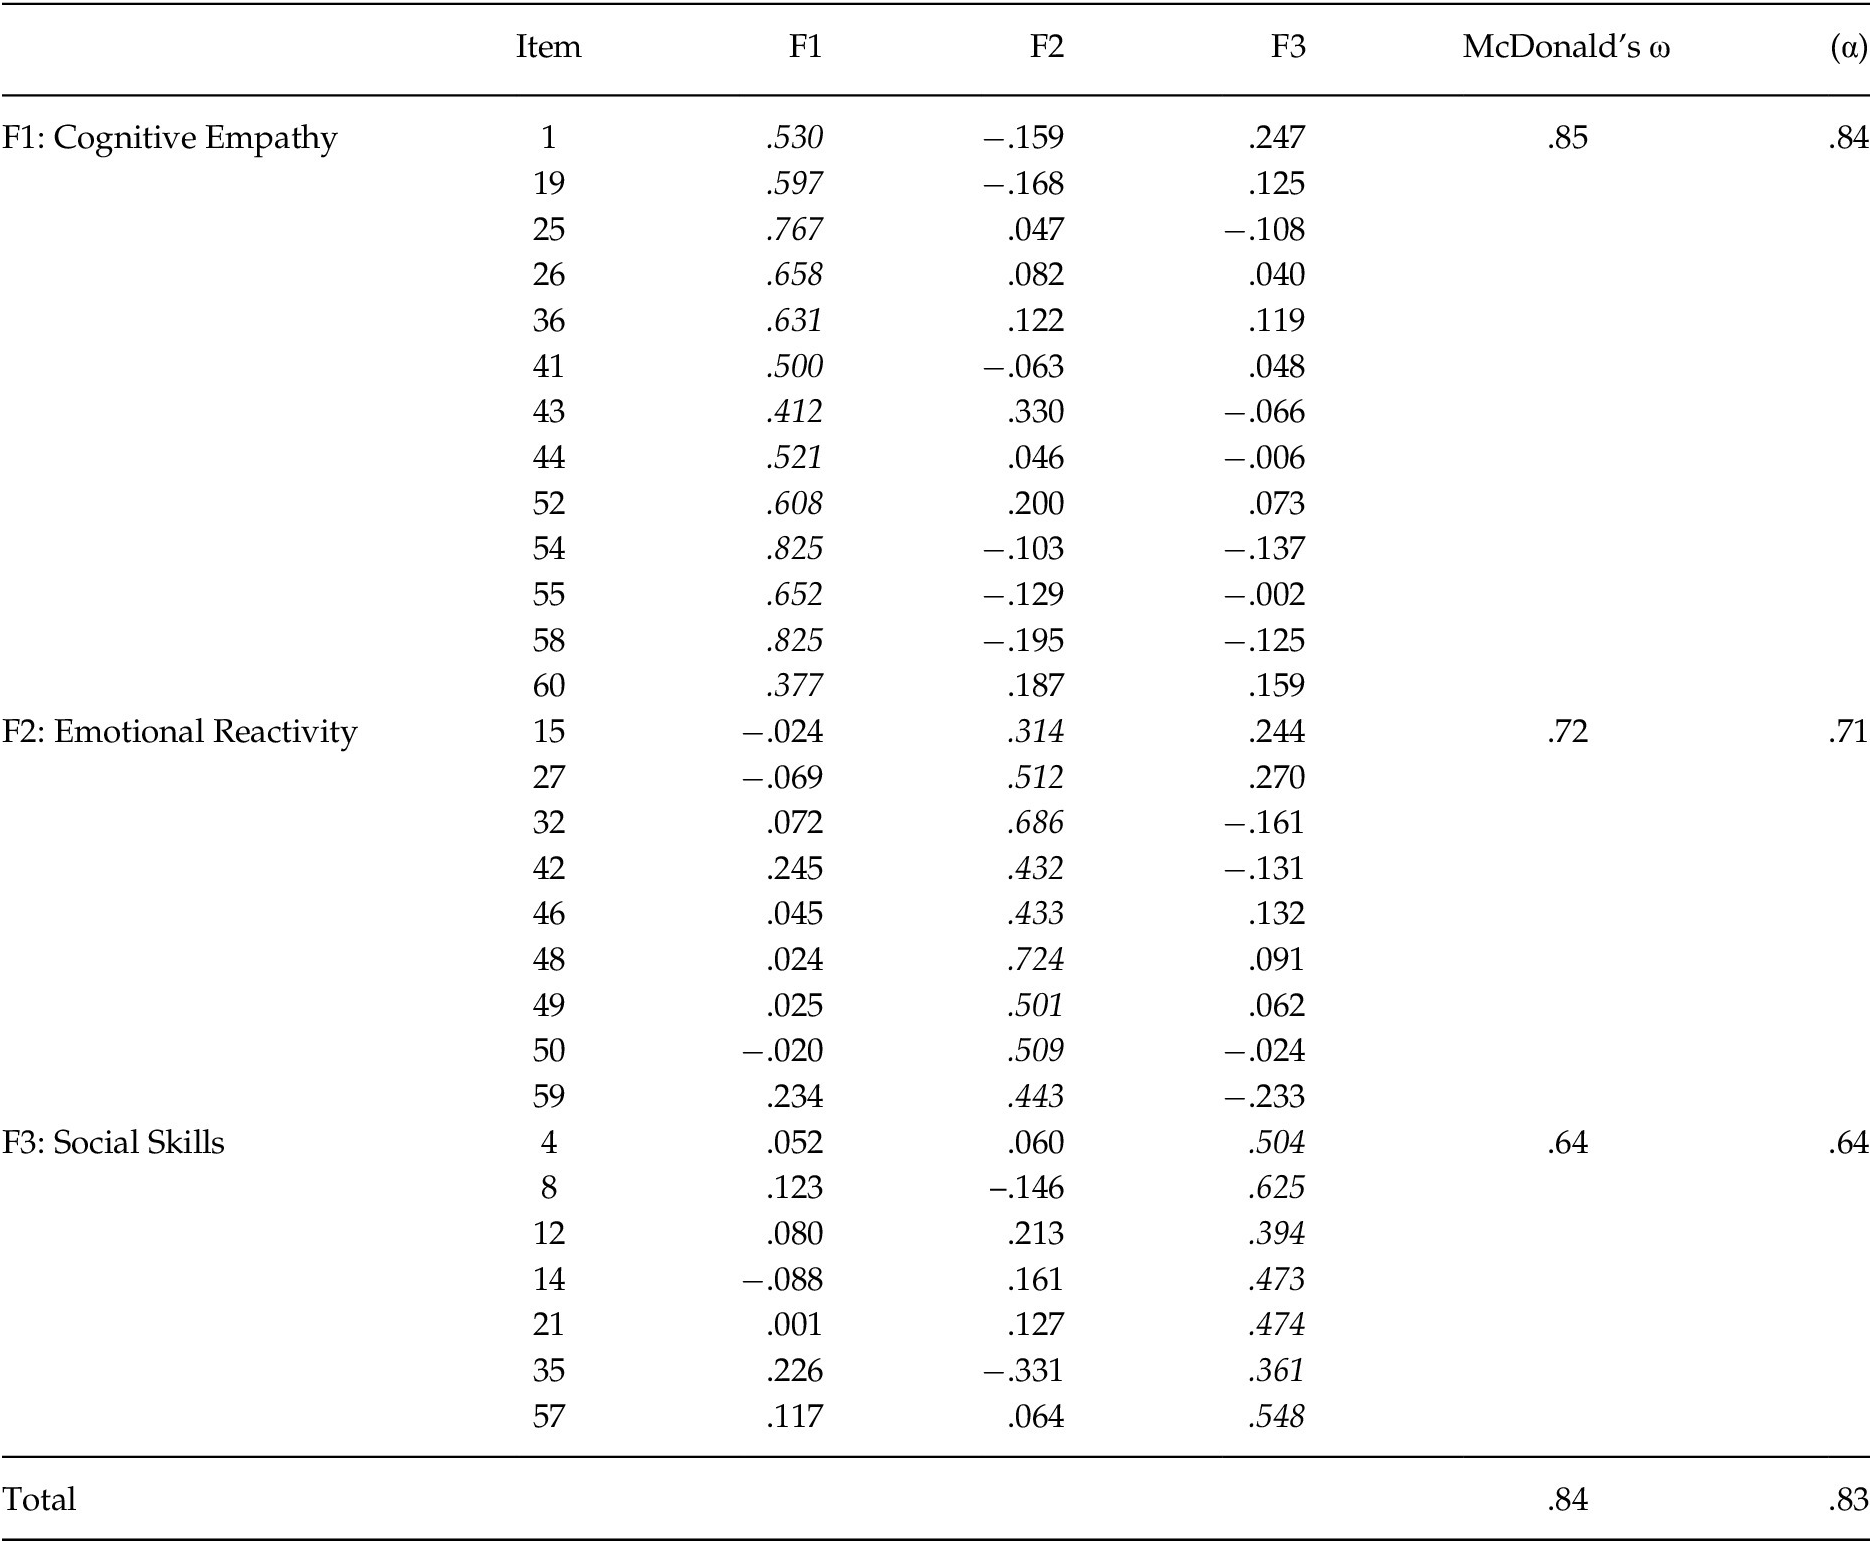
Model fit statistics for CFA and ESEM analyses are presented in Table 1. The first three factors CFA of the 32 items extracted from the PA did not reach good fit statistics. For that reason, an ESEM analyses was run, resulting in close to optimal fit indices, and suggesting to respecify the model with 29 components: Eliminating Item 6 (which had a factor loading below .30), and items 38 and 22 because of cross-loadings. This latter respecified model reached optimal fit indices and the lowest WRMR, so it was retained as our Chilean version of the EQ (see Table 3 for the final component and factor configuration). Reliability indices of the three dimensions and for the overall EQ also appear on Table 3.
Table 3. Standardized Saturations of the Final EQ Model per Factor, Dimensions and Total EQ Scores and Reliability

Note. Factor weights for the corresponding dimension appear in italics. The model corresponds to ESEM with oblique target rotation.
The correlation among the three EQ dimensions was positive: CE and ER (r = .30, p < .001), CE and SS (r = .32, p < .001), ER and SS (r = .27, p < .001). The standardized correlation values derived from the respecified ESEM were CE and ER (r = .25, p < .01), CE and SS (r = .23, p < .01), ER and SS (r = .24, p < .01).
Convergent Validity
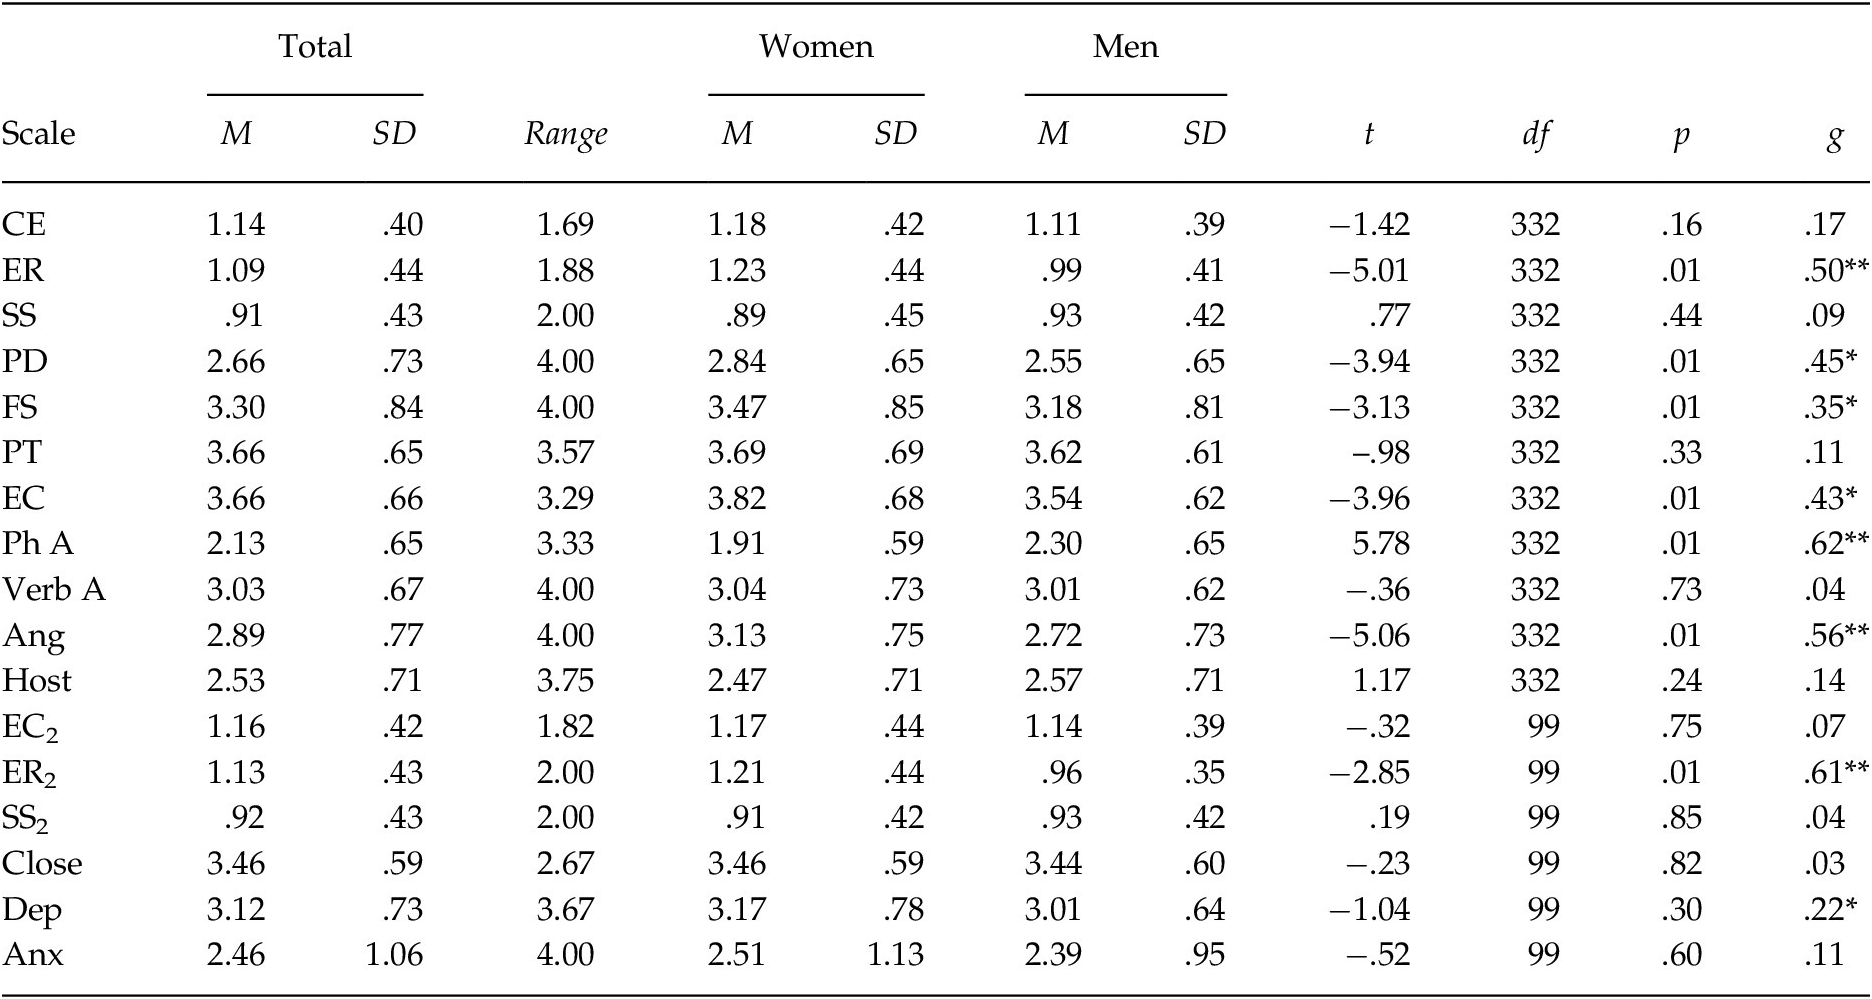
The only EQ factor that resulted in higher scores for women (SUM = 9.79, SD = 3.48) than men (SUM = 7.89, SD = 3.28) was ER in both the large and the small community sample (see Table 4).
Table 4. Mean and Standard Deviation of the EQ Dimensions and Convergent Subscales

Note. EQ dimensions: CE = cognitive empathy; ER = emotional reactivity; SS = social skills. IRI dimensions: PD = personal distress; FS = fantasy scale; PT = perspective taking; EC = empathic concern, on the IRI. BPAQ dimensions: Ph A = physical aggression; Verb A = verbal aggression; Ang = anger, Host = hostility. CE2, ER2 & SS2 are the EQ dimensions for the community sample (n = 102). Attachment dimensions: Close = closeness; Dep = dependence; Anx = anxiety.
g = Hedge’s g effect size statistic for different n per group;
* small > .2.
** medium > .5.
*** large > .8.
As Table 4 shows, on the IRI subscales women had higher scores than men in PD, FS, and EC, but in PT there were no differences by sex. Next, we checked sex differences in the BPAQ, confirming that men had higher scores in physical aggression than women, while women reached higher scores in anger than men. Finally, we observed no sex differences for any of the attachment subscales in the community sample.
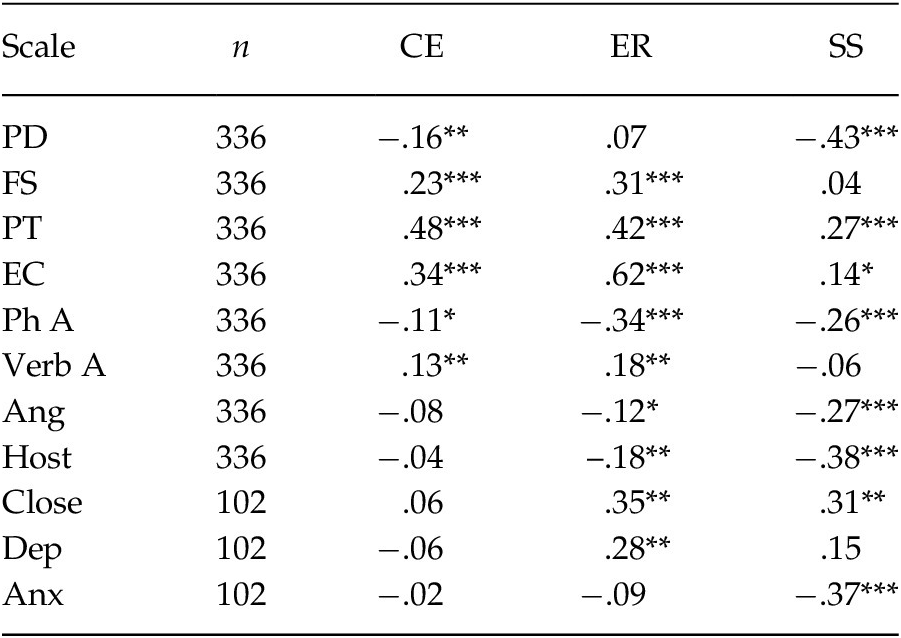
Predicted positive correlations of the EQ and empathic IRI dimensions were confirmed for CE and ER with FS, PT and EC, and for SS with PT and EC.
Likewise, ER was positively correlated with close and dependence dimensions of attachment, while SS also correlated directly with close (see Table 5).
Table 5. Pearson Correlation Coefficients between the EQ, IRI, and BPAQ in Chile

Note. EQ dimensions: CE = cognitive empathy; ER = emotional reactivity; SS = social skills. IRI dimensions: PD = personal distress; FS = fantasy scale; PT = perspective taking; EC = empathic concern; on the IRI. BPAQ dimensions: Ph A = physical aggression; Verb A = verbal aggression; Ang = anger; Host = hostility. Attachment dimensions: Close = closeness; Dep = Dependence; Anx = anxiety.
* p < .05.
* p < .01.
*** p < .001.
As Table 5 shows, the IRI’s adverse symptoms of empathy (PD) was inversely associated with CE and SS. CE was negatively correlated with physical aggression, ER with physical aggression, anger and hostility, and SS with physical aggression, anger and hostility. In addition, SS showed a negative correlation with the anxious dimension of attachment.
An unpredicted association between empathy and aggression was found, CE and ER was positively correlated with verbal aggression, but in a lower magnitude (see Table 5).
Regression analyses
The prediction of CE by the BPAQ factors, resulted in significant but low variance explained, R 2 = .06, F (4, 329) = 5.59, p < .001. Following, a stepwise regression yielded physical aggression as negative (β = –.12, t = –3.50, p = .001) and verbal aggression as positive predictor of CE (β = .11, t = 3.27, p = .001).
A total of 13% of variance in ER was explained by the physical aggression BPAQ dimension, F (4, 329) = 11.91, p < .001, which according to a stepwise regression was negative (β = –.23, t = –6.63, p < .001).
A multiple linear regression yielded all but physical aggression BPAQ subscales as significant predictors of SS, R 2 = .17, F (4, 329) = 17.11, p < .001. Next, results of a stepwise regression showed that only hostility was a significant negative predictor of SS (β = –.22, t = –7.47, p < .001).
Regarding the prediction of EC from the attachment dimensions, a multiple linear regression was not significant, R 2 < .01, F (3, 98) = .38, p > .762. Next, a multiple regression predicting ER from the attachment dimensions explained 16% of variance, F (3, 98) =.6.06 p < .001, with closeness as the only positive predictor of ER after a stepwise regression, β = .25, t = 3.74, p < .001. Finally, the prediction of SS by the attachment factors resulted in 17% of the variance explained, F (3, 98) = 6.80, p < .001, with close and anxiety as direct predictors. The results of a stepwise regression yielded anxious attachment as negative (β = –.12, t = –2.99, p = .004) and closeness as positive predictor of SS (β = .15, t = 2.15, p = .034).
Discussion
The main purpose of this research was adapting the Empathy Quotient to a Chilean Spanish version, using updated robust SEM methods to assess previously proposed EQ models, and to evaluate the convergent validity of the Chilean EQ with other measures.
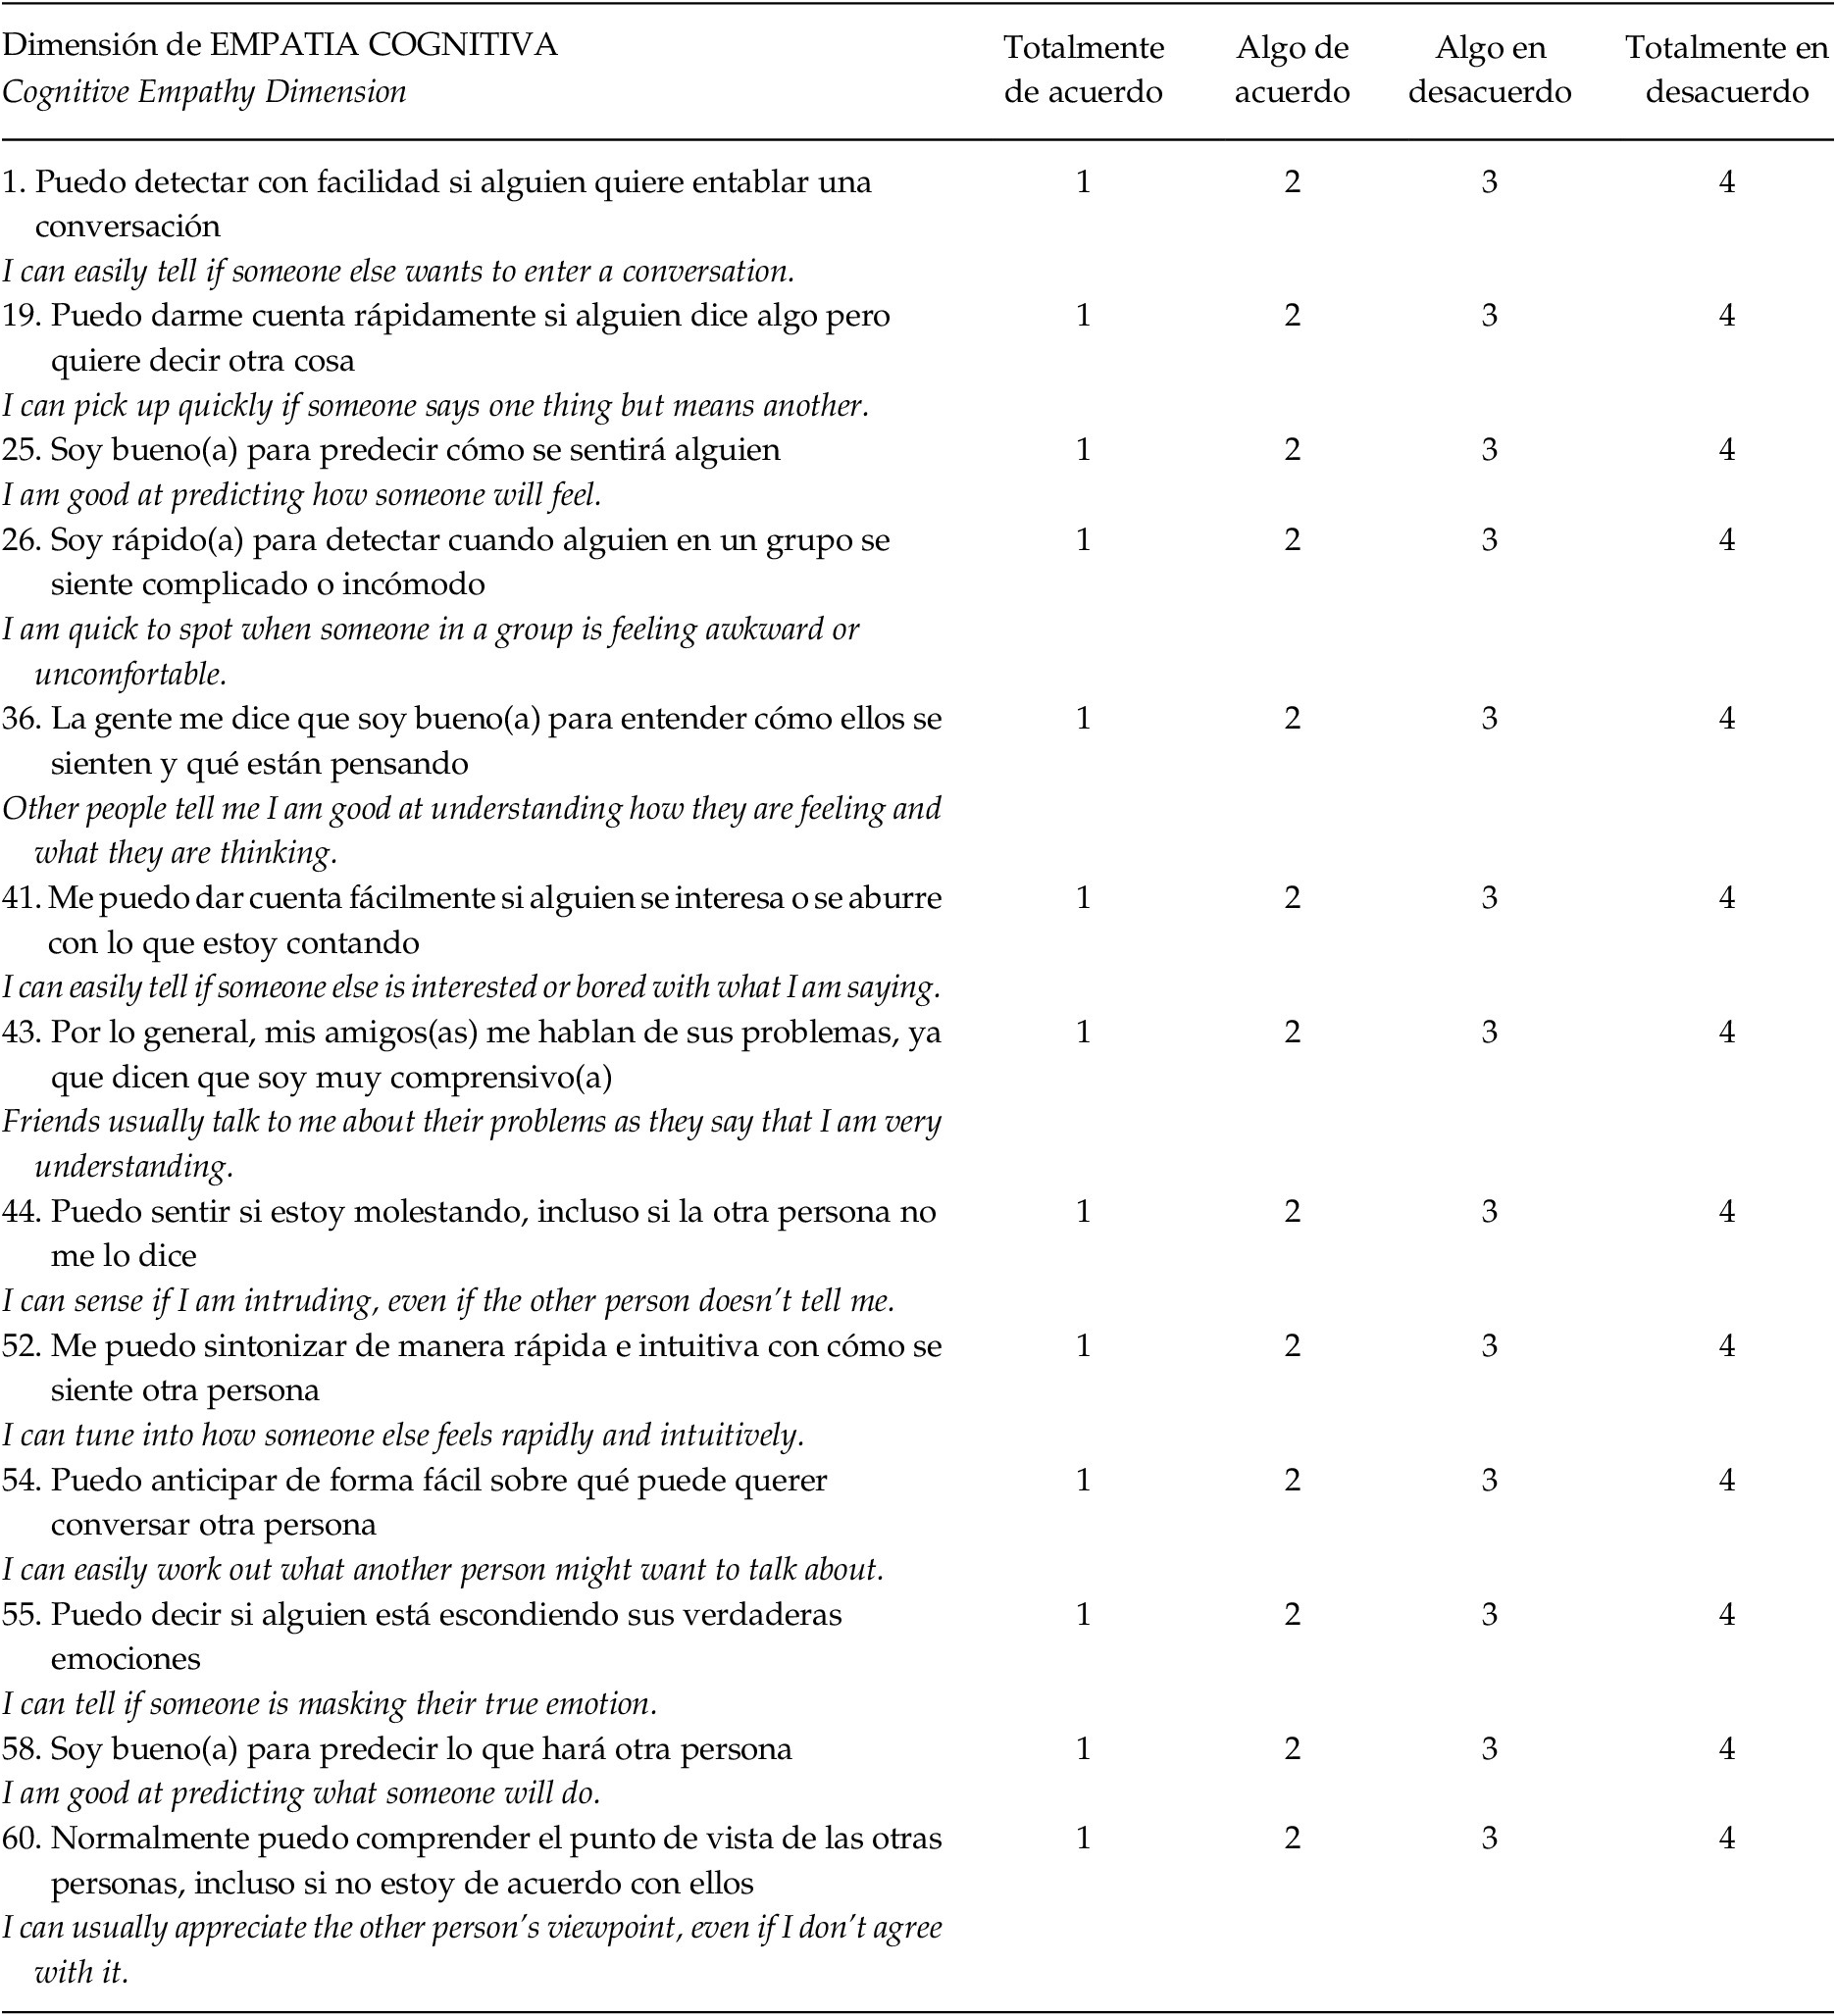
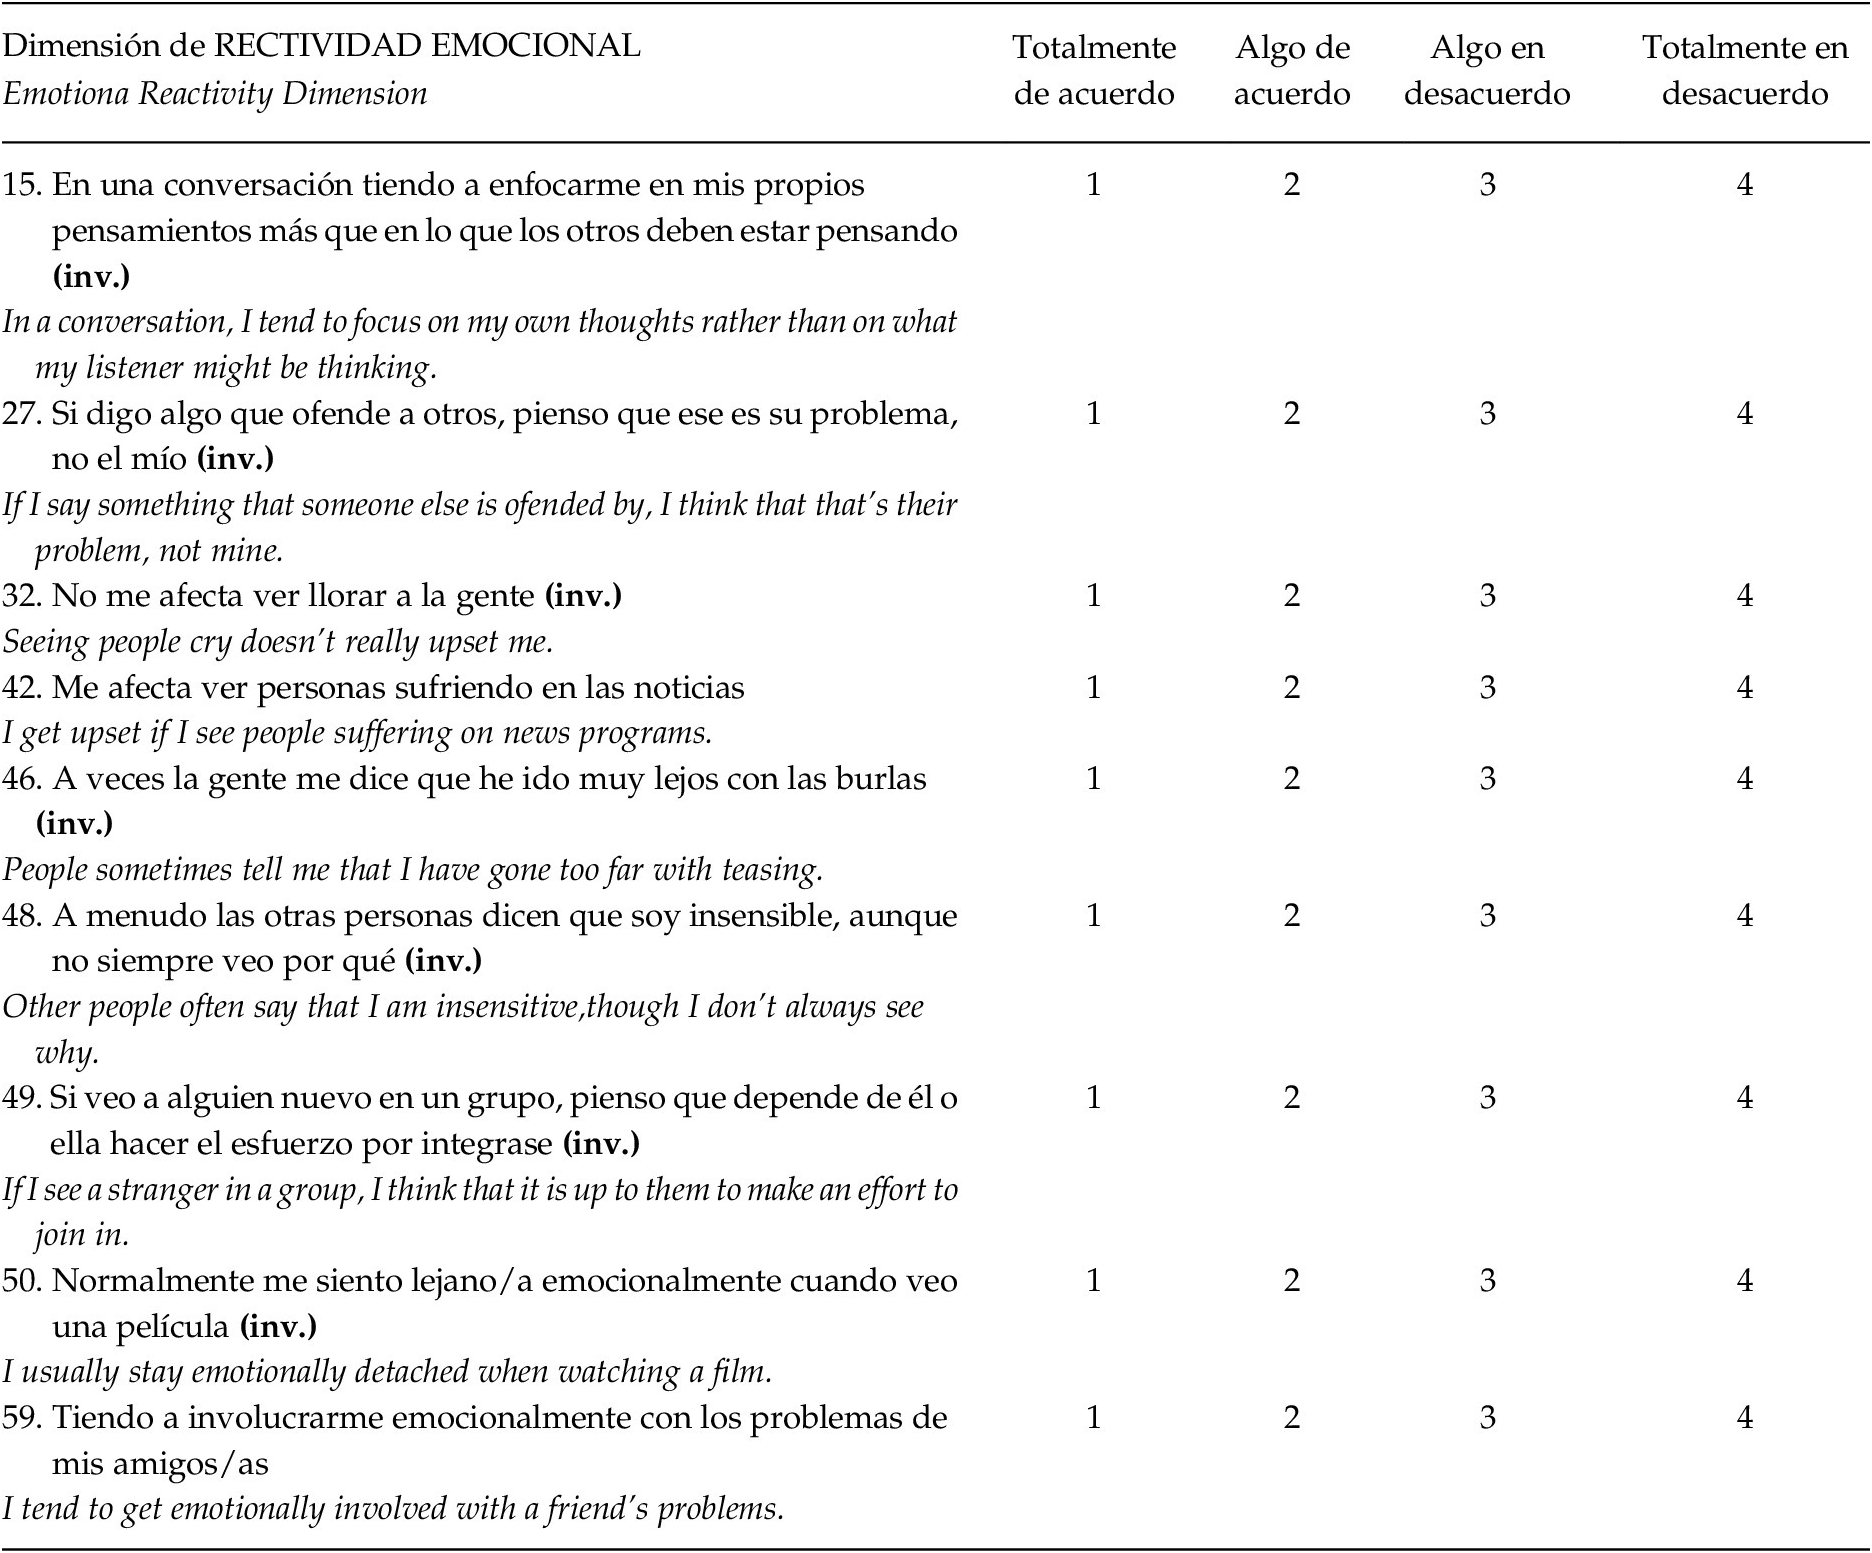
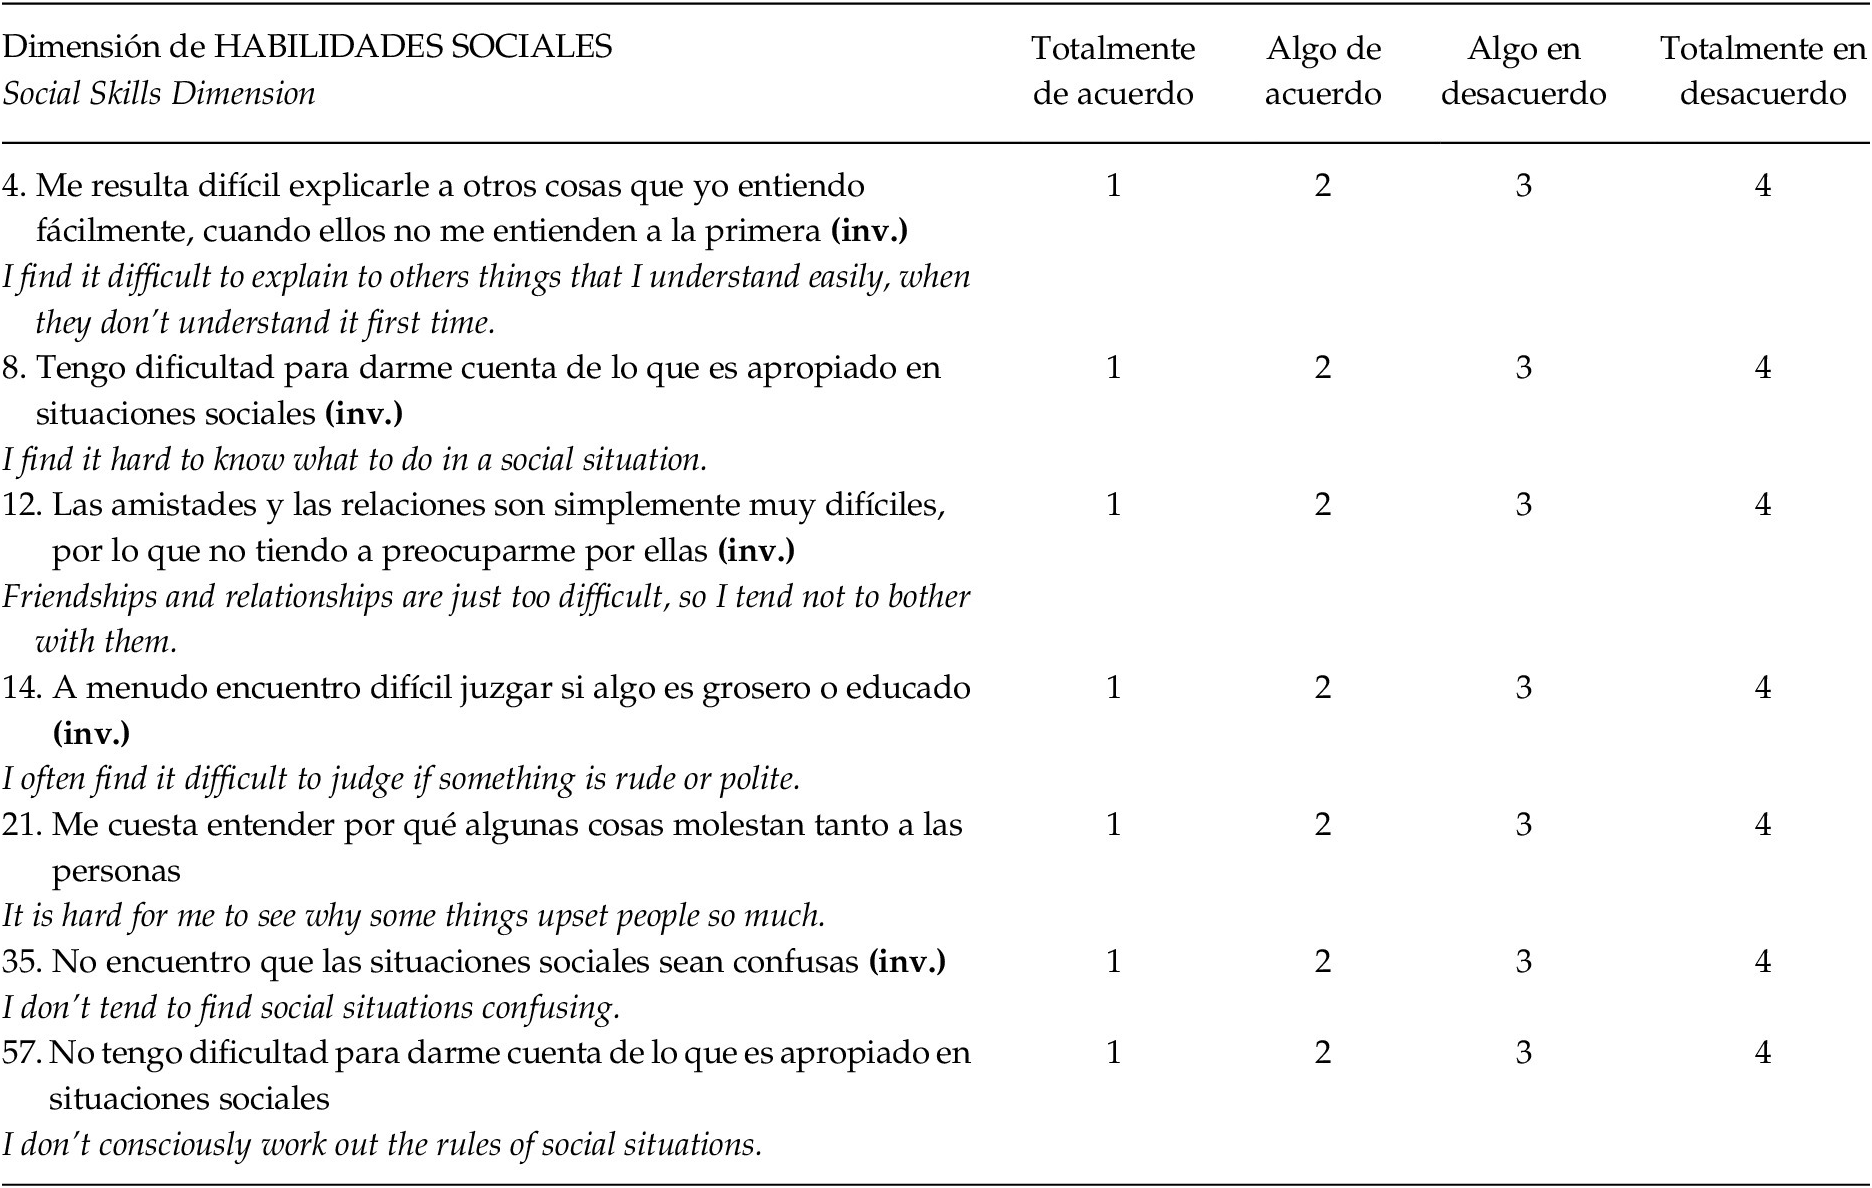
Based on CFA, the original unidimensional scale proposed by Baron-Cohen et al. (Reference Baron-Cohen and Wheelwright2004) was not fitted for the data, neither the specific dimension’s configuration reported by Lawrence et al. (Reference Lawrence, Shaw, Baker, Baron-Cohen and David2004). Next, the results of an exploratory factor analysis and parallel data simulation confirmed the three dimensional structure of empathy (Hall & Shwartz, Reference Hall and Schwartz2018), yielding that CE, ER and SS were suitable to account for the factor arrangement extracted from the data. So the scale was then reduced from 32 to a 29 items model by ESEM. CE represents the first dimension about cognitive aspects of empathy, composed by elements that pertain to high levels on perspective taking (Decety, Reference Decety, Malle and Hodges2005), and characterized by an individual’s awareness of cognitions, intentions, as well as feelings of others. In fact, this first cognitive factor in the Chilean EQ varied in only two components from Lawrence et al.’s (Reference Lawrence, Shaw, Baker, Baron-Cohen and David2004) study, with the addition of Items 60 (“I can usually appreciate the other person’s viewpoint, even if I don’t agree with it”) and 43 to this dimension (“Friends usually talk to me about their problems as they say that I am very understanding”). Conversely, ER remained as a dimension that gathers statements about the affective reactions triggered by other’s thoughts, feelings or social closeness, which varied in three elements from Lawrence et al.’s work, shifting Item 43 to EC (see above), and eliminating Items 6 (“I really enjoy caring for other people”) and 22 (“I find it easy to put myself in somebody else’s shoes”) from the scale. The SS factor is the most novel dimension of the scale, compared to other measures of empathy, as it reflects the individuals’ ability to understand social cues and drive their behavior in social interactions. In our study, SS incorporated all of the components in Lawrence et al.’s factor configuration, adding Item 21 (“It is hard for me to see why some things upset people so much”).
Similar to the associations in Lawrence’s et al.’s (Reference Lawrence, Shaw, Baker, Baron-Cohen and David2004) study, and most recently by Paolo Senese et al.’s (Reference Paolo Senese, De Nicola, Passaro and Ruggiero2018) reports on EQ dimensions correlations, another aspect that supports the EQ structural validity is the significant correlations among the three empathy factors in the present sample. All associations were in the low magnitude, but refer to the cognitive, affective and social aspects of this trait as a whole. However, a couple of cross loadings did appear, with Item 43 from the cognitive empathy dimension loading on emotional reactivity, and Item 35 which corresponds to social skills loading also on emotional reactivity. This makes theoretical sense since the cognitive and affective aspects of empathy do meet in the perception that others share their concerns and talk about their problems, as well as is the case for social skills and emotional reactivity, leading to the ability to comprehend social situations.
In addition, differences by sex were found in ER. Specifically, we found highest scores of ER in women, consistent with Lawrence et al.’s (Reference Lawrence, Shaw, Baker, Baron-Cohen and David2004) work which also found this difference but only in CE. Nevertheless, Paolo Senese et al. (Reference Paolo Senese, De Nicola, Passaro and Ruggiero2018) obtained an identical correlation to ours in an Italian population, which is a Latin context like Chile. This outcome is in line with theoretical predictions that women are better expressing affectivity in prosocial settings, at the same time they are more efficient reading other’s feelings, which is coherent with the conception of empathy on the dimension of ER (Baron-Cohen & Wheelwright, Reference Baron-Cohen and Wheelwright2004; Dryburg & Vachon, Reference Dryburgh and Vachon2019).
Regarding the second objective of this report, aimed at assessing convergent validity to account for predictable associations of the EQ dimensions with other widely used measure of empathy such as the IRI, it was confirmed in the Chilean context. Regarding the convergence of the EQ and IRI factors, positive and medium size associations among CE and PT, and ER with EC, sustain the cognitive and affective scope of these EQ dimensions. Similarly, the positive correlation (but lower in magnitude) of cognitive and emotional empathy in the EQ with the emotional and cognitive dimensions of the IRI, one-to-one, seems to reinforce the soundness of these dimensions, as alike empathy components. Finally, the associations of EC and ER with FS, support the relationship that imaginary identification, representation of fictional characters, and fantasy in general, have to cognitive and emotional empathy (Brown et al., Reference Brown, Thibodeau, Pierucci and Gilpin2017; Davis, Reference Davis1983).
On the inversely associated convergent validity, the strongest negative association of SS with the IRI dimension of PD, while PD had a low negative relationship to CE, can be interpreted as SS being an accurately empathic component that breaches into the realm of social understanding necessary for social cognition, which in turn relates to diminished personal distress. This would also be true if CE may be indicative that being able of understanding other’s mind declines personal distress in face of emergency situations. Likewise, increasing SS in face of low PD may be an indicator of sympathy (Davis, Reference Davis1983).
Concerning the second line of convergent validity that evaluated the relationship between the adapted EQ scales and aggression, it was established that high CE was related to low levels of physical aggression (as it was described recently by Gantiva et al., Reference Gantiva, Cendales, Díaz and González2018), and that more ER scores are related to lower levels of physical aggression, anger and hostility. By this same token, SS were high in individuals that reported low levels of physical aggression, anger and hostility. As it would be expected if we consider that empathy is in opposition to aggressive traits, and in particular affective empathy seems to be attenuated by aggression from early childhood (Noten et al., Reference Noten, van der Heijden, Huijbregts, van Goozen and Swaab2019), and later on in adulthood (Dryburg & Vachon, Reference Dryburgh and Vachon2019). Also, an anticipated result was that physical aggression was significantly higher in men compared to women, while anger was higher in females compared to males, an outcome previously reported with the IRI dimensions too (Fernández et al., Reference Fernández, Dufey and Kramp2011).
One last facet of convergent validity was the predicted direct relationship of empathy and secure attachment traits observed in the community sample, but only for the emotional and social dimensions. High levels of ER were associated with high levels of attachment closeness as well as dependence, while SS was higher in individuals with increasing attachment closeness and decreasing attachment anxiety. This fortifies the idea that the dimension of social skills captures a particular aspect of prosociality linked to empathy, which could be related to a positive view of others boosting closeness (see Stern & Cassidy, Reference Stern and Cassidy2018), while attenuating the development of attachment anxiety (Angulo et al., Reference Angulo, Estévez, Iriarte and Troyas2019). In terms of measurement strengths, it is precisely Collin’s attachment anxiety scale that counts with the highest reliability considering it is only a six item dimension.
An additional result in our study was the predictive value of the convergent measures on the EQ dimensions, for a more complete understanding of the various traits of empathy encompassed in the scale. Concerning aggression, our results showed that physical and verbal aggression predicted similar amounts of variance in CE, negatively the earlier and positively the latter, suggesting that physical aggression anticipates reactive aggression, while verbal aggression may be a more generalized aspect of social interaction. Similarly, physical aggression was also the only negative predictor of ER, so we interpret this as indicative that this kind of aggression could potentially mitigate cognitive empathy as well as affective empathy, by potentiating reactive aggression as Blair (Reference Blair2018) has suggested. One last aspect that deserves attention is that the dimension of hostility was the only relevant predictor of SS, which could be understood as an aggression component pertaining to a negative view of others, the social context, and adverse expectations about social relationships (Stanger et al., Reference Stanger, Kavussanu, McIntyre and Ring2016).
To conclude the predictive validity analysis, we must mention that, contrary to our expectation, CE was not anticipated by any of the attachment dimensions, which may be indicative that the cognitive side of empathy is not directly related to affiliative motives and cognitions, both important for the formation of internal working models of attachment in the measure we selected (Collins, Reference Collins1996; Stern et al., Reference Stern, Borelli and Smiley2014). Nevertheless, closeness was a significant predictor of ER, which we associate to a general welcoming of interpersonal relationships, that is also captured in ER, and relates to models of others as close and receptive (Stern & Cassidy, Reference Stern and Cassidy2018). In this line, the negative prediction by anxious attachment and the positive prediction of SS by attachment closeness, make theoretical sense if we consider SS as an empathy dimension that refers to prosociality, which has been recurrently suggested to be a crucial aspect of attachment closeness, but a limiting or deficient trait in attachment anxiety (see Stern & Cassidy, Reference Stern and Cassidy2018 and Thompson & Gullone, Reference Thompson and Gullone2008).
Largely, our study makes a significant contribution to the assessment of empathy in a novel context, although a number of limitations must be noted. First, our initial sample belongs to community participants and college students which were educated adults, and our second community sample was also educated but excluded students. Since no probability sampling was used for the study, we cannot extend the results to young adolescents, minority populations, clinical samples or other particular individual differences (see Appendix for the final version of the Chilean EQ). Likewise, since we did not evaluate the test-retest reliability of the EQ, we cannot predict the consistency of the empathy dimensions across time. Third, due to reduced size of both samples the risk of over-adjustment of the Chilean EQ must be discarded with a new sufficiently large sample from this population (see Garrido et al., Reference Garrido, Barrada, Aguasvivas, Martínez-Molina, Arias, Golino, Legaz, Ferrís and Rojo-Moreno2020), as well as invariance testing for sex-differences. Therefore, the differences by sex mentioned above should be interpreted with caution until such invariance is confirmed. Finally, our method is limited to convergent self-report measures, so we cannot establish concurrent validity with behavioral traits, nor experimental empathy evidence.
Appendix
Empathy Quotient 29 Item Chilean Version (3 dimensions)
A continuación hay una lista de afirmaciones que podrían describirle. Por favor, lea cuidadosamente cada una de ellas e indique qué tan de acuerdo o en desacuerdo, marcando con una X en la casilla que corresponda. No hay respuestas correctas e incorrectas.
* In Italics, is each original item in English.
– Los ítems positivos se puntúan de acuerdo a la siguiente escala:
Totalmente de acuerdo = 2 puntos
Algo de Acuerdo = 1 punto
Algo en Desacuerdo = 0 puntos
Totalmente en Desacuerdo = 0 puntos
– Los ítems invertidos (inv.) se puntúan de forma inversa.