Personality traits are related to different life outcomes such as psychopathology, school and work performance, health and longevity or marital success (Jackson, Connolly, Garrison, Leveille, & Connolly, Reference Jackson, Connolly, Garrison, Leveille and Connolly2015; Kuncel, Ones, & Sackett, Reference Kuncel, Ones and Sackett2010; Roberts, Kuncel, Shiner, Caspi, & Goldberg, Reference Roberts, Kuncel, Shiner, Caspi and Goldberg2007; Widiger, Reference Widiger2015). At the same time, most of the research on personality traits has been carried out under the Five-Factor Model (FFM), which has become a consensus model that offers a useful descriptive taxonomy according to many personality psychologists (John, Neuman, & Soto, Reference John, Neumann, Soto, John, Robins and Pervin2008; McCrae & Costa Jr, Reference McCrae and Costa2010). The FFM or Big Five proposes the broad traits of openness to experience, extraversion, agreeableness, conscientiousness, and neuroticism (or its positive pole, emotional stability). Openness represents individual differences in curiosity, fantasy, appreciation of art and beauty, and social attitudes; extraversion reflects individual differences in sociability, social ascendency, activity, excitement seeking, and positive emotionality; agreeableness reveals individual differences in compliance, empathy, collaboration, and altruism; conscientiousness represents individual differences in being methodical, planning, impulse control, and to respect and abide conventional social norms and rules; and neuroticism refers to individual differences in the tendency to experience frequently and intensively negative emotions such as anxiety, fear, depression, irritability and to have low self-esteem (Morizot, Reference Morizot2014).
The development of short questionnaires measuring the Big Five personality traits is common in psychology research for different reasons. One of the most relevant is the limited time of administration, especially when using various assessment instruments (Gosling, Rentfrow, & Swann Jr, Reference Gosling, Rentfrow and Swann2003). Another reason is to facilitate the cooperation of certain respondents, such as children and adolescents (McCrae & Costa Jr, Reference McCrae and Costa2007). A number of such measures exists, such as Big Five Questionnaire-Children version (BFQ-C; Barbaranelli, Caprara, Rabasca, & Pastorelli, Reference Barbaranelli, Caprara, Rabasca and Pastorelli2003), Mini-International Personality Item Pool Big Five Measure (Mini-IPIP; Donnellan, Oswald, Baird, & Lucas, Reference Donnellan, Oswald, Baird and Lucas2006), Ten-Item Personality Inventory (TIPI; Gosling et al., Reference Gosling, Rentfrow and Swann2003), Big Five Inventory (BFI; John, Donahue, & Kentle, Reference John, Donahue and Kentle1991; John et al., Reference John, Neumann, Soto, John, Robins and Pervin2008), NEO Five-Factor Inventory-3 (NEO-FFI-3; McCrae & Costa Jr, Reference McCrae and Costa2010), Mini Modular Markers (3M40; Saucier, Reference Saucier2002), Short form of the Junior Spanish version of the NEO-PI-R (JS NEO-S; Ortet et al., Reference Ortet, Escrivá, Ibáñez, Moya, Villa, Mezquita and Ruipérez2010; Reference Ortet, Ibáñez, Moya, Villa, Viruela and Mezquita2012) or Big Five Personality Trait Short Questionnaire (BFPTSQ; Morizot, Reference Morizot2014), among others. These brief measures assess the five broad personality dimensions that should encompass several narrow traits. Thus, an important concern is that a short measure of a broad construct has limited conceptual bandwidth when some narrow or primary personality traits are not represented (Smith, Fischer, & Fister, Reference Smith, Fischer and Fister2003). A consequence is the limitation of content validity of some of these scales, especially taking into account that the FFM is used, as mentioned above, to predict a multitude of criterion variables (Kuncel, Ones, & Sackett, Reference Kuncel, Ones and Sackett2010; Roberts et al., Reference Roberts, Kuncel, Shiner, Caspi and Goldberg2007).
Morizot (Reference Morizot2014) developed the BFPTSQ to create a short Big Five personality measure with more adequate conceptual breadth. The procedure consisted in modifying an existing short questionnaire, the BFI (John et al., Reference John, Donahue and Kentle1991; Reference John, Neumann, Soto, John, Robins and Pervin2008), adding items tapping missing important primary traits in the original BFI. For instance, he added an item tapping sensation seeking (represented by the FFM facet excitement seeking) for extraversion or an item tapping machiavellianism (represented by the FFM facet straightforwardness) for agreeableness. The final 50-item BFPTSQ has got seven new items, each one tapping one of the seven FFM facets (openness to values, excitement seeking, positive emotions, straightforwardness, deliberation, vulnerability, and angry hostility) not well represented in the BFI. One openness item from the original BFI was deleted because it was judged less relevant for adolescents and not central to the target construct (“prefer work that is routine”). Also, an extraversion item that was judged equivocal (“generates a lot of enthusiasm”) was replaced with an item tapping social dominance or leadership (“is a leader, capable of convincing others”). The resulting BFPTSQ (Morizot, Reference Morizot2014) in adolescents had adequate content validity, recovered the Five Factor structure, the correlations with the NEO-PI-3 (McCrae & Costa Jr, Reference McCrae and Costa2010) scales suggested suitable convergent validity, and the correlations with the outcome measures, including substance use, indicated adequate concurrent validity. Overall, the results showed that this new scale presents satisfactory construct validity in adolescence.
In the development of the BFPTSQ, the language level of many items was adjusted in order to create a measure suitable for both adolescent and adult populations. There are only a few questionnaires that can be used in youngsters and adults (see McCrae & Costa Jr, Reference McCrae and Costa2010). The use of the same instrument in adolescence and adulthood is desirable as it solves the problem of comparability between versions of the questionnaires. This is especially relevant in longitudinal research of personality traits (van den Akker, Deković, Asscher, & Prinzie, Reference van den Akker, Deković, Asscher and Prinze2014). Thus the resulting BFPTSQ presents two clear advantages in comparison to other non-commercial (free to use) short measures of the FFM. First, more adequate conceptual breadth (content validity) of the primary traits represented in its scales. Second, it can be used in both adolescents and adults.
We mentioned above that personality traits influence life outcomes (Roberts et al., Reference Roberts, Kuncel, Shiner, Caspi and Goldberg2007). Among the most studied consequential outcomes associated with the FFM are subjective well-being and alcohol consumption. In relation to subjective well-being, positive and negative affects are considered two main components of happiness and they are associated to extraversion and neuroticism (low emotional stability) respectively (Pavot & Diener, Reference Pavot, Diener, Chamorro-Premuzic, von Stumm and Furnham2011). Thus, previous studies have found that extraversion and emotional stability are the best predictors of happiness (Gale, Booth, Mõttus, Kuh, & Deary, Reference Gale, Booth, Mõttus, Kuh and Deary2013; Steel, Schmidt, & Shultz, Reference Steel, Schmidt and Shultz2008). As for alcohol use, low conscientiousness and low agreeableness have been consistently related to alcohol consumption, alcohol-related problems, and alcohol disorders (Kotov, Gamez, Schmidt, & Watson, Reference Kotov, Gamez, Schmidt and Watson2010; Malouff, Thorsteinsson, Rooke, & Schutte, Reference Malouff, Thorsteinsson, Rooke and Schutte2007). These dimensions may be associated with alcohol outcomes through a deviance proneness pathway (i.e., alcohol use is considered a part of a more general pattern of antisocial behavior) (Mezquita, Ibáñez, Moya, Villa, & Ortet, Reference Mezquita, Ibáñez, Moya, Villa and Ortet2014). Finally, openness to experience appears to play a minor role in both subjective well-being (Pavot & Diener, Reference Pavot, Diener, Chamorro-Premuzic, von Stumm and Furnham2011) and alcohol use (Kotov et al., Reference Kotov, Gamez, Schmidt and Watson2010).
In the present study, we examined the construct validity of the Spanish version of the BFPTSQ in adults. This research presents the evaluation of factor, convergent, and criterion validities; as well as internal consistency and test-retests reliabilities of the questionnaire in adults. We hypothesized that the factor analysis would show that all items loaded on their target broad trait. Based on recent research, we also expected several significant cross-loadings (see Marsh et al., Reference Marsh, Lüdtke, Muthén, Asparouhov, Morin, Trautwein and Nagengast2010). We also expected to obtain adequate Cronbach’s alpha and one-month test-retest coefficients. In relation to convergent validity, the FFM broad and narrow factors (using the NEO-PI-R) would correlate to the BFPTSQ intended dimension. Regarding consequential outcomes, it was hypothesized that happiness would be positively related to extraversion and emotional stability, alcohol consumption would be positively related to extraversion and negatively associated with agreeableness and conscientiousness, and finally openness would not be related to any of the assessed outcomes.
Method
Back translation
We translated the BFPTSQ items into Spanish. Afterwards, an English language teacher unfamiliar with the inventory carried out a back translation. The analysis of the back translation indicated some minor changes in three items (29, 34 and 38) to adjust them to their meaning in English.
Participants and procedure
Two hundred and sixty-two participants (M age = 25.72, SD = 7.67 years) answered the BFPTSQ, the SHS (subjective well-being) (Lyubomirsky & Lepper, Reference Lyubomirsky and Lepper1999), and the AIS-UJI (alcohol consumption) (Ibáñez et al., Reference Ibáñez, Camacho, Mezquita, Villa, Moya-Higueras and Ortet2015). There were more female (67.1%) than male participants and most of them (70.8%) were students. A subsample of 71 participants (M age = 26.06, SD = 7.84 years) filled out the NEO-PI-R. Also most of them were females (70.1%) and students (67.2%). Finally, another subsample of 42 participants (M age = 26.98, SD = 8.90 years) answered the BFPTSQ one month after the first assessment. Again, most of them were females (61.0%) and students (68.3%). The age range in all cases was from 18 to 64 years.
The participants belonged to different parts of Spain, although most of them lived in the Valencian Community (east Spain), and answered the questionnaires through the Internet. They filled the scales as a response to an announcement displayed at virtual classrooms from the Jaume I University and in Facebook.
Measures
Big Five Personality Trait Short Questionnaire (BFPTSQ)
The BFPTSQ (Morizot, Reference Morizot2014) has 50 items answered on a 5-point Likert-type response format (totally disagree = 0, disagree a little = 1, neutral opinion = 2, agree a little = 3, totally agree = 4). The introduction sentence, “I see myself as someone who,” is presented at the top of each page. It assesses the five personality factors or domains: openness, extraversion, agreeableness, conscientiousness and emotional stability. The Spanish version of the BFPTSQ is available from the first author.
Revised NEO Personality Inventory (NEO-PI-R)
The NEO-PI-R (Costa & McCrae, Reference Costa and McCrae1992) comprises 240 items that are answered on a 5-point Likert scale ranging from strongly disagree to strongly agree. It assesses the 30 specific traits or facets that define the five broad domains of the FFM. The manual summarizes the reliability and validity data of the Spanish version of the instrument (Costa & McCrae, Reference Costa and McCrae1999).
Subjective Happiness Scale (SHS)
The SHS (Lyubomirsky & Lepper, Reference Lyubomirsky and Lepper1999) is a 4-item self-report measure of subjective well-being. Each item has a 7-point Likert scale response format. The items were translated to Spanish for the present study and the Cronbach’s alpha coefficient for our sample was .69.
Alcohol Intake Scale-UJI (AIS-UJI)
The AIS-UJI (Ibáñez et al., Reference Ibáñez, Camacho, Mezquita, Villa, Moya-Higueras and Ortet2015) is a 4-item self-report scale in which participants indicate the quantity of glasses of beer, wine, liquors, and mix drinks they drank during the week and at the weekend. The informed drinks were transformed into Standard Drink Units (1 SDU = 10g of alcohol).
Data analyses
All analyses were conducted using the SPSS Version 23 and Mplus Version 5. Unless otherwise noted, all analyses using Mplus were conducted using the robust maximum likelihood estimator (MLR), which provides adjusted standard errors and statistical fit tests that are robust to nonnormality in the data. Confidence intervals (95%) were calculated and reported. Factor validity was assessed using two types of models; an independent clusters model confirmatory factor analysis (ICM-CFA), and an exploratory structural equation modeling (ESEM).
For ESEM, the target loading rotation was used. Moreover, following Marsh et al. (Reference Marsh, Lüdtke, Muthén, Asparouhov, Morin, Trautwein and Nagengast2010) and Morizot (Reference Morizot2014), all factor models were estimated with and without a priori correlated uniquenesses (CUs), which are used to reflect the fact that some items relate to the same primary trait (or subdomain), share similar content (but reversed scoring), or share the same word. A total of 28 a priori correlated uniquenesses (CUs) were posited: for openness, 1–21, 11–36, 16–21, 26–41r, 26–46, 1–16, 41r–46; for extraversion, 7r–32r, 2–22r, 12–42, 2–27, 17–27; for agreeableness, 18–23, 8–33, 23–33, 23–43, 18–43; for conscientiousness, 29–39, 19r– 24r, 19r–39, 29–44r, 9r–19r, 4–14; and for emotional stability, 10–35, 10–15r, 5r–25, 5r–45r, 30r–50r. A detailed description of the ICM-CFA and ESEM that we carried out is presented in Morizot (Reference Morizot2014).
The assessment of model fit was based on various indices (West, Taylor, & Wu, Reference West, Taylor, Wu and Hoyle2012). The chi-square test was estimated for all models. A nonsignificant chi-square suggests a good fitting model. However, because this test is known to be overly sensitive to increasing sample size, to minor departure from multivariate normality and to minor (substantively irrelevant) model misspecifications, additional fit indices were considered. Thus, values of .90 or above for the comparative fit index (CFI) and Tucker–Lewis index (TLI), of .08 or below for the root mean square error of approximation (RMSEA), and of .10 or below for the standardized root mean square residual (SRMR) suggest an acceptable fit of the model (Bentler, Reference Bentler1990; Marsh, Hau, & Wen, Reference Marsh, Hau and Wen2004). For the RMSEA 90% CI, values below .05 for the lower bound and below .08 for the upper bound suggest acceptable fit (MacCallum, Browne, & Sugawara, Reference MacCallum, Browne and Sugawara1996).
For the assessment of change in model fit tests, the Satorra-Bentler scaled chi-square test (Satorra, Reference Satorra, Heijmans, Pollock and Satorra2000) was computed. Cheung and Rensvold (Reference Cheung and Rensvold2002) suggested using change in CFI, where values below .01 indicate that the invariance hypothesis should not be rejected, values between .01 and .02 suggest the possibility of non-invariance, and values above .02 support the rejection of the invariance hypothesis. Chen (Reference Chen2007) suggested using changes in RMSEA, where values below .015 indicate that the invariance hypothesis should not be rejected.
Reliability of the scales was estimated using the Cronbach’s alpha coefficient. For convergent validity, the scales were correlated with their corresponding scales from the NEO-PI-R (Costa & McCrae, Reference Costa and McCrae1999), while for criterion validity, the scales were correlated with two consequential outcome scales: one subjective well-being scale and one of alcohol consumption.
Results
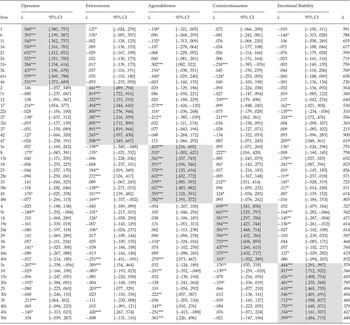
The goodness-of-fit statistics from the different factor analytic models are presented in Table 1. All indices suggest that ICM-CFA clearly does not fit the data (M1). Adding a priori CUs (M1b) significantly improved the fit, but it was still a poor-fitting model. Fitting an ESEM model (M2) largely improved fit over the ICM-CFA model as suggested by the large Δχ2, ΔCFI, and ΔRMSEA. The fit of this model, however, remains unacceptable because the CFI and TLI values were below the acceptable criterion. A model adding a priori CUs (M2b) again significantly improved the fit to the data. In contrast to the preceding models, this ESEM with CUs shows satisfactory fit indices, with CFI and TLI around .90, as well as RMSEA and SRMR below .06.
Table 1. Goodness-of-Fit Statistics from the Confirmatory Factor Analytic and Exploratory Structural Equation Models

Note: ICM-CFA = independent clusters model confirmatory factor analysis; ESEM = exploratory structural equation modeling; χ2 = chi square; df = degrees of freedom; CFI = comparative fit index; TLI = Tucker–Lewis index; RMSEA = root mean square error of approximation; 90% CI = 90% confidence interval of the RMSEA; SRMR = standardized root mean square residual; Ref = reference model; ΔSχ2 = Satorra-Bentler scaled chi-square difference test; Δdf = change in degrees of freedom; ΔCFI = change in CFI; ΔRMSEA = change in RMSEA.
* p < .001.
Table 2 presents the standardized factor loadings from the ESEM model with CUs (M2b). Most target item loadings were substantial and were clearly statistically related to their expected factor. Only 3 (items 18, 42, and 49r) out of 50 target loadings had a value below .30, though they were statistically related to their expected factor. Examination of the confidence intervals suggests that all, but 2 (items 8 and 49r), target loadings were relevant as they did not include a value of 0. There were 7 (items 5r, 12, 27, 31r, 43, 45r, and 50r) sizable cross-loadings (i.e., above .30 and statistically significant). Most of these cross-loadings were also found in the original questionnaire and were conceptually expected. For instance, extraversion’s item 27 “shows self-confidence, is able to assert himself/herself”, which would be represented by the facet assertiveness in the NEO-PI-R, also loaded on emotional stability; or emotional stability’s item 50 “has a tendency to be easily irritated”, which would be represented by the facet angry hostility in the NEO-PI-R, also loaded on low agreeableness.
Table 2. Standardized factor loadings from the Exploratory Structural Equation Model of the BFPTSQ Items

Note: Shaded entries are the target loading items. Item numbers with an r are reverse scored. λ = factor loadings; δ = uniquenesses; 95% CI = 95% confidence interval.
* p < .05. **p < .01. ***p < .001.
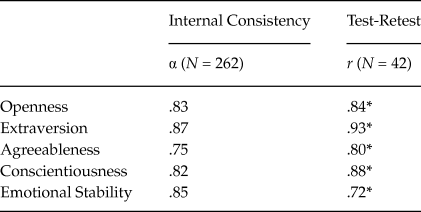
In Table 3 are the latent factor correlations and their 95% confidence intervals from the ICM-CFA and ESEM models. As expected, the factor correlations from ESEM are much smaller than those from ICM-CFA. While the absolute factor correlations for ICM-CFA range from .024 (between openness and agreeableness) to .400 (between agreeableness and emotional stability), for ESEM they range from .015 (between extraversion and agreeableness) to .239 (between extraversion and conscientiousness). The intercorrelations among the five scales of the Spanish version of the BFPTSQ in adults were substantially lower than in the original questionnaire in adolescents. In the original version, the largest correlations were .61 and .35 between agreeableness and conscientiousness in ICM-CFA and ESEM respectively. Table 4 presents the coefficient alphas, which ranged from .75 to .85. These indices were similar to the ones obtained in the original scale in adolescents. Table 4 also shows the one-month test-retest correlations that ranged from .72 to .93, which were not calculated for the original validation study. All indices suggest that the BFPTSQ scales have adequate reliability.
Table 3. Point and Interval Estimate of Factor Correlations of the BFPTSQ

Note: Latent factor correlations from the final exploratory structural equation model (ESEM, M2B) are presented below the diagonal, while latent correlations from the independent clusters model confirmatory factor analysis (ICM-CFA, M1B) are presented above the diagonal. φ = factor covariance/correlation; 95% CI = 95% confidence interval.
* p < .05. **p < .01. ***p < .001.
Table 4. Internal Consistency and Test-Retest Reliabilities of the BFPTSQ
* p < .001.
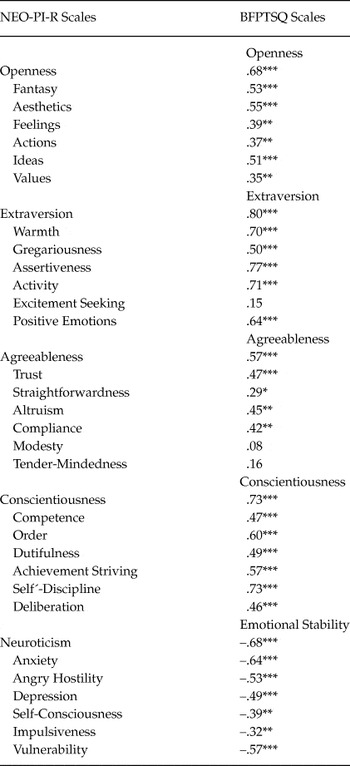
The overall pattern of correlations between the BFPTSQ and NEO-PI-R scales suggested adequate convergent validity (see Table 5). These were higher between broad-trait scales (from .57 to .80) than between the BFPTSQ scales and the corresponding NEO-PI-R primary-trait scales. However, BFPTSQ extraversion did not correlate with excitement seeking, and BFPTSQ agreeableness presented nonsignificant associations with both modesty -as in the original scale- and tender-mindedness. The pattern of correlations between the BFPTSQ and outcome scales (see Table 6) generally suggested adequate criterion validity. As expected, openness was not related to any of the outcomes assessed in this study. We found that extraversion and emotional stability were most strongly related to happiness, as predicted. Moreover, extraversion and conscientiousness, but agreeableness, were associated with alcohol consumption. In the original validation with adolescents, extraversion, agreeableness and conscientiousness were correlated to substance use, which included alcohol use. Table 7 presents the comparisons across genders, indicating that females obtained higher scores in agreeableness and conscientiousness. There were no significant gender differences in openness, extraversion and, unexpectedly, emotional stability.
Table 5. Correlations between BFPTSQ and NEO–PI–R scales (N = 71)
* p > .05. **p > .01. ***p > .001.
Table 6. Correlations between BFPTSQ and Outcome Scales (N = 262)

* p > .01. **p > .001
Table 7. Means and Standard Deviations for the BFPTSQ, p Values, and Cohen’s d Associated with Gender

Note: Cohen’s d values of .20, .50, and .80 correspond to small, medium, and large effect sizes, respectively (Cohen, Reference Cohen1992).
Discussion
The general objective of this study was to adapt the BFPTSQ in Spanish and evaluate its construct validity in adults. Construct validity is a unifying form of validity that requires taking into account different complementary sources of information (Messick, Reference Messick1995; Simms & Watson, Reference Simms, Watson, Robins, Fraley and Krueger2007). Accordingly, we evaluated factor validity, convergent validity, criterion validity, and reliability of the questionnaire. The results confirmed most of our hypotheses, supporting the construct validity of the Spanish BFPTSQ.
Overall, in line with recent research on Big Five measures, an ESEM model fit the data much better than an ICM-CFA (see Marsh et al., Reference Marsh, Lüdtke, Muthén, Asparouhov, Morin, Trautwein and Nagengast2010; Morizot, Reference Morizot2014). However, the fit of the final ESEM model with CUs remains marginally acceptable. This is not unexpected, however. It is known that there tends to be a decrease in fit as the number of indicators increases in a factor model, even for properly specified models (Marsh, Hau, Balla, & Grayson, Reference Marsh, Hau, Balla and Grayson1998). Other researchers observed similar marginal fit in Big Five measures with 50 items or more (see Marsh et al., Reference Marsh, Lüdtke, Muthén, Asparouhov, Morin, Trautwein and Nagengast2010; Morizot, Reference Morizot2014).
There are two major advantages of the BFPTSQ over other short personality measures: widen conceptual breadth, and its use in both adolescents and adults. The measure incorporates items tapping more primary traits, not just a few of them. This widen content coverage may tend, however, to provide lower factor loadings in short scales. Still, as in the original validation with adolescents (Morizot, Reference Morizot2014), our results indicated that the five-factor structure was well recovered in a sample of Spanish adults. Interestingly, the target item loadings tend to be higher in this Spanish adult sample than in the original validation of the BFPTSQ. In our results, only three items had a value below .30 on its target factor. Preacher and MacCallum (Reference Preacher and MacCallum2003) recommend using statistical significance and confidence intervals, such as the ones obtained with ESEM, not just the common recommendation that factor loadings are meaningful when they exceed .30 or .40. The results show that forty-eight out of fifty target loadings were relevant according to the confidence intervals. Moreover, most cross-loadings were expected according to the FFM as well as based on recent empirical research (Marsh et al., Reference Marsh, Lüdtke, Muthén, Asparouhov, Morin, Trautwein and Nagengast2010). For instance, item 26 (assertiveness) loaded on its intended factor, extraversion, but also loaded on emotional stability, as found in the NEO-PI-R (McCrae & Costa Jr, Reference McCrae and Costa2010).
With regard to reliability, we replicated in adults the adequate Cronbach’s alpha coefficients of the original study with adolescents, but we also add a new finding, namely acceptable test-retest reliability indices. Concerning convergent validity, overall, the correlations with the NEO-PI-R suggest adequate validity of the BFQTSQ scales in adults. All the correlations between the broad-trait scales were high, ranging from .57 for agreeableness to .80 for extraversion. Furthermore, the correlations between the BFPTSQ scales and their target NEO-PI-R primary-trait scales were generally moderate to high, and twenty-seven out of thirty primary traits were significant. The facets that presented nonsignificant associations were excitement seeking, modesty and tender-mindedness.
As for criterion validity, overall the correlations with the two outcome measures suggested adequate concurrent validity of the BFPTSQ scales. First, we found the usual association of extraversion and emotional stability with subjective well-being (Gale et al., Reference Gale, Booth, Mõttus, Kuh and Deary2013; Steel et al., Reference Steel, Schmidt and Shultz2008). Second, extraversion and conscientiousness presented, as expected, positive and negative correlations respectively to alcohol use (Mezquita et al., Reference Mezquita, Ibáñez, Moya, Villa and Ortet2014). However, we did not find the hypothesized negative correlation between agreeableness and alcohol consumption. In the original work with adolescents, extraversion, agreeableness and conscientiousness scales of the BFPTSQ presented significant correlations with substance use, which included alcohol use (Morizot, Reference Morizot2014). Regarding the different etiological pathways involved in the development of alcohol use and misuse, Mezquita et al. (Reference Mezquita, Ibáñez, Moya, Villa and Ortet2014) found that a positive affect regulation pathway was associated with more recreational alcohol use in which extraversion play a prominent role. In the case of low agreeableness and low conscientiousness, they were associated with a deviance proneness pathway, which predicted both recreational and problematic alcohol use. In relation to the last hypothesis, as expected, we found that openness was not associated with any of the two outcome measures.
Finally, we found the usual mean gender differences in personality traits. Females were more agreeable and conscientious than males (Schmitt, Realo, Voracek, & Allik, Reference Schmitt, Realo, Voracek and Allik2008), replicating the results of Morizot (Reference Morizot2014) with the original questionnaire in adolescents. However, we did not find the expected significant mean lower levels of emotional stability in females (McCrae & Costa Jr, Reference McCrae and Costa2010). These mean differences, at least in part, are in accordance to the previous research literature and contribute to the validity of the BFPTSQ. Overall, our results add evidence supporting construct validity of the BFPTSQ in adults.
The present research work has several limitations. First, the BFPTSQ was developed for both adolescents and adults, so a cross-validation should be carried out with an adolescent Spanish sample. Second, the evaluation of criterion validity was conducted with only two outcomes. Thus additional predictive studies using new scales are needed, especially measuring constructs used in the original study (e.g., psychopathology, achievement). Despite these limitations, the results of this study suggest that the Spanish version of the BFPTSQ appears to be a useful alternative to existing non-commercial FFM short measures.