


Research on gratitude has increased substantially during the past decade, especially within the context of positive psychology research. Gratitude has been defined as “a generalized tendency to recognize and respond with grateful emotion to the roles of other people’s benevolence in the positive experiences and outcomes that one obtains” (Mccullough et al., Reference Mccullough, Emmons and Tsang2002). According to McCullough et al. (Reference Mccullough, Tsang and Emmons2004), gratitude has been described as the greatest virtue, providing the foundation for all other virtues. In McCullough’s theory, gratitude is regarded as a moral barometer (i.e., indicating the value of the relationship with the benefactor), a moral motive (i.e., prompting grateful people to show prosocial behavior) and a moral reinforcer (i.e., influencing the benefactor to provide gifts in the future) (Mccullough, Kilpatrick, Emmons, & Larson, Reference Mccullough, Kilpatrick, Emmons and Larson2001). These three functions of gratitude result in positive emotions by creating a positive interaction between the beneficiary and the benefactor (Magno & Orillosa, Reference Magno and Orillosa2012).
There is a growing body of empirical evidence linking gratitude and other health-related variables. For example, scholars have demonstrated a negative relation between gratitude and depressive symptoms (Lambert et al., Reference Lambert, Fincham and Stillman2012). Gratitude has also been positively related to personality traits, such as agreeableness, responsibility, and extraversion (Alarcón & Morales de Isasi, Reference Alarcón and Morales de Isasi2012; Mccullough et al., Reference Mccullough, Emmons and Tsang2002). In studies of adolescents, previous research has revealed that gratitude is associated with life satisfaction (Datu & Mateo, Reference Datu and Mateo2015), optimism, happiness, hope (Mccullough et al., Reference Mccullough, Emmons and Tsang2002), subjective well-being, and prosocial behavior (Tian et al., Reference Tian, Du and Huebner2015), as well as better mental health and school performance (Bono et al., Reference Bono, Froh, Furlong, Gilman and Huebner2009). Also, lower levels of gratitude relate to pessimism (Cohen, Reference Cohen2006), materialism (Lambert et al., Reference Lambert, Fincham, Stillman and Dean2009), and narcissistic personality (Mccullough et al., Reference Mccullough, Kilpatrick, Emmons and Larson2001). Thus, gratitude may help adolescents foster positive outcomes and protect against negative outcomes (Gilman et al., Reference Gilman, Huebner, Furlong, Furlong, Gilman and Huebner2014), Adolescents are in a unique developmental period of understanding benefactors’ intentionality and expressing gratitude to their benefactors in appropriate ways (Liang, Reference Liang2017). Therefore, a full understanding of the development of gratitude in adolescence would be valuable in facilitating optimal psychological growth in youth. Nevertheless, compared to that of adults, the research on gratitude in children and adolescents lags far behind.
Several measures have been developed to measure gratitude, including: The Gratitude Resentment and Appreciation scale (GRAT; Watkins et al., Reference Watkins, Woodward, Stone and Kolts2003); The Gratitude Adjective Checklist (GAC; Mccullough et al., Reference Mccullough, Emmons and Tsang2002); The Gratitude Questionnaire–20 items (GQ–20; Bernabé-Valero et al., Reference Bernabé-Valero, García-Alandete and Gallego-Pérez2014); and The Gratitude Scale (Alarcón & Morales de Isasi, Reference Alarcón and Morales de Isasi2012). However, the most widely used questionnaire that is appropriate for adolescents is the Gratitude Questionnaire (GQ–6). The GQ–6, which was developed by McCullough et al. (Reference Mccullough, Emmons and Tsang2002), is a one-factor self-report questionnaire with six items, two of which are reverse-keyed. Contrary to what has been found in the existing literature, Chen et al. (Reference Chen, Chen, Kee and Tsai2009) proposed that a 5-item version (omitting Item 6) is more suitable for adolescents than the 6-item version, because the scores from the 6-item scale yielded poor fit indices, with Item 6 showing a particularly low factor loading, which may reflect the fact that it was reported to be difficult to understand by adolescents. Similarly, Valdez et al. (Reference Valdez, Yang and Datu2017) and Langer et al. (Reference Langer, Ulloa, Aguilar-Parra, Araya-Véliz and Brito2016) examined the psychometric properties of the GQ–6 and GQ–5 in samples of Chilean and Filipino adolescents, and they found that the scores from the GQ–5 yielded a better fit than the GQ–6. To date, the GQ–5 has been translated into several languages and evidence for its validity has been provided in numerous countries, such as China (Chen et al., Reference Chen, Chen, Kee and Tsai2009; Zeng et al., Reference Zeng, Ling, Huebner, He and Lei2017), America (Froh et al., Reference Froh, Fan, Emmons, Bono, Huebner and Watkins2011), Chile (Langer et al., Reference Langer, Ulloa, Aguilar-Parra, Araya-Véliz and Brito2016), Turkey (Yüksel & Oguz Duran, Reference Yüksel and Oguz Duran2012), and the Philippines (Datu, Reference Datu2014; Valdez et al., Reference Valdez, Yang and Datu2017; Valdez & Chu, Reference Valdez and Chu2020).
Gratitude, as a virtue, has been valued in many cultures. Given that gratitude necessarily involves thinking and acting autonomously and displaying perspective taking, cross-cultural research is particularly important because the effects of cultural nuances on adolescents’ perceptions of gratitude may vary across cultures (Corona et al., Reference Corona, Senft, Campos, Chen, Shiota and Chentsova-Dutton2020; Liang, Reference Liang2017). Investigating differences in gratitude among adolescents from different cultures could provide a fuller understanding of the development, nature, and consequences of gratitude in adolescents.
Previous studies have provided evidence for cultural differences in adolescents’ expressions of gratitude. For example, Wang and colleagues (Reference Wang, Wang and Tudge2015) found that, as compared with adolescents in America, Chinese children were more likely to express connective gratitude, which is considered the most sophisticated type of gratitude as the benefactor’s feelings and wishes are taken into account by the beneficiary. Corona et al. (Reference Corona, Senft, Campos, Chen, Shiota and Chentsova-Dutton2020) also reported differences among gratitude reports of individuals from different groups of adolescents, with gratitude experience, expression, and disposition differing significantly among European American, Latino American and East Asian Americans, with European and Latino Americans reporting higher levels of gratitude than East Asian Americans. Finally, Layous et al. (Reference Layous, Lee, Choi and Lyubomirsky2013) found that expressing gratitude toward a benefactor (i.e., writing a letter to someone to whom the participant felt grateful) did not contribute equally to individual wellbeing across the North American and the South Korean samples.
Differences in gratitude levels may be influenced by differing cultural values as reflected in the distinctions between collectivistic–individualistic cultural orientations, which are notably different between East Asian and North American cultures. Individualistic cultures, such as America, emphasize the independence of self and competition with others for resources, including social resources, via asserting one’s superiority (Yokota, Reference Yokota2012). In contrast, collectivist cultures, such as Japan and China, emphasize interdependence, obtaining social resources via reciprocity in social interactions, and exchanging favors and affection according to implicit rules in relationships (Cheung et al., Reference Cheung, Cheung, Leung, Ward and Leong2003). Even within collectivistic cultures, some differences may be observed. Corona et al. (Reference Corona, Senft, Campos, Chen, Shiota and Chentsova-Dutton2020) noted that although Latinos and East Asians both emphasize cultural interdependence, they differ in the expression of positive emotions. Latinos value open expression of positive emotions, whereas East Asians value suppressing emotions, including positive emotions, to promote social harmony. Such differing values may yield differences in the nature and mean levels of gratitude among differing cultural groups.
Relative to the study of such possible cultural differences, researchers have argued persuasively that the cross-cultural equivalence of psychological measures of interest should be investigated before studying cross-cultural differences in the levels and correlates associated with the measures (van der Vijver & Tanzer, Reference Van de Vijver and Tanzer2004; Zeng et al., Reference Zeng, Ling, Huebner, He and Lei2017). Thus, our interest in studying gratitude in Chinese and American adolescents required consideration of the equivalence of scores on the GQ–5 prior to examining any differences in mean levels or correlates for the two groups. The reasons are several. Differences in gratitude may be due to actual cross-cultural differences. As noted above, one useful, major cultural difference may reflect the individualism-collectivism continuum (Sinha, Reference Sinha and Sinha2014; Triandis, Reference Triandis1989). In particular, having a different way of thinking about oneself—as more collectivistic cultures like China do compared with more individualistic cultures like America (Markus & Kitayama, Reference Markus and Kitayama1991)—may impact how one thinks about and expresses gratitude.
Additionally, group differences could be due to differences in measurement. As noted above, measurement invariance is a prerequisite to comparisons of the mean levels or correlates of a measure for a measure of a psychological construct. Measurement invariance refers to “whether or not, under different conditions of observing and studying phenomena, measurement operations yield measures of the same attribute” (Horn & Mcardle, Reference Horn and Mcardle1992). Only when measurement invariance has been demonstrated can the results of a comparative analysis be considered valid. If a measure is interpreted differently across cultures and is applied without sufficient consideration of cultural influences, errors are likely to occur, which may result in unreliable or invalid measurements. Thus, the structure of the original theoretical model should represent the same concepts and meanings across the different cultural contexts in order to further investigate gratitude levels and correlates.
The primary objective of the study was thus to assess the measurement invariance of the GQ–5 in Chinese (i.e., a relatively collectivistic population) and American (i.e., a relatively individualistic population) adolescents. Based on the theoretical model, we expected to demonstrate invariance of the measure across the two groups. If measurement invariance was demonstrated, a secondary objective of the study was to investigate possible differences in the mean levels of gratitude in the two groups. Given previous research, we expected that Chinese adolescents would report a lower mean level of gratitude compared to the American adolescents.
In order to test for measurement equivalence, we used Multi-group Confirmatory Factor Analysis (MGCFA), a widely used approach, (Wu et al., Reference Wu, Lu, Tan, Yao, Steca, Abela and Hankin2012; Zeng et al., Reference Zeng, Ling, Huebner, He and Lei2017). This approach has not been used to date for comparisons of GQ–5 scores across Chinese and American adolescents.
Method
Participants
Chinese sample. The Chinese sample consisted of 1,991 Chinese adolescents (934 males, 1,057 females) from four middle schools in China. The age of the participants ranged from 11 to 16 years (M = 12.91, SD = 1.09). Of the 1991 adolescents sampled, 29% were from Grade 6, 37.80% were from Grade 7, and 33.20% were from Grade 8. Most (95.80%) students were Han, the predominant ethnic group in China, and the remainder was from various ethnic minority groups.
American sample. The American sample consisted of 1,685 American adolescents (864 males, 821 females) from four middle schools in a southeastern state in the USA. The age of the participants ranged from 11 to 15 years (M = 12.45, SD = 0.96). Of the 1,685 adolescents sampled, 27.96% were from Grade 6, 34.40% were from Grade 7, and 37.68% were from Grade 8. Most students were Caucasian (56.10%) followed by African American (22.50%) and Hispanic adolescents (8.60%).
Measures
Procedure
All procedures performed in our study involving human participants were in accordance with the ethical standards of the Department of Psychology, Hunan Normal University Institutional Review Board and with the 1964 Helsinki declaration as well as its later amendments or comparable ethical standards.
In China, prior to participation, participants were informed about the purpose of the research, and consent forms were sent to their parents. Adolescents participated only if they provided written parental consent and student assent. The GQ–5 was subsequently administered in the classroom to groups of students by trained research assistants during the school day. The participants took about 10 minutes to complete the measure and retained the right to participate or withdraw at any time during the research. To ensure the rights of participants’ confidentiality and anonymity in this study, participants were assigned and identified by a unique code known only to the investigators.
For the American sample, we used an archival dataset provided by four middle schools in one southeastern American state, which was collected as part of an annual school-wide survey of school climate and student well-being. Demographic information was collected through self-report items on the survey. Data collection was performed in a single session. School personnel administered the surveys during the American students’ regular class time. The data were de-identified before being received by the researchers.
Gratitude Questionnaire–5. The GQ–5 is a 5-item self-report scale with a one-factor structure. Each item was rated on a 7-point Likert-type scale (1 = strongly disagree and 7 = strongly agree), and the third item was negatively keyed (e.g., ‘When I look at the world, I don’t see much to be grateful for’). Possible scores ranged from 5 to 35, with higher scores indicating a higher level of gratitude. This scale was adapted from the GQ–6, which was developed by McCullough et al. (Reference Mccullough, Emmons and Tsang2002). The survey instrument was designed in both English and Chinese versions so that students in China took the Chinese version and those in America took the English one. Specifically, the translation of the GQ was originally conducted by a postgraduate student majoring in psychology who had mastered both Chinese and English. After the GQ–5 was translated into Chinese, a second translator back-translated the items into English. Both Chinese and English items were also evaluated by the authors to ensure equivalence in meaning and comparability. In previous studies, the Cronbach’s alpha of the GQ–5 among adolescents ranged from .73 to .80 (Chen et al., Reference Chen, Chen, Kee and Tsai2009; Langer et al., Reference Langer, Ulloa, Aguilar-Parra, Araya-Véliz and Brito2016; Yüksel & Oguz Duran, Reference Yüksel and Oguz Duran2012). In this study, the alpha coefficient of the GQ–5 for the Chinese sample and American sample was 0.74 and 0.77, respectively. The Omega coefficient for the GQ–5 was 0.72 for the Chinese sample and 0.69 for the American sample, respectively. The Cronbach’s alpha values and Omega coefficients indicated that Chinese and American early adolescents’ scores on the scale demonstrated acceptable internal consistency reliability for research purposes.
Data Analysis
Confirmatory factor analysis (CFA) and multi-group confirmatory factor analysis (MGCFA) were conducted in Mplus 7.4. The SPSS Statistics 17.0 was used to calculate the descriptive statistics and internal consistency of the GQ–5. The robust maximum likelihood (MLR) estimator was chosen. We made this decision carefully, because the results of Kolmogorov-Smirnov test showed significant skewness and kurtosis for each item (p < .01), which indicated nonnormality of our data. According to Satorra and Bentler (Reference Satorra and Bentler2001), the MLR estimator with a mean adjusted chi-square (Satorra–Bentler χ2) statistic and robust standard errors yields unbiased goodness-of-fit indices that are robust to non-normal data.
Our data analyses were carried out in three steps. As a first step, two separate CFAs were performed to examine the factorial structure of the GQ–5 for each country. Because of the sensitivity of the χ2 statistic to sample size (i.e., statistically significant χ2 s are often found in large samples, Karl, Reference Karl1996), we utilized multiple indices, such as the standardized root mean square residual (SRMR), non-normal fit index (NNFI/TLI), comparative fit index (CFI), and root mean square error of approximation (RMSEA) to evaluate the model fit. NNFI/TLI and CFI values above 0.95 and SRMR and RMSEA values of less than .08 were considered good (Hu & Bentler, Reference Hu and Bentler1999).
In the second step, MGCFA procedures were used subsequently to examine whether the CHS demonstrated measurement invariance across the Chinese and American students. Measurement invariance tests were done in a hierarchical fashion by conducting an initial analysis (Model 1) in which the only invariance constraint was that the same parameters existed for both groups (configural invariance). When configural invariance was confirmed, subsequent analyses added the additional invariance constraint of equivalent factor loadings to test for metric invariance (Model 2). When metric invariance was met, we imposed constraints on both factor loadings and item intercepts to test for scalar invariance (Model 3). In order to evaluate invariance between different consecutive models, the ΔCFI index and the Bayesian information criterion (BIC) value were used to evaluate invariance among difference consecutive models. According to Cheung and Rensvold (Reference Cheung and Rensvold2002), a ΔCFI ≤ 0.01 supplemented by a smaller BIC value was considered evidence of equivalence (Cheung & Rensvold, Reference Cheung and Rensvold2002). As for BIC, a 0 to 2 difference between two models indicated weak evidence; a 2 to 6 difference indicated positive evidence; a 6 to 10 difference represented strong evidence and if the BIC values differed by more than 10, the difference indicated very strong evidence (Raftery, Reference Raftery1995).
In efforts to identify intercepts of those items found to be invariant and those found to be non-invariant across countries, modification indices (MI) were used to determine which parameters should be freed within the context of partial scalar invariance (Gregorich, Reference Gregorich2006).
Because there were some items that were non-invariant in Model 3, we carried out a subsequent level of analysis to examine the impact of non-invariant items on latent mean differences between the Chinese and American adolescents. In the structural means model, the Chinese group was selected as the reference group and the latent mean of the Chinese group was constrained to 0, while the American group was estimated freely. The critical ratio (CR) was chosen as the index to evaluate whether the latent means were different across groups (Tsaousis & Kazi, Reference Tsaousis and Kazi2013). If the CR > 1.96 or < –1.96, the estimate of equality was rejected. Moreover, positive CR values indicated a higher latent mean for the comparison group relative to the reference group, while negative values indicated a lower latent mean for the comparison group.
Results
Descriptive Statistics, and Item-total Correlations
Table 1 presents descriptive statistics and item-total correlations of the GQ–5 for the Chinese sample and American sample. All statistics presented in Table 1 are standardized.
Table 1. Descriptive Statistics, and Standardized Factor Loadings the GQ–5 in the Two Samples

Note. SD = standard deviation; ITC = item total correlation.
Confirmatory Factor Analyses
The fit indexes of the GQ–5 are summarized in Table 2. As can be observed, all the indexes in the two samples met the criteria. The CFI and TLI values were all above 0.90, and both the RMSEA and the SRMR were less than .08, which suggested that the one-factor model provided a good fit to the Chinese and American data sets. As a result, this model served as the baseline model for the subsequent tests of measurement invariance.
Table 2. Fit Indices for the GQ–5 in the Two Samples
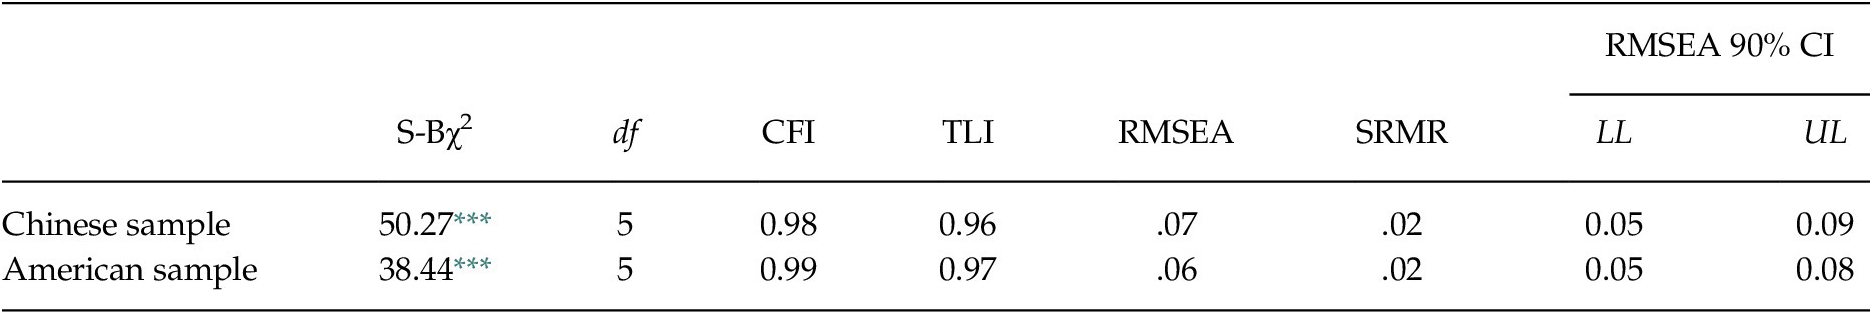
Note. S-Bχ2 = Satorra-Bentler scaled χ2; df = degrees of freedom; CFI = comparative fit index, TLI = non-normal fit index; SRMR = standardized root mean square residual; RMSEA = root mean square error of approximation; 90% CI = limits of the 90% confidence interval for RMSEA.
*** p < .001.
Measurement Invariance across Cultural Groups
We analyzed the invariance of the GQ–5 by computing a multi-group confirmatory analysis through structural equation modeling. Table 3 presents the summary fit indices of five nested models for the multi-group confirmatory factor analysis.
Table 3. Fit Indices (with Corrected Robust Estimation) for Invariance Tests of the GQ–5
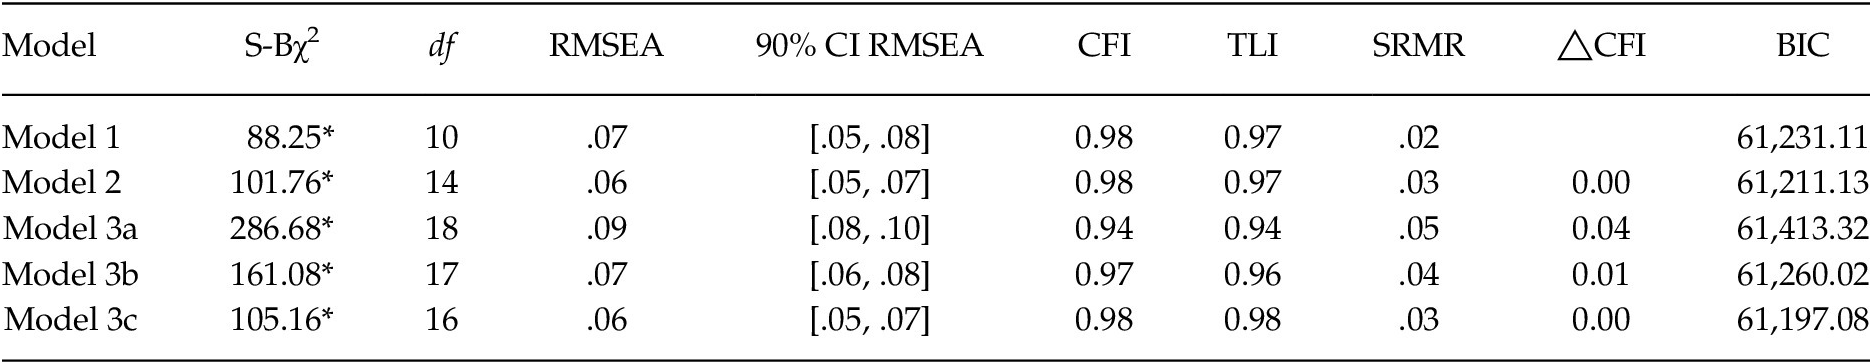
Note. Model 1 = Configural invariance model; Model 2 = Metric model; Model 3a = Full scalar invariance model; Model 3b = Scalar invariance model without item 5; Model 3c = Scalar invariance model without item 3 and 5; BIC = Bayesian information criterion.
The configural invariance model, as the baseline model, testing the factorial structure of the measure across two countries with no constraints imposed, displayed adequate fit with the data and supported configural invariance across different cultural groups. With regard to metric invariance, testing the invariance of factor loadings across countries, our results revealed that the model also fit the data very well across cultures. When we compared Model 2 to Model 1, the ΔCFI and the decrease of the BIC supported metric invariance across groups.
Consequently, we proceeded to test for scalar invariance, testing the invariance of the intercepts in the equations for predicting items in addition to factor loadings, and our finding demonstrated that although the scalar invariance model yielded adequate values for the fit indices, full scalar invariance was not observed, given an unsatisfactory ΔCFI and an increased BIC. When we allowed the intercepts of item 5 to vary between Chinese and American samples according to the modification indices (MI = 117.89), we found a ΔCFI = 0.01 and a relatively increased BIC value. Then, we also freed the intercepts of Item 3 on the basis of the highest modification indices of 53.16, and partial invariance was obtained with a ΔCFI = 0.00.
Latent Mean Difference Based on Observed Full Scalar Invariance or Partial Scalar Invariance
Factor means can be compared as long as at least two intercepts are found to be invariant across groups (Steenkamp & Baumgartner, Reference Steenkamp and Baumgartner1998), and such a comparison also has been suggested to provide some insight into the comparability of the mean-level differences comparing full and partial invariance (Byrne & van de Vijver, Reference Byrne and van de Vijver2010). Consequently, we conducted the latent means analyses across culture based on all five items and latent mean analyses across culture based on the two items that showed invariance. Using the five-item model, Chinese adolescents reported significantly lower gratitude scores than American adolescents (SE = 0.04, CR = 17.15, p < .001). With regard to the two-item model, Chinese adolescents also reported a lower level of gratitude than American adolescents (SE = 0.05, CR = 5.24, p < .001).
Discussion
Increasing attention has been paid to the importance of measurement invariance in cross-culture comparisons. Consistent with such attention, this research is the first to test the measurement invariance of the GQ–5 and compare latent means between samples of Chinese and American adolescents. Before testing the measurement invariance of the GQ–5, factor loadings, descriptive statistics, item-total correlations, and CFAs were calculated. The results of tests of factor loadings and item-total correlations provided evidence that all five items could be utilized in this study. Furthermore, the results of the CFAs indicated that the expected one-factor structure fit the data well for both the Chinese and American adolescent samples.
Investigating differences in gratitude among different cultures should provide a fuller understanding of the development, nature, and consequences of gratitude. Our results supported full configural invariance, full metric invariance, and partial scalar invariance of the GQ–5 across the samples from the two countries. Consistent with what had been expected, results of the partial scalar invariance analyses indicated that observed mean differences on the GQ–5 items could not be fully explained by the mean differences in the latent factor. It also suggested being cautious when comparing cross-cultural differences of gratitude between Chinese and American adolescents with the GQ–5, although the final results of the latent mean difference analysis based on full scalar invariance and based on partial scalar invariance were similar. The findings revealed that the Chinese adolescents in our study reported a lower level of gratitude than the American adolescents. Our finding was consistent with Corona et al. (Reference Corona, Senft, Campos, Chen, Shiota and Chentsova-Dutton2020)’s findings, showing that the GQ–5 reports of East Asian adults were lower than Latino and European American adults.
The reasons for the significant group difference remain unclear. One possibility is the influence of collectivism and individualism on children’s level of gratitude. For example, as noted above, persons from more collectivist cultures, like China, are more prone to experience and report other-focused emotions (e.g., sympathy), whereas persons from more individualistic nations are less prone to do so (Markus & Kitayama, Reference Markus and Kitayama1991). For another example, in order to maintain harmony, individuals from collectivistic nations also encourage the suppression of emotions, including positive emotions, more than individuals from individualistic nations (Ruby et al., Reference Ruby, Falk, Heine, Villa and Silberstein2012). Furthermore, Ruby and colleagues (Reference Ruby, Falk, Heine, Villa and Silberstein2012) also reported that individuals from individualistic backgrounds value high-activation positive emotions (e.g., excited, enthusiastic) more than individuals from collectivist backgrounds (Ruby et al., Reference Ruby, Falk, Heine, Villa and Silberstein2012). Therefore, Chinese individuals tend to be more modest than Americans, which may contribute to American adolescents scoring higher than Chinese adolescents in their level of gratitude.
Research has also revealed various culture influence differences in the expression of gratitude specifically. For example, Chinese children are more likely to express connective gratitude and less likely to express verbal and concrete gratitude than American children (Liang, Reference Liang2017). Layous et al. (Reference Layous, Lee, Choi and Lyubomirsky2013) also found that expressing gratitude did not promoting individual well-being equally well, with individuals from collectivistic nations benefitting significantly less from gratitude interventions than the participants from individualistic nations. This finding may be due to the differences in cultural traditions and philosophy, as collectivistic participants reported feelings of indebtedness and guilt along with grateful feelings.
Furthermore, different parental values may influence the level of adolescents’ gratitude. Young children start to gain an understanding of what gratitude means and when expressing gratitude is appropriate by watching their role models (e.g., parents) saying “thank you” and repaying their benefactors when they receive benefits (Liang, Reference Liang2017). Parents in western societies, such as America, attach high value to autonomy and separation, which fosters children’s adaptation to their particular societies. From Kağıtçıbaşı’s (Reference Kağıtçıbaşı2017) perspective, western parents encourage children to think and act autonomously and to consider others’ feelings, thus they may express gratitude by taking the benefactor’s wishes into consideration and repaying the benefactor autonomously (Kağıtçıbaşı, Reference Kağıtçıbaşı2017). In contrast, values, such as family interdependence, relatedness, and obedience, are highly endorsed in Chinese cultures (Yu, Reference Yu2011), which may lead Chinese adolescents to regard the expression of gratitude as a duty instead of an autonomous expression of appreciation. In addition, cultural norms for parent-child relationships may also influence the expression of gratitude. Given that Chinese adolescents appear to bear heavier burdens in a major life domain (i.e., school) than western adolescents (Zhao et al., Reference Zhao, Zhu and Ma2009). And high academic expectations from Chinese parents can therefore easily lead to high academic burdens and pressures on their adolescents (Sun et al., Reference Sun, Dunne and Hou2012). Thus, the relationships between Chinese parents and adolescents are more strained than American adolescents (Zhou, Reference Zhou2015), which may lead Chinese adolescents less gratitude expression.
Finally, the culture of gratitude is highly valued, structured and emotion laden in America, with its celebration of family, home and nation (Siskind, Reference Siskind1992) on Thanksgiving Day. According to Xiangdian (Reference Xiangdian2011), the schools in America provide conditions supporting higher levels of gratitude, such as religious freedom, allowing students to go to churches for religious worship at specific times. In addition, unlike circumstances in Chinese middle schools, American middle school students who are not able to participate in volunteer activities may not only graduate, but also enter high quality institutions to further their education (Xiangdian, Reference Xiangdian2011). Such individualistic cultures may prioritize gratitude for adolescents more in daily life than collectivistic cultures do for Chinese adolescents. Thus, American adolescents would be more likely to report high levels of gratitude than Chinese adolescents.
In reviewing the results of this study, several limitations should be taken into consideration. One limitation of the study was that although large samples were utilized and were quite similar in terms of age, education, and gender breakdown, neither sample was nationally representative, which may limit the generalizability of the findings. Another limitation of the study was that our study employed only one country each to represent individualistic and collectivistic nations, perhaps also limiting the generalizability of the findings. Finally, the current study lacked the inclusion of criterion measures that could have offered more nuanced insights into how gratitude relates to theoretically relevant constructs both in the United States and China. Such comparisons should be examined in the future.
Although our findings provided some preliminary support for the use of the one-factor model of the GQ–5 with American and Chinese adolescents, they provided only partial support for scalar invariance. Thus, our findings suggested that studies of the correlates of GQ–5 scores in American and Chinese adolescents may yield meaningful, but tentative results. Further research is needed to address the generalizability of these findings with GQ–5 scores. Given the possible cultural differences, the finding of partial invariance in our study may not be altogether surprising. Future research will be needed to determine possible subtle differences in the meaning of gratitude across the cultures (e.g., to what extent do Chinese adolescents differentiate gratitude from other related constructs compared to American adolescents). Studies of the comparability of various convergent and discriminant validity matrices for the scores should provide insight into the utilization of the GQ–5 and the nature and development of gratitude in Chinese and American adolescents.


