


Assessments of personality most commonly use tools developed from within a Big Five or Five-Factor Model approach and assess the broad domains of Neuroticism, Extraversion, Openness/Intellect, Agreeableness, and Conscientiousness. The five factors assessed by these tools do differ but are generally regarded to refer to the same broad psychological constructs (cf. Block, Reference Block1995; Digman, Reference Digman1990). Five-factor approaches remain the dominant framework for trait description, and the associated tools are the most widely applied across multiple fields of study. One of the most important elements of supporting evidence in favor of five-factor models is that they have shown a degree of cross-cultural stability (McCrae & Costa, Reference McCrae and Costa1997; McCrae et al., Reference McCrae and Terracciano2005), suggesting that they represent something of a universal taxonomy of broad personality factors.
As a result, five factor assessment tools have been translated into an array of languages, often using items from The International Personality Item Pool (IPIP; Goldberg, Reference Goldberg, Mervielde, Deary, De Fruyt and Ostendorf1999) as a starting point. The IPIP provides open access personality scales designed as proxies for many constructs including proprietary five factor inventories. Building on the benefits of free use, which has accelerated research beyond what would be possible using only proprietary tools, the IPIP has been used in a range of different cultures and translated to over 25 different languages (Goldberg, Reference Goldberg, Mervielde, Deary, De Fruyt and Ostendorf1999; Goldberg et al., Reference Goldberg, Johnson, Eber, Hogan, Ashton, Cloninger and Gough2006).
However, translated IPIP scales are typically subject to reduced psychometric scrutiny compared to their English-language counterparts (Mlačić & Goldberg, Reference Mlačić and Goldberg2007). Thus, it can be difficult for researchers to choose an appropriate translation for their study, especially when multiple versions exist. The lack of psychometric scrutiny is particularly problematic because translation is an inherently complex process. Translators must ensure that translated items accurately assess the same construct (i.e., respondents draw upon the same class of memories and experiences when responding to the items; see Hughes, Reference Hughes, Irwing, Booth and Hughes2018) whilst contending with unique cultural, environmental, and grammatical differences. However, if translated items do not operate in an equivalent manner (i.e., words or phrases have different conations, leading participants to draw upon different memories/processes; Boroditsky, Reference Boroditsky2001) then item responses are no longer equivalent and any scale score created from them changes in meaning. Often this lack of equivalence is reflected in the structure of the item responses (i.e., the factor structure will not replicate, Hughes, Reference Hughes, Irwing, Booth and Hughes2018).
Accordingly, we sought to investigate the psychometric properties of a Spanish translation of the 50 item IPIP Big-five inventory (henceforth referred to as the IPIP–50–S) within a Spanish speaking Peruvian sample. To our knowledge only two studies have previously investigated the psychometric properties of the scale: One within a sample of Argentinian teenagers (Cupani, Reference Cupani2009) and one within a mixed but predominantly student Argentinian sample (Gross et al., Reference Gross, Zalazar-Jaime, Piccolo and Cupani2012). Both studies noted some problems concerning the factor structure including low loading items (< .4), large numbers of non-trivial cross-loadings, and some items having their largest loading on their non-target factor (Cupani, Reference Cupani2009; Gross et al., Reference Gross, Zalazar-Jaime, Piccolo and Cupani2012). However, neither study was able to fully diagnose the causes of problems. The generalizability of these findings may also be somewhat limited because the samples consisted predominantly of Argentinian students. Therefore, further investigation of the performance of the translated measure in other Spanish speaking samples is of interest.
Accordingly, the major focus of the current study is on the identification of the appropriate factor structure for the translated items. Here we will consider both a priori confirmatory factor models, for a complete five-factor model and for each domain individually, as well exploratory models where there is evidence of misfit. Specifically, a number of studies show that CFA models of personality data produce inadequate model fit according to conventional criteria (Booth & Hughes, Reference Booth and Hughes2014; Hopwood & Donnellan, Reference Hopwood and Donnellan2010). This, it has been argued, is due to the complexity of personality items for which the responses may be influenced by multiple traits, and thus the independent cluster modelling assumption in typical CFA applications may be too restrictive (Marsh et al., Reference Marsh, Lüdtke, Muthén, Asparouhov, Morin, Trautwein and Nagengast2010). As such, we will apply exploratory structural equation modelling (ESEM) in the presence of misfit to identify the sources of misfit and the alternative optimal factor structure. Typically, ESEM approaches improve personality model fit but they remain some way from being adequately fitting models (Booth & Hughes, Reference Booth and Hughes2014).
Model misfit typically arises due to unmodeled sources of shared variation among indicators. Other possible sources of such variation in personality assessments stem from measurement errors commonly referred to as response biases and measurement artefacts (Podsakoff et al., Reference Podsakoff, MacKenzie, Lee and Podsakoff2003; Podsakoff et al., Reference Podsakoff, MacKenzie and Podsakoff2012). Thus, the third element of our analysis will be to explore the existence of such measurement artefacts. Previous research exploring scale translations has noted country-specific effects of extreme, acquiescent, and socially desirable responding (Diamantopoulos et al., Reference Diamantopoulos, Reynolds and Simintiras2006; Johnson et al., Reference Johnson, Kulesa, Cho and Shavitt2005). Indeed, previous research examining English-Spanish translations has suggested that the two most crucial item characteristics that influence cross-language equivalence are item complexity (length and language difficulty) and social desirability (Valentine, Reference Valentine2013). Thus, if CFA and ESEM models do fail to fit, we will explore the data for evidence of systematic measurement artefacts and seek to model them to improve the psychometric properties of the scale.
Method
Participants
Participants were 778 employees from fourteen stores of a supermarket retail company in Lima, Peru (379 male; 369 female; 30 missing values). Participants were selected at random from a list of all employees at each store who had worked at the company for over one month. Between 33 and 97 participants were collected from each store. All participants were Peruvian, aged from 18 to 60 years old (M = 24.67; SD = 6.38), and employed as customer service assistants. Participants’ job tenure ranged from 1 to 228 months (M = 16; SD = 22.37). All participants had completed secondary education (from 13 to 17 years) in Peruvian state schools.
Procedure
Permission to recruit participants was provided by the Human Resources department of the company who also assisted with data collection. To ensure consistency across test administrators, a member of the research team provided Human Resource assistants with instructions on the delivery of the survey. Questionnaires were completed in paper-pencil format, and later transferred to an electronic database by the research team. Testing was conducted in the workplace and in order to maintain the confidentiality/anonymity of participants, no identifying information was taken; instead all participants received a unique identifier meaning that data was fully anonymous.
Ethics
The study was given ethical approval by the Psychology Research Ethics Committee, Department of Psychology, University of Edinburgh. Surveys were completely anonymized at point of input into the electronic database. The original surveys were not shared with the hosting institution.
Measures
The survey consisted of two sections, a series of questions on co-worker satisfaction, and a personality inventory. For the purpose of the current study, only the personality items are analyzed.
The IPIP–50–S was used to measure the Big Five personality domains of Neuroticism, Extraversion, Intellect, Agreeableness, and Conscientiousness. Participants had to rate themselves on a 5-point Likert-type scale ranging from 1 (very inaccurate) to 5 (very accurate), according to how accurately each statement describes them. The IPIP–5–S comprised 50 items, 10 per personality domain. Examples items are “Am interested in people” (agreeableness), “Am the life of the party” (extraversion), “Pay attention to details” (conscientiousness), “Am relaxed most of the time” (neuroticism) and “Have a vivid imagination” (intellect). All items, in English, and their mean and standard deviation are reported in Table 1. The specific translation used is available onlineFootnote 1 and also in Supplementary Material.
Table 1. Item Descriptive Statistics for the IPIP–S
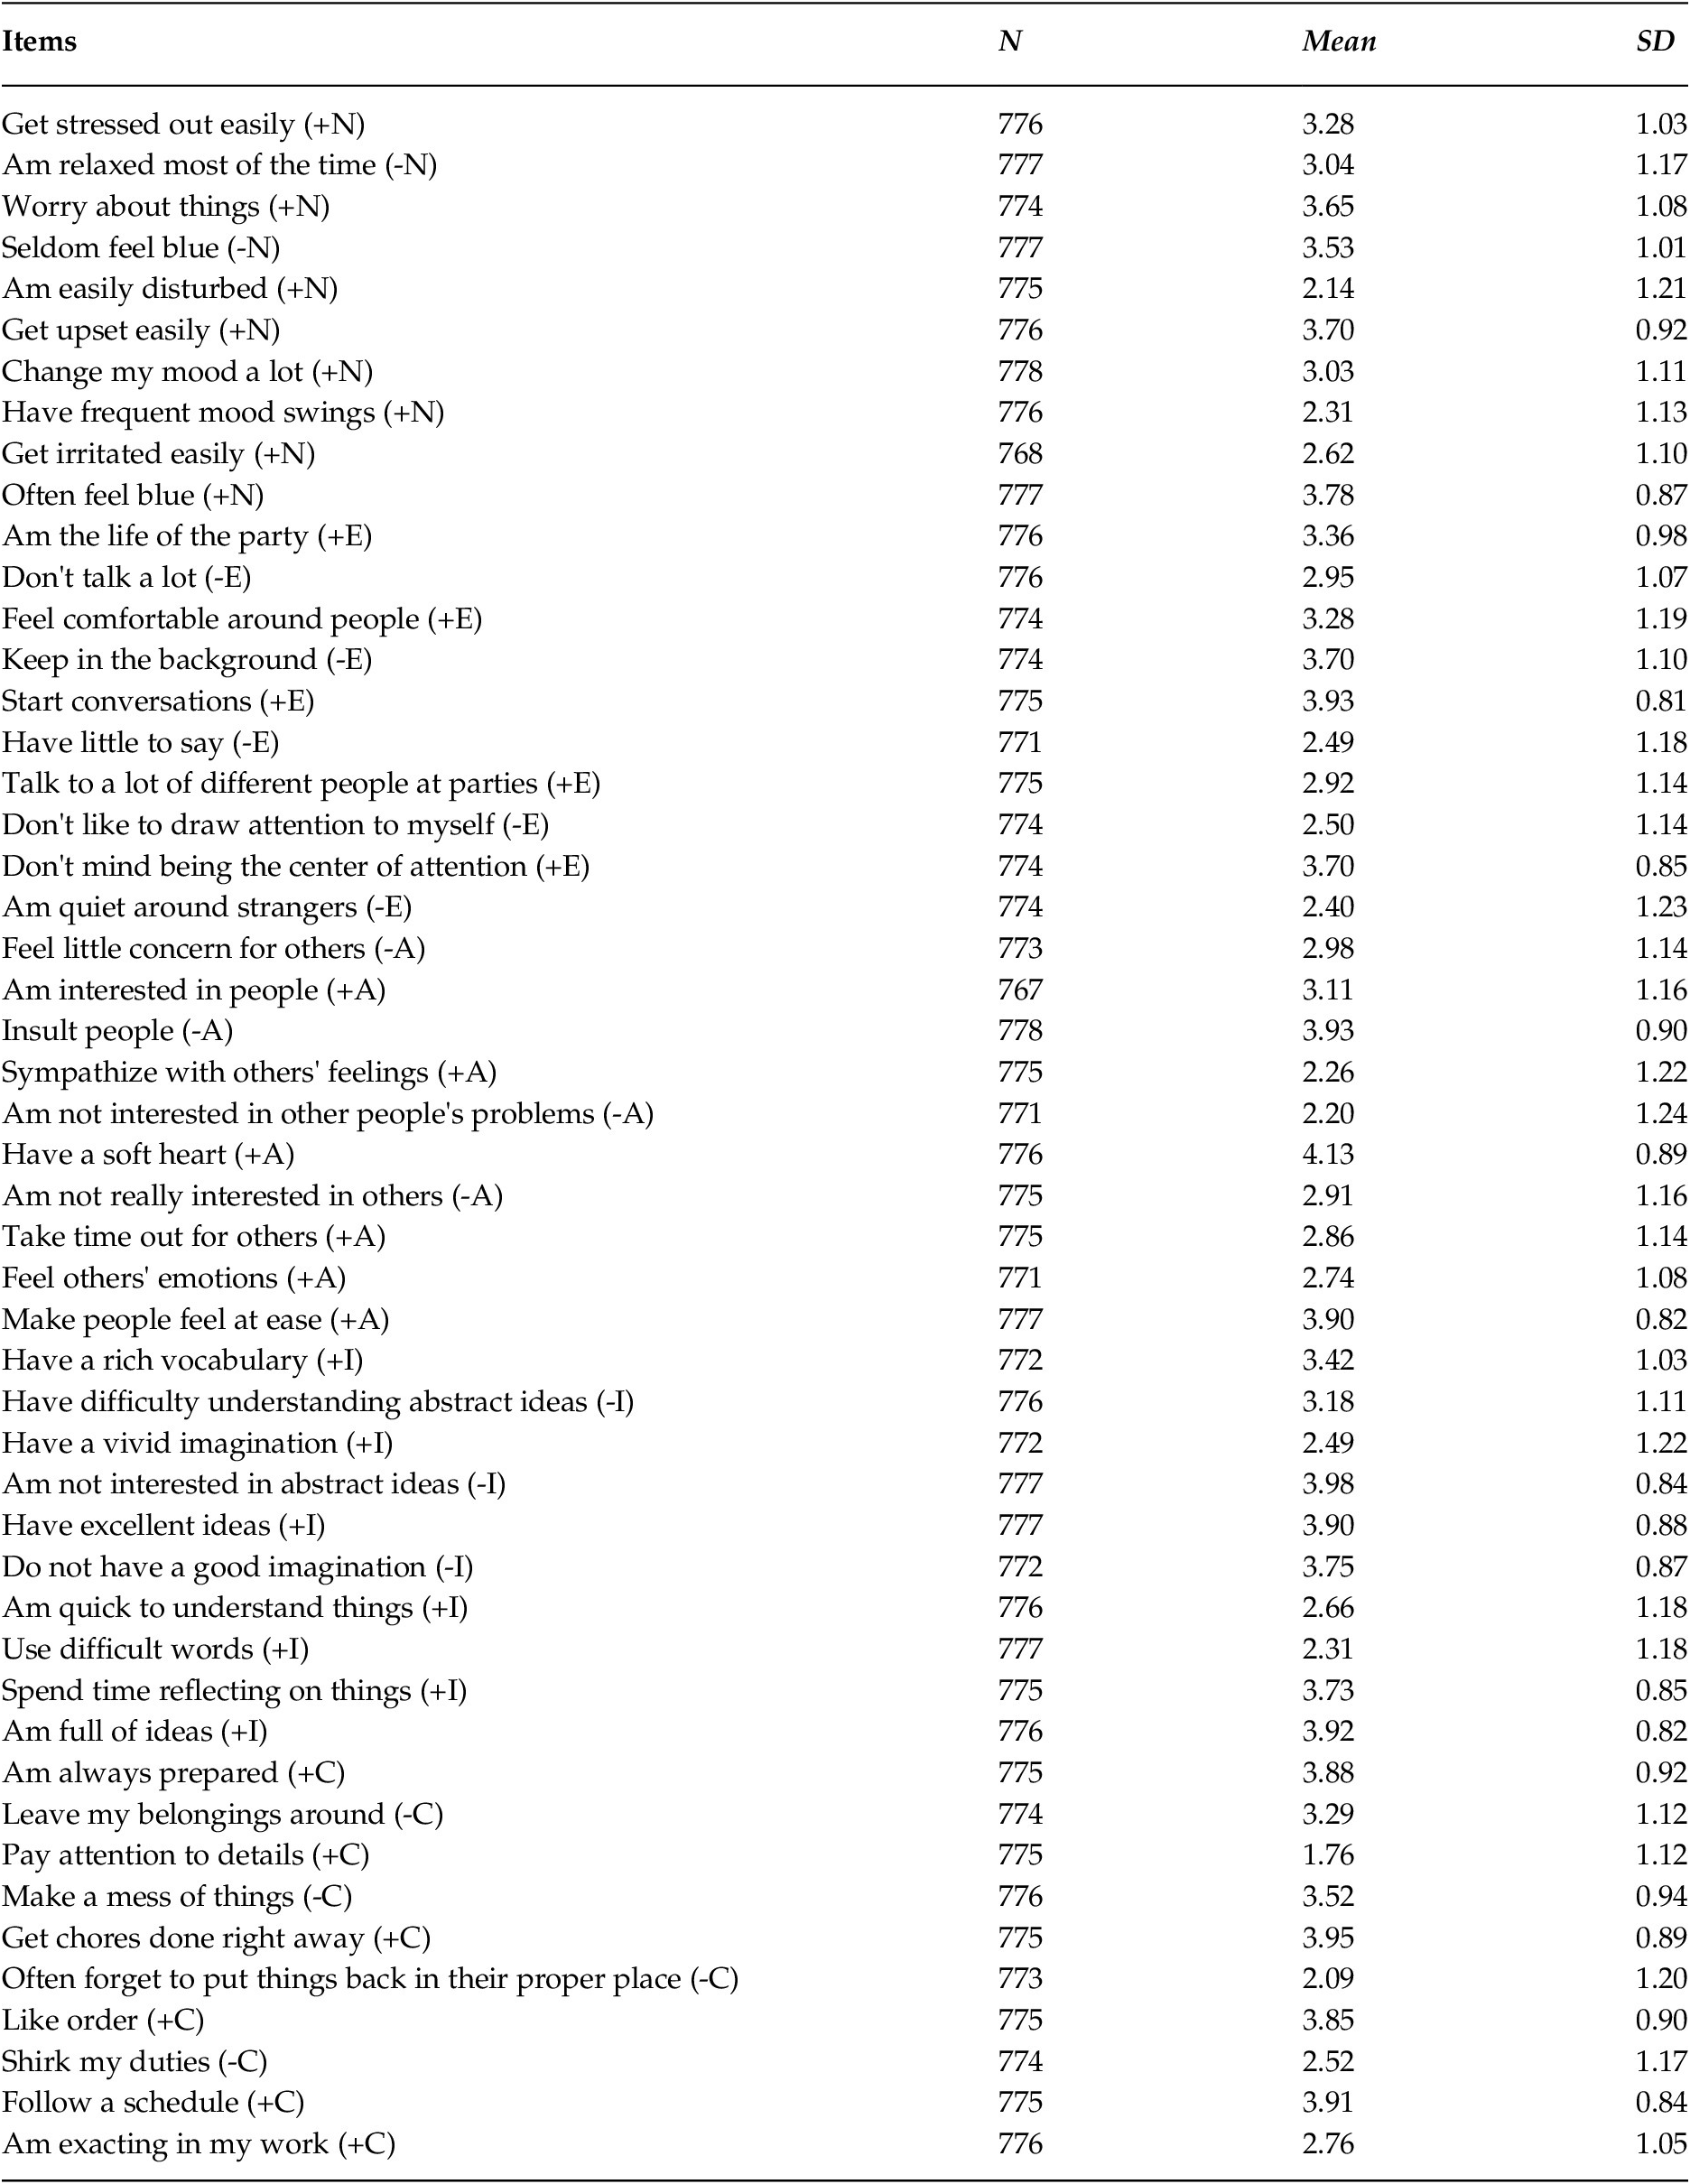
Note. N = Neuroticism; E = Extraversion, O = Openness-to-experience; A = Agreeableness; C = Conscientiousness.
Analysis Strategy
Estimation and Evaluation: All models were estimated using weighted-least-squares means and variances (WLSMV) estimation in Mplus 7.4 (Muthén & Muthén, Reference Muthén and Muthén1998–2017). Code for all analyses is availableFootnote 2. Models were evaluated based on the magnitude of the factor loadings and on model fit. We followed typically applied criteria whereby CFI and TLI ranging from .90 to > .95 and RMSEA < .06 were deemed indicative of good model fit (Hu & Bentler, Reference Hu and Bentler1999; Schermelleh-Engel et al., Reference Schermelleh-Engel, Moosbrugger and Müller2003). As we implement WLSMV estimation in Mplus, we also report WRMR, however it is noted that to date, little simulation evidence is available to suggest indicative cut-off values.
Measurement models: We initially fit a confirmatory factor model for an independent cluster five-factor model, allowing each of the trait factors to correlate. The model was identified by fixing the first factor loading on each latent factor to 1.0. If the model failed to reach minimum standards for model fit, as is common in the extant literature, we planned to apply three sets of models to identify misfit. First, single factor CFA models for each trait in order to identify possible correlated residuals. Second, an exploratory structural equation model (ESEM) with five correlated factors, modelling item cross-loadings and allowing for structural complexity. Third, we would consider the possibility of method factors in the data, and estimate five factor CFA models with latent factors included to account for variance due to different artefacts (see Podsakoff et al., Reference Podsakoff, MacKenzie and Podsakoff2012 for discussion of different approaches). Specifically, we estimated models including a general acquiescence factor (Figure 1, Panel A), positive and negative valence factors (Figure 1, Panel B), and finally a model with all three potential sources of method effect included (Figure 1, Panel C).
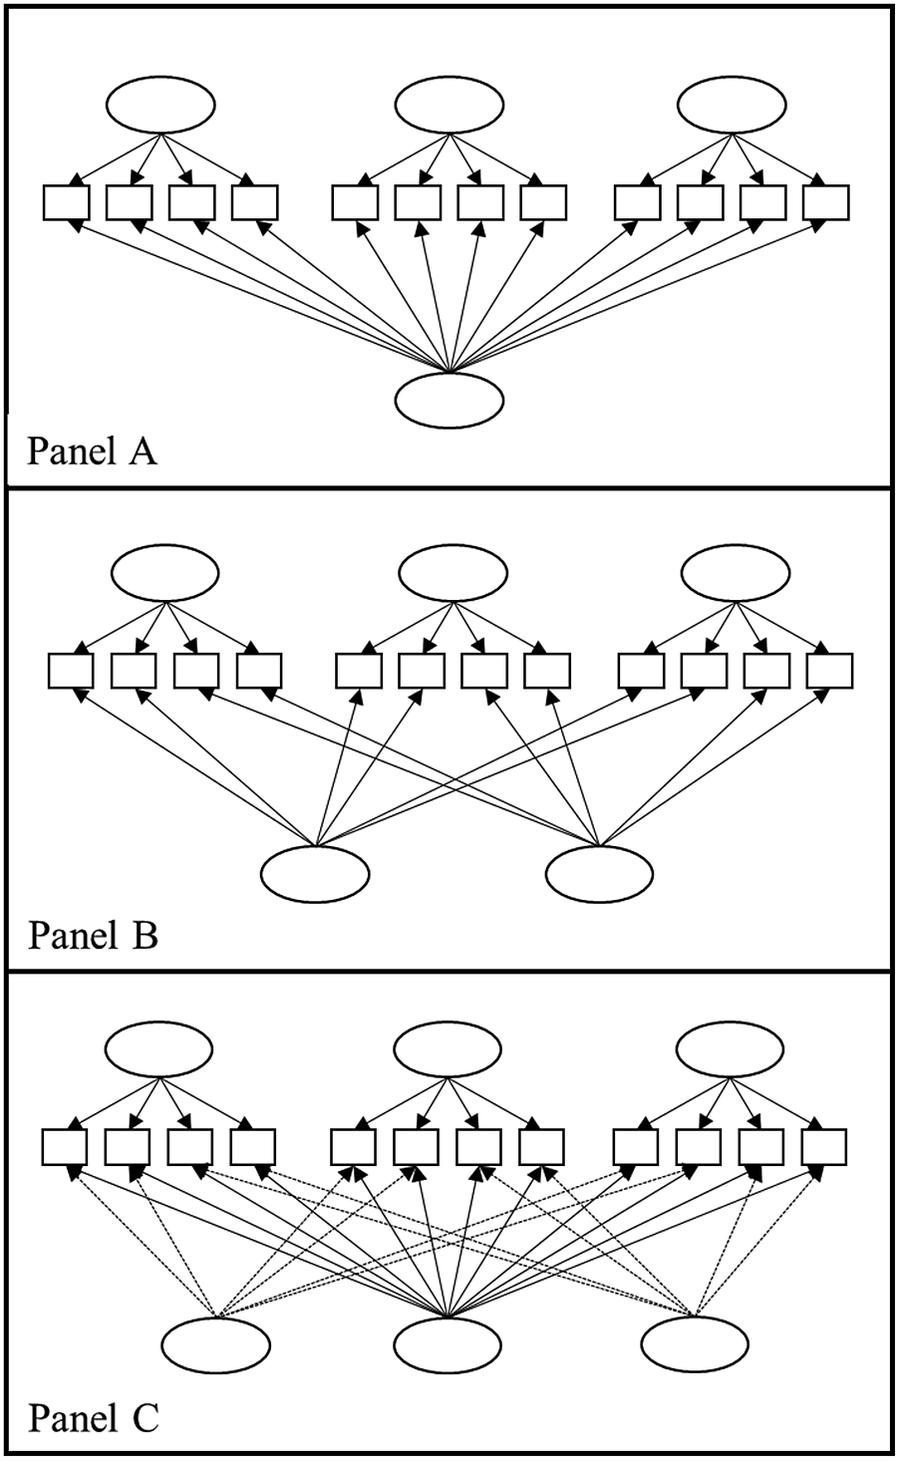
Figure 1. Diagrammatic Representation of Models Estimated to Investigate Method ArtefactsNote. A general aquiesence factor (Panel A), positive and negative valence factors (Panel B), model with all three potential sources of method effect included (Panel C). In all Panels, example personality factors are depicted above the factor indicators and method factors depicted below the factor indicators.
Results
Measurement models for the IPIP–50–S
The five-factor independent clusters CFA model converged, but the factor covariance matrix was non-positive definite due to factor correlations greater than 1.0. Given this, we considered this solution inappropriate.
Next, we examined each of the five factors independently. Four of the five single-factor CFA solutions showed poor fit, the one exception being Neuroticism (see Supplementary Tables S2 for model fit). Within these models, 12 of the 50 items did not load greater than .30 on their hypothesized factor, indicating that the items do not cohere as expected or produce a psychometrically strong scale. Perhaps more importantly, Neuroticism and Extraversion items, despite containing both positively (e.g., Don't mind being the center of attention) and negatively (e.g., Don't like to draw attention to myself) worded items, all loaded positively onto the single factor (see Supplementary Tables S3 to S7 for factor loadings).
To explore the data further, we first fit a five factor ESEM. Model fit for the ESEM model was reasonable, χ2 = 2027,881(985), p < .001; CFI = .95; TLI = .94; RMSEA = .037; WRMR 1.029. The full factor loading matrix for the ESEM solution is provided in Table 2.
Table 2. Factor Loading Matrix for the Five Factor ESEM

Note: Loadings in bold show those above 0.30. N = Neuroticism; E = Extraversion, O = Openness-to-experience; A = Agreeableness; C = Conscientiousness.
Consideration of the item loadings in Table 2 suggested that the solution was not conceptually similar to the a priori five-factor model. Factor 2 contained salient loadings (> .30) for a majority of the negatively worded items across traits, including loadings from eight of the 10 Neuroticism items. Similarly, Factor 3 contained salient loadings from all positively worded items from Conscientiousness and Intellect, and four positively worded items from both Extraversion and Agreeableness. Thus, these two factors seemed identifiable as method factors defined by item valence. Of the remaining factors, and based on the items with salient loadings, Factors 1 and 4 could be labelled Neuroticism and Agreeableness respectively. Factor 5 could not be readily labelled. To explore the data further, we also estimated ESEM models using CF-Parsimax Oblique, Oblimin Oblique, and Target rotation. The pattern of the results did not change. We have included the pattern matrices from these additional analyses in supplementary materials, Tables S10–S12.
Method Artefacts in the IPIP–50–S
Based on the indications from both the extant literature and the pattern of item loadings in Table 2, we explicitly modelled a series of method factors. Table 3 contains the model fit indices for models including positive and negative valence method factors (M1), a general acquiescence method factor (M2), and a model with positive, negative, and general acquiescence factors (M3). In all models, factor variances were fixed at 1 to identify to models, and WLSMV estimation was used.
Table 3. Model Fit Statistics for the Method Artefact Measurement Models
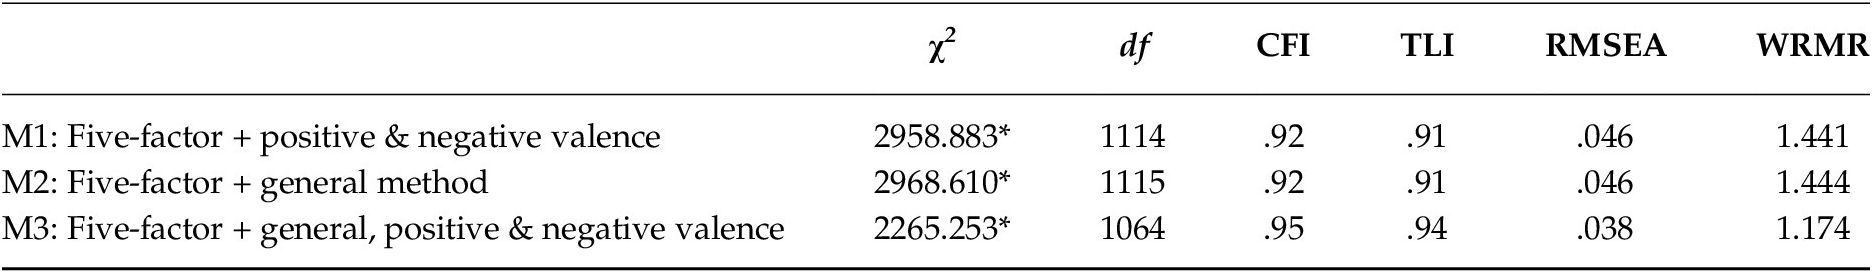
Note. * p < .001
Model fit across all models was acceptable to good. Unsurprisingly, the model containing all three method artefact latent variables showed the best model fit. Fit of this model was comparable to the ESEM model but was more parsimonious. In addition, the factor loadings from all models were more consistent with what would have been expected a priori. In M1 (see supplementary Table S8 for factor loadings), positively and negatively worded items loaded consistently on their respective valence factors. However, eleven items had loadings below .30 on their substantive factors. A similar pattern was true for model M2. All items had positive loadings on the general method factor and appropriate directionality of loading on their substantive factors. Again, the same eleven items failed to load on their a priori substantive factors above .30. However, in both M1 and M2, the factor correlations were much greater than would be expected, with absolute r ranging from .48 to .85 for M1, and .50 to .86 for M2.
Table 4 shows the full factor loading matrix for M3. Two primary observations can be made from Table 4. First, whilst the inter-factor correlations for M3 were in line with most five factor research in magnitude (+/– .10 to .42), the direction these correlations are not as would be anticipated. Consideration of the direction of the factor loadings, and thus the definition of the factors, does not clarify the pattern of correlations. Second, a majority of the variance in the items is typically accounted for by the methodological factors rather than their substantive factor.
Table 4. Factor Loading Matrix for the Five Factor CFA with a General Method Factor, and Positive and Negative Valence Factors
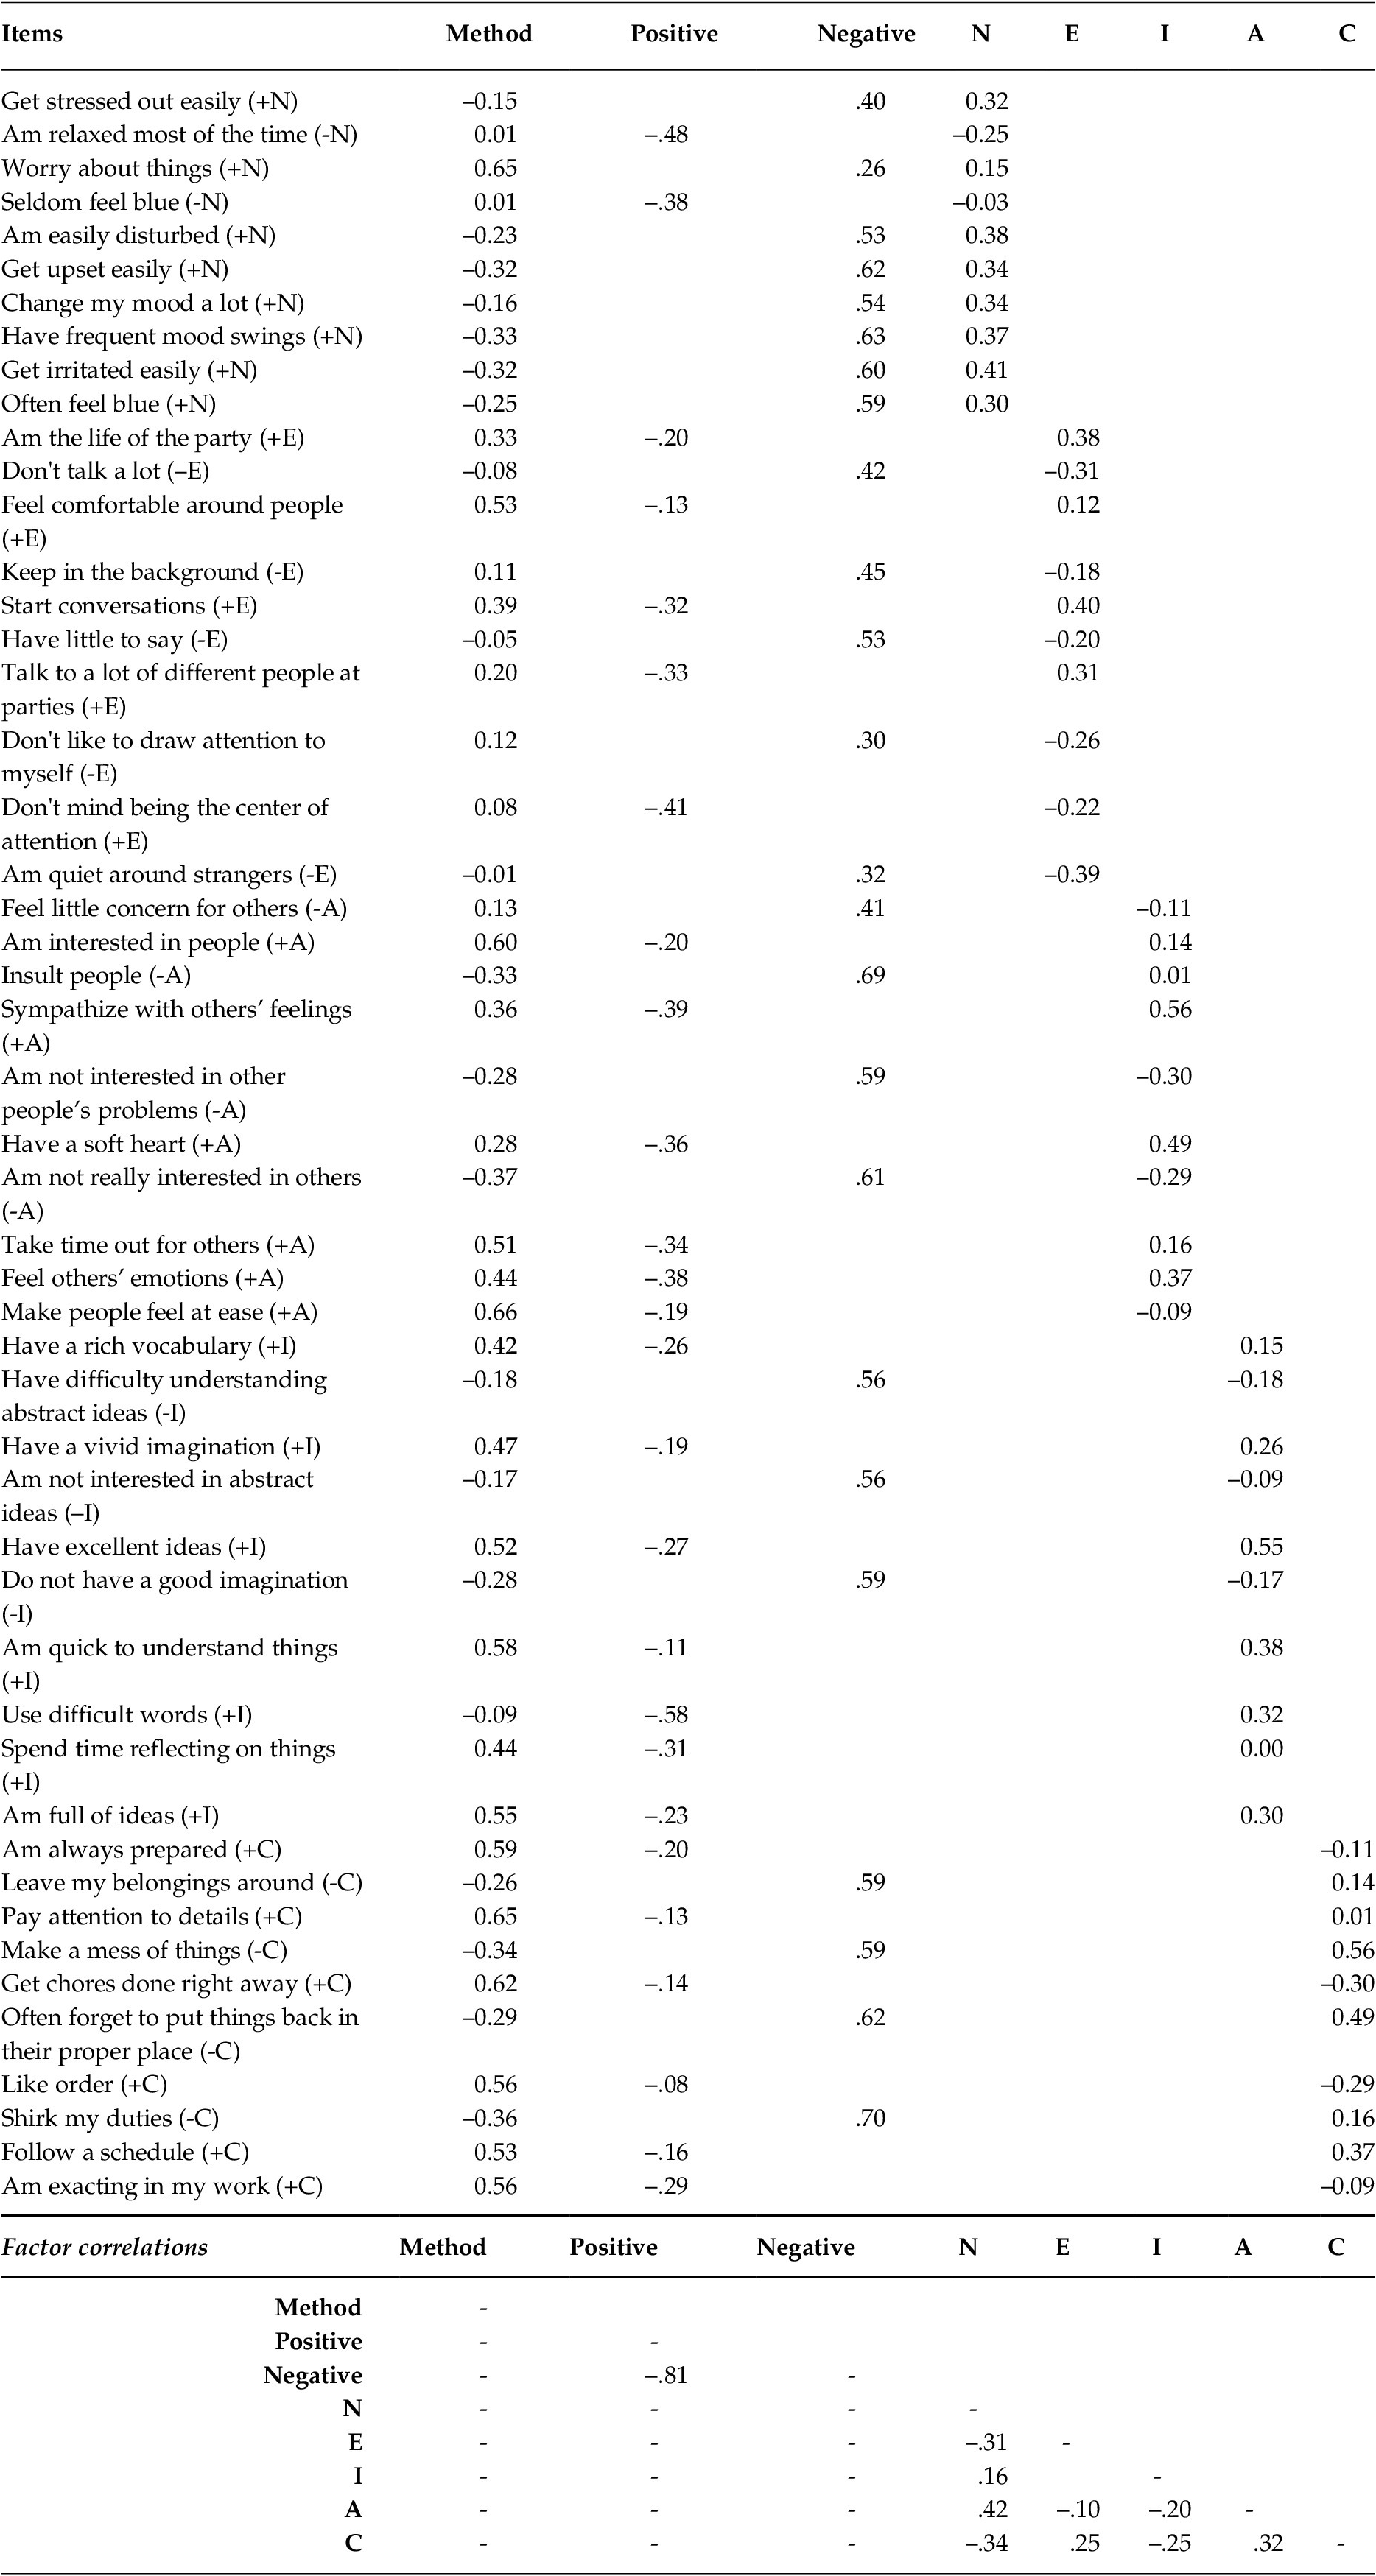
Note. N = Neuroticism; E = Extraversion, O = Openness-to-experience; A = Agreeableness; C = Conscientiousness
Discussion
Our goal was to evaluate the psychometric properties of the IPIP–50–S within a sample of Peruvian customer service employees. No previous studies had examined this scale in Peru or in a fully non-student sample. As expected, a CFA of the a priori model did not fit the data and with the exception of Neuroticism, the factors did not fit even when modeled independently. An ESEM model did improve the overall fit but the solution remained sub-optimal with numerous large cross-loadings and some items failing to load on the expected factor. These results are consistent with past research on five factor inventories (Booth & Hughes, Reference Booth and Hughes2014) and suggest that the IPIP–50–S is not well suited to research with Peruvian adults with a non-university level of education.
Further exploration of the possible sources of misfit were elucidating. Specifically, the ESEM pattern matrix suggested two factors that were consistently loaded by either positively or negatively worded items, suggesting that the variance attributable to these item valence was substantial (Suárez-Alvarez et al., Reference Suárez-Alvarez, Pedrosa, Lozano, García-Cueto, Cuesta and Muñiz2018). Once these two method factors were explicitly modeled, a CFA of all five factors demonstrated good levels of model fit, certainly comparable to other five factor inventories (Booth & Hughes, Reference Booth and Hughes2014). However, eleven items still failed to load substantially (> .3) on their hypothesized factor, with substantial loadings on respective method factors. Nevertheless, the current results suggest that when method factors are ignored, the IPIP–50–S is inappropriate for use within Peruvian samples. However, once the effect of acquiescence due to item valence has been modelled, the structure of the IPIP–50–S is closer to the a priori structure dictated by the English-language version (Goldberg, Reference Goldberg1992). These findings are consistent with similar patterns in other questionnaires that use positive and negatively worded items. For example, Suárez-Alvarez et al. (Reference Suárez-Alvarez, Pedrosa, Lozano, García-Cueto, Cuesta and Muñiz2018) examined a self-efficacy scale, within a Spanish-speaking sample, and found that combinations of positive and negative items reduced test reliability, undermined unidimensionality, and produced scale means that differed significantly from means derived from versions with all positive or negative items.
One striking observation is the magnitude of the method effects observed within this sample. We believe there are likely two main reasons for the substantial method effects. First, it is possible that diversity in lexical and syntactical structures across different Spanish-speaking nations meant that some items failed to translate in an equivalent manner, which exacerbated general method effects (Cupani & Lorenzo-Seva, Reference Cupani and Lorenzo-Seva2016). Second, unlike previous studies to investigate this inventory, our sample was educated to secondary level, not university level (e.g., Cupani, Reference Cupani2009; Gross et al., Reference Gross, Zalazar-Jaime, Piccolo and Cupani2012). Previous research has demonstrated that method artefacts, such as acquiescence, are exacerbated in samples with lower levels of educational attainment (Rammstedt et al., Reference Rammstedt, Goldberg and Borg2010, Reference Rammstedt, Danner and Bosnjak2017).
Nevertheless, the modeling approach employed largely controlled for these substantial effects, and thus, our results align with previous research demonstrating that once socially desirable or acquiescent responding is modelled, five factor inventories are somewhat structurally stable across cultures and educational levels (Rammstedt et al., Reference Rammstedt, Goldberg and Borg2010; Reference Rammstedt, Kemper and Borg2013; Suárez-Alvarez et al., Reference Suárez-Alvarez, Pedrosa, Lozano, García-Cueto, Cuesta and Muñiz2018).
To the authors knowledge, this is the first published attempt to examine the psychometric properties and appropriateness of the IPIP–50–S for use within a non-university educated sample, here a Peruvian sample. From the findings, it is recommended that caution be exercised in using the IPIP–50–S in such samples, without explicit actions taken to account for the influence of item valence and socially desirable responding. However, use of alternative measures may be preferable. For example, Cupani and Lorenzo-Seva (Reference Cupani and Lorenzo-Seva2016) proposed a variant of the Spanish IPIP designed to mitigate the effects of acquiescent responding. The data for the current study was collected prior to publication of this measure; however, future research might focus on the properties of this inventory across countries and educational levels.
In closing, we note the importance of psychometric evaluations of freely available translated inventories, like those provided by the IPIP, and would strongly advocate for continued efforts to link published and unpublished evaluations. Such a resource would allow researchers interested in cross-cultural research to identify whether translations provide accurate measurement in their target population and thus whether they are appropriate for the intended purposes (Hughes, Reference Hughes, Irwing, Booth and Hughes2018).
Supplementary Materials
To view supplementary material for this article, please visit http://dx.doi.org/10.1017/SJP.2020.11.


