


Introduction
World War I was a watershed in the history of warfare. It was the first war that saw widespread use of aircrafts, flamethrowers, machine guns, poison gas, and tanks. It was also the first war in which medical technology was sufficiently advanced to keep many wounded soldiers alive (Gabriel and Metz Reference Gabriel and Metz1992). In particular, World War I was the first war for which the number of Americans that were wounded in action outnumbered the dead. During World War I there were about 1.75 wounded American service members for each one that died, which was a significant improvement on the 0.77 wounded-to-dead ratio for the American Civil War.Footnote 1 Even if the reporting of wounds and deaths was not entirely consistent across wars, it seems likely that more wounded service members were kept alive during World War I than during any previous war in which the United States was involved.
Americans correctly anticipated the challenge of returning these wounded and disabled veterans to civilian life and in 1917 Congress passed the War Risk Insurance Act (WRIA), which guaranteed disabled veterans the right to vocational rehabilitation and represented a major break from the veteran benefits that came before it (The President’s Commission 1956: 130). As Beth Linker writes, “From America’s earliest wars to those of the second half of the nineteenth century, soldiers permanently injured in the line of duty received a lifetime of monetary reimbursement in the form of federal pensions, without any explicit demand of returning to gainful employment or a life of self-sufficiency” (Linker Reference Linker2011: 2). By passing the WRIA, Congress hoped to reduce the government’s financial burden from veterans’ pensions by returning disabled veterans to gainful employment. This article represents the first attempt, to my knowledge, to empirically assess whether the World War I rehabilitation program was successful in its goals.
To study the impact of World War I vocational rehabilitation on veterans’ labor market outcomes I collected data from the Abstracts of World War I Military Service for all army servicemen from the state of Missouri. These abstracts provide information on service members names, age, birthplace, wounds received in action, and disabilities when discharged from the army. With this information I separate veterans into four mutually exclusive categories: (1) veterans that were not wounded in action and not disabled when discharged; (2) veterans that were wounded in action but not disabled when discharged; (3) veterans that were not wounded in action but were disabled when discharged; and (4) veterans that were both wounded in action and disabled when discharged.Footnote 2
The servicemen from these abstracts were then linked forward to the 1940 US Census to obtain long-run labor market outcomes. Finally, I linked a random subset of veterans to the United States Veterans Administration Master Index, 1917–1940, which provides information on whether a veteran was rehabilitated. The resulting dataset provides information on veterans’ military service and long-run labor market outcomes and a subset of the data contains information about rehabilitation status.
I present three main results in this article. First, veterans that were both wounded in action and disabled when discharged were the most likely to participate in the vocational rehabilitation program. In particular, only 2 percent of veterans who were not wounded and not disabled participated in the program. Between 14 and 20 percent of veterans that were either wounded or disabled, but not both, participated. In contrast, 70 percent of veterans that were both wounded and disabled participated in the rehabilitation program. This high percentage of participation among wounded and disabled veterans is due to the fact that only veterans that could display a permanent disability linked to their military service were eligible to participate in the program.
Second, veterans that were either wounded in action or disabled at discharge, but not both, had labor market outcomes that were significantly worse than their nonwounded, nondisabled peers. However, veterans that were both wounded and disabled saw significant improvements in their labor market outcomes. They had significantly higher wages, had higher occupational standings, were less likely to be laborers, and were more likely to be white-collar workers. The identifying assumptions required to attribute these results to these veterans’ eligibility for the rehabilitation program likely hold, although some are untestable.
Third, using the subset of veterans for which I have actual rehabilitation data, I compare the outcomes of veterans that were rehabilitated with those that were not. Veterans that were wounded in action or disabled at discharge and participated in the rehabilitation program had better outcomes than their wounded and disabled peers that did not participate.
Although this article studies a historical rehabilitation program the findings are of contemporary interest. With military conflicts persisting around the world, studying veterans’ rehabilitation remains of great importance. For example, the Veterans Administration (VA) is currently attempting to rehabilitate many veterans from America’s recent wars in their Vocational Rehabilitation & Employment program (VR&E). This program is the direct successor of, and shares many features with, the World War I rehabilitation program studied in this article.
This article contributes to two literatures. This first is the literature about the effect of military service on veterans’ long-run outcomes. Numerous papers have studied the impact of military service on labor market outcomes. Tan (Reference Tan2020) studies the effect of World War I military service on economic status, while Laschever (Reference Laschever2013) focuses on social networks and employment. Angrist (Reference Angrist1990), Angrist and Krueger (Reference Angrist and Krueger1994), and Hirsch and Mehay (Reference Hirsch and Mehay2003) study the impact of military service on wages. In addition, Autor et al. (Reference Autor, Mark, Kyle and Lyle2016) and Coile et al. (Reference Coile, Mark and Audrey2015) study the impact of the VA’s disability compensation program on labor force participation rates and wages for disabled veterans of more recent conflicts. Other studies have examined the effect of military service on nonlabor market outcomes such as educational attainment (Angrist Reference Angrist1993; Angrist and Chen Reference Angrist and Chen2011; Bound and Turner Reference Bound and Sarah2002), health (Bedard and Deschênes Reference Bedard and Olivier2006; Costa Reference Costa2012; Costa and Kahn Reference Costa and Kahn2010) and housing (Fetter Reference Fetter2013; Hausman Reference Hausman2016). I extend this literature by focusing on the labor market return to rehabilitation. In addition, the results of this article demonstrate that veterans’ heterogenous wartime experiences matter for long-run outcomes. While there are exceptions (see Costa and Kahn Reference Costa and Kahn2007, Reference Costa and Kahn2010), most of the previous literature has focused on estimating the return to veteran status and has not taken into account heterogenous wartime experiences, such as disabilities resulting from military service.
This article also contributes to the literature about World War I rehabilitation. World War I was the first war that involved a systematic effort to rehabilitate wounded and disabled veterans. Along with Beth Linker’s seminal work (Linker Reference Linker2011, Reference Linker2016), many others have written about the topic (Anderson and Perry Reference Anderson and Perry2014; Carden-Coyne Reference Carden-Coyne2007; Kinder Reference Kinder2015; Malone Reference Malone2013). This article extends this literature by providing an empirical analysis of the labor market outcomes for veterans that were rehabilitated.
Historical Background: World War I Vocational Rehabilitation
Rehabilitating wounded and disabled veterans to help them reintegrate into the civilian labor market was of particular interest during World War I. Europe had been at war for nearly three years before the United States entered the conflict and Americans knew that medical advances were keeping many wounded soldiers alive, but with disabilities. The discovery of sodium citrate as an effective anticoagulant allowed for the first successful battlefield blood transfusions. X-ray machines saw widespread use during surgery to remove bullets and shrapnel. The use of mobile bacteriology laboratories allowed surgeons to test bacteria counts before closing a wound and the introduction of Carrel–Dakin’s solution greatly reduced mortality due to wound infection (Gabriel and Metz Reference Gabriel and Metz1992). In addition, motorized ambulances allowed wounded soldiers to be quickly transported from the front lines to a hospital.
The large number of wounded and disabled service members that were anticipated to return from the war created a problem for the United States’ federal government. By 1915, Civil War pensions had ballooned in cost to more than $200 million annually or approximately 25 percent of federal expenditures (Linker Reference Linker2011). Glasson (Reference Glasson1918) reports that Civil War pensions had cost the federal government about $5 billion in total and there was little desire to extend these generous pension benefits to service members returning home from World War I. Accordingly, in 1917 Congress passed, and President Wilson signed, the WRIA. This act provided five basic benefits to World War I veterans: “(1) Support for the dependents of members of the Armed Forces during service; (2) low-cost life insurance on a voluntary basis; (3) compensation for the war-disabled and for the dependents of the dead; (4) vocational rehabilitation for the disabled, and (5) medical and hospital care” (The President’s Commission 1956: 25–26).
The goal of vocational rehabilitation was to train disabled veterans for a specific job so they could be gainfully employed. Disabled veterans could undertake two types of rehabilitation training: education or placement. Education training usually took place in a school and placement training placed veterans in “an apprentice like arrangement for a specific job” (The President’s Commission 1956: 131). The placement training “was found to be the best form of training for a great many vocations” and veterans often trained with firms who guaranteed employment after training was complete (Thurber 1944: 18). During the course of training wounded and disabled veterans were paid a stipend of $100 a month if they had no dependents and $120 a month if they had dependents. Figure 1 displays a 1919 poster from the American Red Cross that advertised the rehabilitation program.

Figure 1. American Red Cross rehabilitation advertisement.
Source: Chambers (1919). Retrieved from the Library of Congress, https://www.loc.gov/item/2002708940/.
By the time the program ended in 1928 a total of 675,000 veterans applied for rehabilitation, 337,000 were deemed eligible and admitted to the program, 180,000 entered training, and 129,000 completed the program. More than 3,500 educational institutions, 30,000 businesses, and 6,000 farms took part in the training. In total, $645 million were spent rehabilitating disabled veterans, which was considerably less than the $5 billion spent on Civil War pensions. In addition, about 79 percent of this was spent on stipends for the disabled veterans; a cost that would have been incurred even in the absence of the program, since disabled veterans were entitled to a pension. Thus, the actual tuition and administrative costs of the program were only $135 million (Dillingham Reference Dillingham1952). A 1956 report to President Eisenhower claims that the program was a great success. Government representatives “maintained contacts with employers to secure their cooperation” in hiring rehabilitated veterans and “in general employment representatives were successful in placing trainees” (The President’s Commission 1956: 131). By the end of the program in 1928, 97 percent of rehabilitated veterans had been successfully placed in gainful employment.Footnote 3
To determine if the vocational rehabilitation program was successful at reintegrating veterans into the civilian labor market it is important to understand who was eligible to participate in the program. The WRIA specified that veterans would be rehabilitated “in cases of dismemberment, of injuries to sight or hearing, and of other injuries commonly causing permanent disability” (The War Risk Insurance Act 1917). The WRIA provided the mandate for rehabilitation, but the Vocational Rehabilitation Act (VRA) of 1918 filled in the actual details. This act specified that a veteran could be rehabilitated if he was “disabled under circumstances entitling him … to compensation under Article III of the [War Risk Insurance] Act … and who, after his discharge, in the opinion of the board, is unable to carry on a gainful occupation, to resume his former occupation, or to enter upon some other occupation” (VRA 1918). Thus, whether a veteran was eligible to participate in the rehabilitation program was decided on a case-by-case basis by the Federal Board for Vocational Education (Thurber Reference Thurber1946) starting in 1919.Footnote 4 The eligibility for rehabilitation was extended in 1919 when the VRA was amended to include any veteran who developed a disability after discharge that was determined to have originated from their military service. It was also no longer required that the disability change a veteran’s vocational aptitude. Finally, the World War Adjusted Compensation Act of 1924 further extended rehabilitation to any veteran who developed a disability prior to July 2, 1921 that was determined to be connected to their military service.
As mentioned in the preceding text, the WRIA also provided monetary compensation to disabled veterans. Due to the unpopularity of veteran pensions during the World War I era, the WRIA changed the name of payments to veterans from “pension” to “compensation.” The compensation program began by paying permanently disabled veterans $30 a month or $360 a year, which was “a low rate of compensation” (The President’s Commission 1956: 28). It went through several phases of liberalization and economy during the 1920s and 1930s. By 1939 (the year for which I observe labor market outcomes), payments had reverted to being called pensions, which were only made available to veterans under strict conditions. Veterans had to have 90 days of service, part of which must have been during the war, an honorable discharge, permanent and total disability not of their own cause, and demonstrate income less than $1,000 a year if single or less than $2,500 a year if married or had dependent children. If a veteran met these criteria, they would be eligible to receive a pension of $40 a month or $480 a year.
Data
World War I provides a unique opportunity to study the effect of vocational rehabilitation on veterans’ labor market outcomes due to publicly available data. Three data sources were used in this article.
The first is Abstracts of World War I Military Service. These abstracts record a veteran’s name, race, address of residence, place and date of enlistment or induction into the armed forces, city and state (or country) of birth, age or date of birth, ranks and dates of promotions, engagements, whether wounded in action, the range of dates served overseas, the date discharged from the armed forces, disability status when discharged, and whether the soldier was awarded any citations for exceptional conduct or valor. Panel A of figure 2 displays a service abstract for Joseph Henry Prior, who was a private that was severely wounded in action. The phrase “In view of occupation he was, on date of discharge, reported Y per cent disabled” means that Joseph Henry Prior was disabled when he was discharged from the army. When there is an “N,” rather than a “Y,” the veteran was not disabled when discharged.

Figure 2. Service abstract and master index card.
Panel A: World War I military service abstract for Joseph Henry Prior.
Panel B: Master index card for Joseph Henry Prior.
Sources: Panel A is a picture from the Abstracts of World War I Military Service for the state of Missouri, which were accessed from the Missouri Digital Heritage Collection (2020). Panel B is a picture of an index card from the United States Veterans Administration Master Index, 1917–1940 provided by FamilySearch (2020).
I collected abstracts for every army service member from the state of Missouri from the Missouri Digital Heritage Collection (2020). As shown in panel A of figure 2, these abstracts had already been digitized by the Missouri State Archives so I was able to obtain abstracts for all 141,671 men from the state that served in the army during World War I.Footnote 5 Of this sample, only 100,889 had information on their birthplace, which is important for finding the veteran in the 1940 census.
The second data source used is the 1940 U.S. Census. I link veterans from their military service abstracts to the 1940 census to obtain long-run labor market outcomes. To perform the linking I use the ABE algorithm, which is commonly used in economics and was developed by Abramitzky, Boustan, and Eriksson (Abramitzky et al. Reference Abramitzky, Boustan and Katherine2012, Reference Abramitzky, Boustan and Katherine2014, Reference Abramitzky, Boustan and Katherine2019a) and is similar to the algorithm used in Ferrie (Reference Ferrie1996) and Long and Ferrie (Reference Long and Joseph2013). I begin by adjusting first names for common nicknames and then standardize each first and surname using the NYSIIS algorithm, which transforms a name into a phonetic code. I then restrict the sample to veterans who are unique by NYSIIS first name, NYSIIS surname, birthplace, birth year, and race. Using these variables, I search for each veteran in the 1940 census. If a unique match is found the observation is declared to be a match. If multiple matches are found the observation is discarded. If no match is found then I continue to search for individuals who match exactly on NYSIIS first name, NYSIIS surname, birthplace, and race, but allow birth year to differ by up to one year (e.g., if a veteran reports a birth year of 1899 I will search for individuals in the 1940 census with a birth year of 1898 and 1900). If still no unique match is found then I continue to search for individuals who match exactly on NYSIIS first name, NYSIIS surname, birthplace, and race but allow birth year to differ by up to two years. I searched for 100,899 veterans from Missouri and I was able to successfully link 42,652 of them or 42 percent. While there are several different linking algorithms currently being used in economics, Abramitzky et al. (Reference Abramitzky, Boustan, Eriksson, Feigenbaum and Pérez2019b) show that automated methods, including the one used in this article, result in low false positive rates and similar coefficient estimates relative to a hand linked sample.Footnote 6
The final data set used was the United States Veterans Administration Master Index, 1917–1940 provided by FamilySearch (2020). This collection contains index cards with information on approximately 5.7 million veterans who made (or whose heirs made) claims for veteran benefits between 1917 and 1940. These cards are particularly valuable for this project because they contain information on whether a veteran participated in the vocational rehabilitation program. While the names of the veterans in the VA Master Index have been digitized and are searchable, the information on rehabilitation status has not been digitized. Accordingly, veterans had to be searched for by hand. I searched for 3,500 randomly selected veterans from the linked dataset and was able to successfully find master index cards for 2,848 (81 percent) of them.Footnote 7 Panel B of figure 2 shows the master index card for Joseph Henry Prior. The fact that there are numbers next to the letter “R” means that he was in the vocational rehabilitation program.
A concern with any linked sample is whether it is representative of the overall population. Table 1 addresses this concern by comparing a number of characteristics for veterans that were successfully linked to the entire sample of veterans that I attempted to link. Column (1) displays the average for veterans that were successfully linked, while column (2) displays the average for all veterans that I attempted to link. Column (3) displays the p-value from a test of the equality of means between columns (1) and (2). Veterans that were successfully linked were slightly older, more likely to have an enlisted rank, less likely to have a specialist rank, and more likely to have been born in the state of Missouri. The differences between the successfully linked sample and the sample that I attempted to link are small in magnitude, even when they are significantly different. For example, 88.1 percent of my linked sample had an enlisted rank, while 86.4 percent of the sample that I attempted to link had an enlisted rank.
Table 1. Comparison of successfully linked veterans with the entire sample that was attempted to link

Source: Data are from the Abstracts of World War I Military Service for the state of Missouri, which were accessed from the Missouri Digital Heritage Collection (2020).
Notes: Column (3) reports the p-value from a test of the equality of means between columns (1) and (2).
a Enlisted ranks include corporals, privates, and sergeants.
b Commissioned officers include 2nd lieutenants, 1st lieutenants, captains, majors, and colonels.
c Specialist ranks include band leaders, buglers, cooks, farriers, mechanics, musicians, saddlers, and wagoners.
Summary statistics for veterans that were linked are presented in table 2. Column (1) shows summary statistics for the entire sample of veterans that were linked to the 1940 census. Note that not all veterans have information on income and occupation, so a smaller sample of veterans was used for the statistics on weekly wage, constructed income score, and OCC score. About 5 percent of veterans were wounded in action, 7.4 percent were disabled when discharged, and 1.4 percent were both wounded and disabled. Column (2) shows summary statistics for the subset of veterans whose VA master index card I found. About 5 percent of veterans were rehabilitated. Finally, column (3) displays the p-value from a test of the equality of means between columns (1) and (2). Veterans with rehabilitation data had slightly fewer years of schooling and were slightly more likely have an enlisted rank and less likely to be a commissioned officer. Otherwise, there were no significant differences between the entire sample of linked veterans and the sample whose VA master index card I found, meaning that the sample with rehabilitation data should be representative of the larger sample. This is, of course, expected because I randomly selected 3,500 veterans to search for rehabilitation data for.
Table 2. Summary statistics

Sources: Data are from the 1940 US Census (labor market outcomes and years of schooling) and the Abstracts of World War I Military Service (military service information), which were accessed from the Missouri Digital Heritage Collection (2020). The rehabilitation information is from the United States Veterans Administration Master Index, 1917–1940 provided by FamilySearch (2020).
Notes: Column (3) reports the p-value from a test of the equality of means between columns (1) and (2).
a Weekly wages are only calculated for veterans that worked more than 30 weeks and reported being a wage worker. Thus, the number of observations used to calculate the weekly wages statistics are different from the number reported in each column. In column (1) 20,708 observations are used to calculate weekly wages and in column (2) 1,345 observations are used.
b Constructed income is only calculated for veterans in an occupational, sex, region, race, and worker class (self-employed vs. wage worker) cell for which I was able to successfully construct income from the 5 percent IPUMS sample of the 1960 census. Thus, the number of observations used to calculate the constructed income score statistics are different from the number reported in each column. In column (1) 38,830 observations are used to calculate constructed income and in column (2) 2,565 observations are used.
c OCC Score is only calculated for veterans for which OCC score was not zero (zero means not applicable according to IPUMS). Thus, the number of observations used to calculate OCC score statistics are different from the number reported in each column. In column (1) 39,428 observations are used to calculate OCC score and in column (2) 2,617 observations are used.
d Enlisted ranks include corporals, privates, and sergeants.
e Commissioned officers include 2nd lieutenants, 1st lieutenants, captains, majors, and colonels.
f Specialist ranks include band leaders, buglers, cooks, farriers, mechanics, musicians, saddlers, and wagoners.
Determinants of Rehabilitation
This section explores the determinants of veterans being rehabilitated. As discussed in the “Historical Background” section, the WRIA and the VRA made rehabilitation available to disabled veterans that could not resume their former job or carry on gainful employment. However, eligibility for the program was decided on a case-by-case basis by the Federal Board for Vocational Education (Thurber Reference Thurber1946). The board decided whether a veteran was eligible for rehabilitation when they applied to the program, which might have occurred anytime between 1919 and 1928. Thus, it is possible that many of the veterans that I observe being disabled when discharged from the army were not, later on, deemed eligible for the rehabilitation program by the board. It is also possible that many veterans that were not wounded in action and not disabled when discharged were deemed eligible for the program by the board. While I do not have data on veterans that the board deemed eligible, I do have data on whether a veteran participated in the program conditional on being eligible. I, therefore, examine how participation in the rehabilitation program related to veterans’ wounds and disabilities.
I begin by dividing veterans into four mutually exclusive categories: (1) veterans that were not wounded in action and not disabled when discharged; (2) veterans that were wounded in action but not disabled when discharged; (3) veterans that were not wounded in action but were disabled when discharged; and (4) veterans that were both wounded in action and disabled when discharged. Table 3 displays counts of veterans in each category broken down by rehabilitation status for the 2,848 veterans for which I have rehabilitation data. Only 2.4 percent of veterans that were neither wounded nor disabled participated in the program. Fourteen percent of veterans that were wounded in action participated in the program while 20 percent of veterans that were disabled at discharge participated in the program. Seventy percent of veterans that were both wounded in action and disabled at discharge participated in the vocational rehabilitation program. Thus, being both wounded in action and disabled when discharged is a strong predictor for participating in the program and, therefore, having been deemed eligible for the program by the Federal Board for Vocational Education.
Table 3. Rehabilitation status by disability and wound status

Source: Data are from the Abstracts of World War I Military Service for the state of Missouri, which were accessed from the Missouri Digital Heritage Collection (2020).
Notes: This table shows the number and percent of veterans that were rehabilitated based on disability status at discharge from the army and wounds received in action.
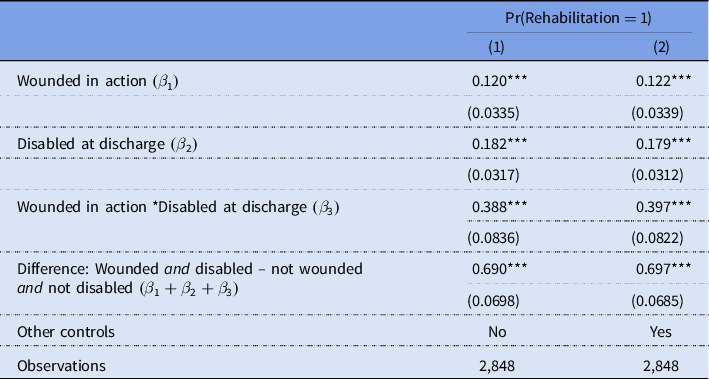
Table 4 formalizes the results presented in table 3 through regression analyses. In these regressions the dependent variable takes a value of one if the veteran was rehabilitated and a value of zero if the veteran was not rehabilitated. Column (1) shows that being wounded, but not disabled, increased the probability of being rehabilitated by 12 percentage points. Being disabled, but not wounded, increased the probability of being rehabilitated by 18 percentage points. Being both wounded and disabled increased the probability of being rehabilitated by an additional 39 percentage points. Thus, veterans that were both wounded and disabled were 69 percentage points more likely to have been rehabilitated than veterans that were not wounded and not disabled. Column (2) repeats the specification from column (1), but now includes controls for years of education, rank in the army, marital status, birthplace fixed effects, state of residence in 1940 fixed effects, and a quadratic in age. The results remain almost identical after including these controls. Importantly, the coefficient
 ${\beta _3}$
is significantly different from the coefficients
${\beta _3}$
is significantly different from the coefficients
 ${\beta _1}$
and
${\beta _1}$
and
 ${\beta _2}$
in both columns of table 4. This implies that veterans that were both wounded and disabled were significantly more likely to participate in the rehabilitation program than veterans that were either one or the other.
${\beta _2}$
in both columns of table 4. This implies that veterans that were both wounded and disabled were significantly more likely to participate in the rehabilitation program than veterans that were either one or the other.
Table 4. Wounded and disabled veterans and the likelihood of being rehabilitated
Sources: The rehabilitation information is from the United States Veterans Administration Master Index, 1917–1940 provided by FamilySearch (2020). Information on wounds and disabilities are from the Abstracts of World War I Military Service, which were accessed from the Missouri Digital Heritage Collection (2020).
Notes: This table provides estimates from a descriptive regression where a dummy variable for being rehabilitated is the dependent variable. Column (2) controls for years of schooling (as a continuous variable), a dummy variable if a veteran was part of the enlisted ranks (corporals, privates, and sergeants), a dummy variable if a veteran was part of the specialist ranks (band leaders, buglers, cooks, farriers, mechanics, musicians, saddlers, and wagoners), dummy variables for marital status (married spouse present, married spouse absent, separated, divorced, widowed, and never married), fixed effects for birth state (or country if born outside United States), fixed effects for state of residence in 1940, and a quadratic in age. Standard errors are robust to heteroskedasticity. See text for more details on the dependent and independent variables of interest.
*p < 0.1; **p < 0.05; ***p < 0.01.
The main results in this section provide strong evidence that being both wounded in action and disabled at discharge is a strong proxy for participation in (and being eligible for) the vocational rehabilitation program. In addition, being both wounded and disabled is a stronger predictor of program participation than being either wounded or disabled, but not both.
Empirical Methodology
Motivated by the results in tables 3 and 4, I begin by analyzing differences in labor market outcomes for veterans that were both wounded and disabled. To do this I adopt the following empirical specification:
 $$Outcom{e_i} = {\beta _1}Wounde{d_i} + {\beta _2}Disable{d_i} + {\beta _3}Wounde{d_i} \times Disable{d_i} + {\bf{\Gamma '}}{\bf X_{\boldsymbol {i}}} + {\varepsilon _i}$$
In equation (1) i indexes veterans and
 $Outcom{e_i}$
is one of six labor market outcomes for veteran i in 1940. These six outcomes are (1) a dummy variable indicating whether veteran i was in the labor force, (2) the log of a veteran’s weekly wage, (3) the log of a veteran’s constructed income score, (4) the log of a veteran’s occupational income score (OCC score), (5) a dummy variable indicating if veteran i was a laborer, and (6) a dummy variable indicating whether veteran i was a white-collar worker, which I define as being a clerk, manager, professional, or salesperson.
$Outcom{e_i}$
is one of six labor market outcomes for veteran i in 1940. These six outcomes are (1) a dummy variable indicating whether veteran i was in the labor force, (2) the log of a veteran’s weekly wage, (3) the log of a veteran’s constructed income score, (4) the log of a veteran’s occupational income score (OCC score), (5) a dummy variable indicating if veteran i was a laborer, and (6) a dummy variable indicating whether veteran i was a white-collar worker, which I define as being a clerk, manager, professional, or salesperson.
As mentioned in the “Historical Background” section, some veterans would have been eligible for a pension. However, these pensions should not inflate weekly wages because census enumerators were instructed to record nonwage, nonsalary income more than $50 (which would include pensions) in a separate category from wage and salary income. I also use alternative measures of socioeconomic status, such as OCC score and constructed income scores, which are determined by occupation rather than income. These alternative measures should, therefore, not be impacted by a veteran receiving a pension.
OCC scores are a measure of occupational standing defined by IPUMS as “the median total income (in hundreds of 1950 dollars) of all persons with that particular occupation in 1950” (Ruggles et al. Reference Ruggles, Sarah, Ronald, Josiah, Erin, Jose and Matthew2020). The constructed income score is a measure of occupational standing that I constructed following Collins and Wanamaker (Reference Collins and Wanamaker2017). This measure assigns an income score to individuals in the same occupation, gender, race, region of residence, and worker type (self-employed vs. wage worker) cell. This is a more granular measure of occupational standing than OCC scores and it allows me to assign scores to individuals who were self-employed and farmers.Footnote 8
 $Wounde{d_i}$
is a dummy variable that takes a value of one if veteran i was wounded in action during World War I and
$Wounde{d_i}$
is a dummy variable that takes a value of one if veteran i was wounded in action during World War I and
 $Disable{d_i}$
takes a value of one if veteran i was disabled when they were discharged from the army.
$Disable{d_i}$
takes a value of one if veteran i was disabled when they were discharged from the army.
 ${X_i}$
is a vector of control variables that includes years of schooling (as a continuous variable), dummy variables indicating the veteran’s rank in the army, dummy variables for marital status (married spouse present, married spouse absent, separated, divorced, widowed, never married), fixed effects for state of birth (country if born outside the United States), fixed effects for state of residence in 1940, and a quadratic in age. I divide veterans into three separate ranks: commissioned officers (2nd lieutenants, 1st lieutenants, captains, majors, and colonels), enlisted ranks (privates, corporals, and sergeants), and specialist ranks (band leaders, buglers, cooks, farriers, mechanics, musicians, saddlers, and wagoners) and control for dummy variables for enlisted and specialist ranks, omitting the variable for commissioned officers. Finally,
${X_i}$
is a vector of control variables that includes years of schooling (as a continuous variable), dummy variables indicating the veteran’s rank in the army, dummy variables for marital status (married spouse present, married spouse absent, separated, divorced, widowed, never married), fixed effects for state of birth (country if born outside the United States), fixed effects for state of residence in 1940, and a quadratic in age. I divide veterans into three separate ranks: commissioned officers (2nd lieutenants, 1st lieutenants, captains, majors, and colonels), enlisted ranks (privates, corporals, and sergeants), and specialist ranks (band leaders, buglers, cooks, farriers, mechanics, musicians, saddlers, and wagoners) and control for dummy variables for enlisted and specialist ranks, omitting the variable for commissioned officers. Finally,
 ${\varepsilon _i}$
is the error term and standard errors are clustered at the occupation level.Footnote
9
${\varepsilon _i}$
is the error term and standard errors are clustered at the occupation level.Footnote
9
In equation (1) the coefficient
 ${\beta _3}$
estimates the effect of being both wounded in action and disabled when discharged on labor market outcomes. If being both wounded in action and disabled at discharge is as good as randomly determined, then
${\beta _3}$
estimates the effect of being both wounded in action and disabled when discharged on labor market outcomes. If being both wounded in action and disabled at discharge is as good as randomly determined, then
 ${\beta _3}$
measures the causal effect of this occurring to a veteran. Accordingly, it will pick up any effect that disabled and wounded veterans might receive due to their eligibility for or participation in the rehabilitation program. It will also pick up any other effects of being both wounded and disabled that is not accounted for in the independent effects
${\beta _3}$
measures the causal effect of this occurring to a veteran. Accordingly, it will pick up any effect that disabled and wounded veterans might receive due to their eligibility for or participation in the rehabilitation program. It will also pick up any other effects of being both wounded and disabled that is not accounted for in the independent effects
 ${\beta _1}$
and
${\beta _1}$
and
 ${\beta _2}$
. Stronger identifying assumptions are required for
${\beta _2}$
. Stronger identifying assumptions are required for
 ${\beta _3}$
to be interpreted as the causal impact of being eligible for the rehabilitation program. These assumptions are discussed in the “Results” section.
${\beta _3}$
to be interpreted as the causal impact of being eligible for the rehabilitation program. These assumptions are discussed in the “Results” section.
To provide some evidence in support of the random assignment assumption I run a descriptive regression where the dependent variable is a dummy that takes a value of one if the veteran was both wounded and disabled. This regression is displayed in table 5. It appears that age, years of schooling, and birthplace do not predict being both wounded and disabled.Footnote 10 Unsurprisingly, veterans that had a specialist rank (band leaders, buglers, cooks, farriers, mechanics, musicians, saddlers, and wagoners) were less likely to be both wounded and disabled relative to veterans that were commissioned officers. While far from conclusive, table 5 offers suggestive support for the assumption that being both wounded and disabled is as good as randomly determined.
Table 5. The likelihood of being wounded and disabled

Sources: Data are from the 1940 US Census (age, years of schooling, birthplace) and the Abstracts of World War I Military Service (military service information), which were accessed from the Missouri Digital Heritage Collection (2020).
Notes: This table provides estimates from a descriptive regression where a dummy variable for being both wounded and disabled is the dependent variable. The omitted age category is veterans that were 40 years or older in 1920 and the omitted rank category are veterans that were commissioned officers. Standard errors are robust to heteroskedasticity. See text for more details on the dependent and independent variables of interest.
*p < 0.1; **p < 0.05; ***p < 0.01.
Equation (1) is my preferred specification because it allows me to utilize the entire sample of linked Missouri veterans. Nevertheless, it is also valuable to examine the impact of rehabilitation on veterans that were rehabilitated. The following empirical specification uses the subsample of veterans for which I have rehabilitation data:
 $$\matrix{
{outcom{e_i} = {\beta _1}wounde{d_i} + {\beta _2}disable{d_i} + {\beta _3}rehabilitate{d_i}} \cr
{ + {\beta _4}wounde{d_i} \times disable{d_i} + {\beta _5}wounde{d_i} \times rehabilitate{d_i}} \cr
{ + {\beta _6}disable{d_i} \times rehabilitate{d_i} + {\beta _7}wounde{d_i} \times disable{d_i}} \cr
{ \times {\mkern 1mu} rehabilitate{d_i} + {{\bf{\Gamma }}^\prime }{{\boldsymbol{X}}_{\boldsymbol{i}}} + {\varepsilon _i}} \cr
} $$
$$\matrix{
{outcom{e_i} = {\beta _1}wounde{d_i} + {\beta _2}disable{d_i} + {\beta _3}rehabilitate{d_i}} \cr
{ + {\beta _4}wounde{d_i} \times disable{d_i} + {\beta _5}wounde{d_i} \times rehabilitate{d_i}} \cr
{ + {\beta _6}disable{d_i} \times rehabilitate{d_i} + {\beta _7}wounde{d_i} \times disable{d_i}} \cr
{ \times {\mkern 1mu} rehabilitate{d_i} + {{\bf{\Gamma }}^\prime }{{\boldsymbol{X}}_{\boldsymbol{i}}} + {\varepsilon _i}} \cr
} $$
Equation (2) is similar to equation (1), but now contains a complete triple interaction if a veteran was wounded, disabled, and rehabilitated.
 ${\beta _3}$
measures the effect of participating in the rehabilitation program for veterans that were not wounded and not disabled. Similarly,
${\beta _3}$
measures the effect of participating in the rehabilitation program for veterans that were not wounded and not disabled. Similarly,
 ${\beta _5}$
measures the effect of participating in the program for wounded veterans,
${\beta _5}$
measures the effect of participating in the program for wounded veterans,
 ${\beta _6}$
measures the effect of participation for disabled veterans, and
${\beta _6}$
measures the effect of participation for disabled veterans, and
 ${\beta _7}$
measures any differential impact participation in the rehabilitation program had on veterans that were both wounded and disabled. Note that these effects include any impact the program had on veterans along with any selection effect from veterans choosing to participate in the program. Put differently, these coefficients measure the effect of the program only if the veterans that participated in the program were as good as randomly selected. While this assumption is unlikely to hold, if equation (2) is simply viewed as a descriptive regression, it can inform us if veterans that participated in the program had better outcomes.Footnote
11
${\beta _7}$
measures any differential impact participation in the rehabilitation program had on veterans that were both wounded and disabled. Note that these effects include any impact the program had on veterans along with any selection effect from veterans choosing to participate in the program. Put differently, these coefficients measure the effect of the program only if the veterans that participated in the program were as good as randomly selected. While this assumption is unlikely to hold, if equation (2) is simply viewed as a descriptive regression, it can inform us if veterans that participated in the program had better outcomes.Footnote
11
Results
Results from estimating equation (1) are presented in table 6. Column (1) uses a dummy for whether a veteran was in the labor force as the dependent variable. Veterans that were wounded in action, but not disabled at discharge, had lower probabilities of being in the labor force. The same holds true for veterans that were disabled at discharge but not wounded in action. However, veterans that were both wounded and disabled were about 3 percentage points more likely to be in the labor force.
Table 6. Long-run outcomes for disabled and wounded veterans

Sources: Data are from the 1940 US Census (labor market outcomes and years of schooling) and the Abstracts of World War I Military Service (military service information), which were accessed from the Missouri Digital Heritage Collection (2020).
Notes: This table displays estimates for equation (1) in the text. All columns control for years of schooling (as a continuous variable), a dummy variable if a veteran was part of the enlisted ranks (corporals, privates, and sergeants), a dummy variable if a veteran was part of the specialist ranks (band leaders, buglers, cooks, farriers, mechanics, musicians, saddlers, and wagoners), dummy variables for marital status (married spouse present, married spouse absent, separated, divorced, widowed, and never married), fixed effects for birth state (or country if born outside United States), fixed effects for state of residence in 1940, and a quadratic in age. Standard errors are clustered at the occupation level. See text for more details on the dependent and independent variables of interest.
*p < 0.1; **p < 0.05; ***p < 0.01.
Column (2) uses the log of veterans’ weekly wages as the dependent variable. The 1940 census only records income for wage workers and not for self-employed workers. Accordingly, I define weekly wages as a veteran’s yearly income (in 1939) divided by the number of weeks they reported working (in 1939). I do this for wage workers that worked 30 weeks or more in a year.Footnote 12 Census enumerators were, also, instructed to code any wage worker with an annual income more than $5,000 as having an income of $5,000. This practice was not universally followed as there are many veterans for whom yearly income is more than $5,000. I follow Acemoglu and Angrist (2000) and censor weekly wages at the 98th percentile. Weekly wages above the 98th percentile are replaced with 1.5 times the 98th percentile wage.Footnote 13 Thus, column (2) is conditional on being a wage worker and working 30 or more weeks in a year. Being wounded in action but not disabled at discharge, and vice versa, resulted in significantly lower weekly wages. However, being both wounded and disabled increased weekly wages by about 13 percent.
Columns (3) and (4) use Collins and Wanamaker’s (Reference Collins and Wanamaker2017) measure of constructed income for the dependent variable. Column (3) repeats the specification in column (2), while column (4) expands the sample to include all veterans for which I was able to construct an income score. Column (4), therefore, includes self-employed workers, farmers, and veterans that worked less than 30 weeks in a year. In both columns, being disabled at discharge significantly decreases the constructed income score, while being both wounded and disabled increases the constructed income score by about 5 percent.
Columns (5) and (6) use OCC scores as the dependent variable. Column (5) repeats the specification in column (2), while column (6) expands the sample to include all veterans that have an OCC score. Disabled veterans have significantly lower OCC scores, but there is no significant effect for veterans that were both wounded and disabled. Finally, columns (7) and (8) use occupational categories as the dependent variable. Column (7) shows that veterans that were both wounded in action and disabled at discharge were significantly less likely to be laborers, occupations that usually commanded lower wages and status. Column (8) shows that veterans that were both wounded and disabled were significantly more likely to be white-collar workers, which normally commanded higher wages and status.
Table 6 demonstrates that veterans that were either wounded in action or disabled at discharge, but not both, had significantly worse labor market outcomes than their nonwounded, nondisabled peers (
 ${\beta _1}$
and
${\beta _1}$
and
 ${\beta _2}$
). In contrast, veterans that were both wounded in action and disabled at discharge had significantly better labor market outcomes (
${\beta _2}$
). In contrast, veterans that were both wounded in action and disabled at discharge had significantly better labor market outcomes (
 ${\beta _3}$
).
${\beta _3}$
).
Can this positive effect be attributed to the high percentage of wounded and disabled veterans that were eligible for and participated in the rehabilitation program? Additional identifying assumptions, besides random assignment, are needed to attribute the entire magnitude of the coefficient to rehabilitation eligibility. In particular, assume (1) that all veterans that were both wounded and disabled were eligible for the rehabilitation program and (2) that after accounting for the independent effects of being wounded or disabled (
 ${\beta _1}$
and
${\beta _1}$
and
 ${\beta _2}$
), the only impact that being both wounded and disabled had on long-run outcomes was through rehabilitation eligibility.Footnote
14
If these assumptions, including random assignment, hold then the coefficient
${\beta _2}$
), the only impact that being both wounded and disabled had on long-run outcomes was through rehabilitation eligibility.Footnote
14
If these assumptions, including random assignment, hold then the coefficient
 ${\beta _3}$
can be interpreted as the effect, for wounded and disabled veterans, of being eligible for the rehabilitation program.
${\beta _3}$
can be interpreted as the effect, for wounded and disabled veterans, of being eligible for the rehabilitation program.
Assumption (1) in the preceding paragraph is likely to hold. Because all veterans that participated in the rehabilitation program had to be eligible for it (by definition), the minimum percentage of wounded and disabled veterans that were eligible for the program was 70 percent (table 3). In addition, about half those who were deemed eligible for the rehabilitation program participated in it (180,000 joined the program out of the 337,000 that were eligible). The fact that more than half of the veterans that were both wounded and disabled participated in the program, coupled with the information on the criteria for eligibility presented in the “Historical Background” section, supports the first assumption. Assumption (2) in the preceding paragraph is, unfortunately, untestable. However, even if assumption (2) does not hold, it is possible that some portion of the positive effect of being both wounded in action and disabled when discharged is due to the rehabilitation program.
Results from estimating equation (2) are presented in table 7, which is set up analogously to table 6. The number of observations in table 7 is considerably less than in table 6 and, accordingly, the estimates are less precise. This is because it is only possible to estimate equation (2) on veterans for which I collected rehabilitation data. Nevertheless, several trends are noticeable. First, and consistent with table 6, veterans that were either wounded in action or disabled at discharge, but not both, have worse labor market outcomes with significant coefficients in a few instances (
 ${\beta _1}$
and
${\beta _1}$
and
 ${\beta _2}$
). Second, veterans that were either wounded or disabled and rehabilitated saw improved labor market outcomes, with the coefficients being significant in a number of cases (
${\beta _2}$
). Second, veterans that were either wounded or disabled and rehabilitated saw improved labor market outcomes, with the coefficients being significant in a number of cases (
 ${\beta _5}$
and
${\beta _5}$
and
 ${\beta _6}$
). Finally, the estimates for the triple interaction are extremely noisy, but they show that veterans that were both wounded in action and disabled at discharge did not experience a differential impact from being rehabilitated (
${\beta _6}$
). Finally, the estimates for the triple interaction are extremely noisy, but they show that veterans that were both wounded in action and disabled at discharge did not experience a differential impact from being rehabilitated (
 ${\beta _7}$
). This is not inconsistent with the results in table 6 as veterans that were wounded in action, disabled at discharge, and rehabilitated still receive the positive effect of being wounded and rehabilitated (
${\beta _7}$
). This is not inconsistent with the results in table 6 as veterans that were wounded in action, disabled at discharge, and rehabilitated still receive the positive effect of being wounded and rehabilitated (
 ${\beta _5}$
) and disabled and rehabilitated (
${\beta _5}$
) and disabled and rehabilitated (
 ${\beta _6}$
).
${\beta _6}$
).
Table 7. Long-run outcomes for disabled, wounded, and rehabilitated veterans

Sources: Data are from the 1940 US Census (labor market outcomes and years of schooling) and the Abstracts of World War I Military Service (military service information), which were accessed from the Missouri Digital Heritage Collection (2020). The rehabilitation information is from the United States Veterans Administration Master Index, 1917–1940 provided by FamilySearch (2020).
Notes: This table displays estimates for equation (2) in the text. All columns control for years of schooling (as a continuous variable), a dummy variable if a veteran was part of the enlisted ranks (corporals, privates, and sergeants), a dummy variable if a veteran was part of the specialist ranks (band leaders, buglers, cooks, farriers, mechanics, musicians, saddlers, and wagoners), dummy variables for marital status (married spouse present, married spouse absent, separated, divorced, widowed, and never married), fixed effects for birth state (or country if born outside United States), fixed effects for state of residence in 1940, and a quadratic in age. Standard errors are clustered at the occupation level. See text for more details on the dependent and independent variables of interest.
*p < 0.1; **p < 0.05; ***p < 0.01.
As mentioned in the “Empirical Methodology” section, the coefficients
 ${\beta _3}$
,
${\beta _3}$
,
 ${\beta _5}$
,
${\beta _5}$
,
 ${\beta _6}$
, and
${\beta _6}$
, and
 ${\beta _7}$
include any effect the program had on veterans along with any selection effect from veterans choosing to participate in the program. Despite not being able to disentangle the rehabilitation effect from the selection effect, the results in table 7 are encouraging. In particular, veterans that were wounded or disabled and participated in the rehabilitation program appear to have improved labor market outcomes.
${\beta _7}$
include any effect the program had on veterans along with any selection effect from veterans choosing to participate in the program. Despite not being able to disentangle the rehabilitation effect from the selection effect, the results in table 7 are encouraging. In particular, veterans that were wounded or disabled and participated in the rehabilitation program appear to have improved labor market outcomes.
Conclusion
This article examined the impact of vocational rehabilitation on the labor market outcomes of wounded and disabled World War I veterans from the state of Missouri. To do this, I constructed a new dataset that contains information on World War I veterans’ military service, rehabilitation status, and long-run labor market outcomes. I find that veterans that were both wounded and disabled were, by far, the most likely to be eligible for, and participate in, the rehabilitation program. I conclude that rehabilitation was likely successful based on two pieces of evidence. First, veterans that were both wounded and disabled had improved labor market outcomes. Second, for the subset of veterans for which I have actual rehabilitation data, it appears that rehabilitation improved labor market outcomes for wounded and disabled veterans relative to their peers that were not rehabilitated.
There are two important conclusions that can be drawn from this article. First, veterans’ wartime experiences matter. In particular, the results from this article demonstrate that wartime experiences can result in large differences in labor market outcomes for veterans that fought in the same war. This extends the previous literature that focused on the return to military service without paying much attention to heterogenous wartime experiences. Second, this article demonstrates that rehabilitation programs can be effective at returning wounded and disabled veterans to some semblance of a normal life. If the estimates in table 6 are taken seriously then the program appears to have been incredibly successful at returning veterans that were both wounded and disabled to gainful employment. In particular, veterans that were both wounded and disabled ended up having labor market outcomes similar to their nonwounded, nondisabled peers (the linear combination of coefficients
 ${\beta _1}$
,
${\beta _1}$
,
 ${\beta _2}$
, and
${\beta _2}$
, and
 ${\beta _3}$
in table 6).
${\beta _3}$
in table 6).
A full cost-benefit analysis of the World War I vocational rehabilitation program is beyond the scope of this article. However, it is possible to get an estimate of the total benefits of the program through a back of the envelop calculation. The average rehabilitated veteran in my sample had a weekly wage of $31 in 1940 and worked 43 weeks. Assume, based on table 6, that veterans that were both wounded and disabled would have had weekly wages that were 13 percent lower in the absence of the rehabilitation program. Applying this estimate to the 129,000 veterans that completed the program reveals that the benefit of the program was about $22 million in 1940.Footnote 15 Dillingham (Reference Dillingham1952) estimates the cost of the program, without stipends (which would have been paid in the absence of the program), at $135 million. Adjusting the yearly cost of the program for inflation means that the program would have cost around $110 million in 1940.Footnote 16 Thus, rehabilitated veterans would need to receive labor market benefits for about 5 years to recuperate the entire costs of the program. Most veterans likely exceeded this 5-year criterion because they were fairly young when they were rehabilitated.
Acknowledgments
I am grateful to Werner Troesken, Brian Beach, Dan Berkowitz, Ann Carlos, Karen Clay, Daniel Jones, Terra McKinnish, Martin Saavedra, Allison Shertzer, Tate Twinam, and Randy Walsh for helpful comments. I would also like to thank Katharine Starr and Jacob Wolfgram for their excellent research assistance.


