


Introduction
In the nineteenth century, Victoria was a growing British colony in the southeast corner of the Australian land mass. The massive gold rush in the early 1850s, encouraged by the success of the gold rush to California in 1849, added hundreds of thousands of miners and settlers to its population. In the course of this demographic explosion and accompanying socioeconomic developments, the mortality profile of the region changed. Meanwhile, in 1853 the Victorian colonial government adopted a version of William Farr’s nosology index for the recording causes of death, becoming one of the first places outside of the United Kingdom to do so. The resulting historical record has facilitated the observation of many unusual patterns in mortality, one of which we examine here.
This article discusses an observed synchrony between measles and scarlet fever in the Australian colony and subsequently the state of Victoria from 1853 through 1876, and an absence of synchrony thereafter. We begin with this pattern (described in the following text), discovered through the analysis of mortality data from the Victorian Registrar General’s reports. We evaluate the available evidence to determine whether an artifactual explanation (misdiagnosis) is sufficient to explain the pattern. After ruling out this alternative as unlikely, we provide support for a plausible biological explanation for the synergistic pattern using recently published epidemiological and immunological research demonstrating the phenomenon of measles-induced immune modulation in the form of both temporary immunosuppression and lasting immune memory loss (“immune amnesia”). We then consider possible explanations for the end of the synchronous pattern after 1876, examining the changing social, demographic, and economic context. We discount new direct medical interventions or a change in case definition as probable explanations for the end of the synchrony, and instead point to either a change in group A Streptococcus (GAS) type or loss of the bacteriophage (a bacteria-infecting virus) leading to a loss of virulence in the scarlet fever pathogen (S. pyogenes), coinciding with the end of the scarlet fever pandemic in other Western countries.
Numerous authors have argued for a change in group A Streptococcus biology in the nineteenth century as a proximal explanation for the rise of the scarlet fever pandemic and its sudden end prior to medical intervention (see Gaworewska and Colman Reference Gaworzewska and Colman1988; Hardy Reference Hardy1993; Mathews Reference Mathews and Sriprakash2005; McKeown Reference McKeown1976; Musser et al. Reference Musser, Kapur, Kanjilal, Shah, Musher, Barg, Johnston, Schlievert, Henrichsen, Gerlach, Rakita, Tanna, Cookson and Huang1993; Swedlund and Donta Reference Swedlund, Donta, Herring and Swedlund2003), opening up questions about the broader causes of such biological changes. Furthermore, previous historical work in Britain and the United States has identified associations between various “childhood” diseases, particularly the “traditional pairing” of measles and pertussis (Woods and Shelton Reference Woods and Shelton1997: 77; see for example Coleman Reference Coleman2015; Hardy Reference Hardy1993; Noori and Rohani Reference Noori and Rohani2019). Woods and Shelton (Reference Woods and Shelton1997: 89) show that for early childhood mortality in England and Wales in the 1860s, after pertussis, measles was most closely associated with scarlet fever. However, such work has often focused on the diseases sharing age profiles (Woods and Shelton Reference Woods and Shelton1997) and the effects of poor nutrition exacerbated by successive infections (Hardy Reference Hardy1993). These patterns have not yet been considered in relation to the recently published evidence for measles-induced immune modulation, which has the potential to contribute substantially to our understanding of these relationships.
We suggest that the pattern of measles and scarlet fever mortality examined here likely emerged at least in part due to the particular demographic and socioeconomic context of the Victorian gold-mining boom in the 1850s to 1870s. The rapid population increase without adequate infrastructure, combined with an increased proportion and absolute number of young children, may have created conditions not only for a heavy burden of such diseases operating independently but also for a synchronous relationship with measles that may have increased susceptibility to scarlet fever particularly and resulted in more severe disease outcomes—including increased scarlet fever mortality. This pattern ended when fertility and mortality later declined and crowded, makeshift housing conditions eased as infrastructure began to catch up with the increased population. This analysis thus contributes a new perspective to the historical literature on nineteenth-century infectious disease patterns, specifically the scarlet fever pandemic and the interactions between measles and other diseases, highlighting the role of social conditions in disease evolution.
Sources and Methods
Mortality records for this article come from the Victorian Registrar General’s reports created from issued death certificates. To produce cause-specific mortality rates the first author (PR) combined the Registrar General’s reports’ descriptions of causes of death with the annual population estimations published in the Victorian Parliamentary Papers and colony/state censuses. PR assessed the extent of correlation and, looking at all the bivariate correlations, found a way to focus on those appearing most important. Following this, PR and second author HB undertook a process of elimination to consider potential explanations for the apparent synergy between the scarlet fever/scarlatina and measles diagnoses. The consideration of these potential explanations resulted in additional analyses and we will present the methods associated with these concurrently.
The Pattern
Figure 1 shows four apparent major epidemics of scarlet fever/scarlatina in Victoria from 1853 to 1876 (which had peak mortality in 1853, 1860–62, 1866–68, and 1875–76), synchronized closely with recorded deaths by measles in that period. Measles epidemics still occurred in 1880, 1884, 1893, and 1898 but epidemic scarlet fever/scarlatina mortality was no longer accompanied by the measles epidemics after 1876. Crude mortality rates and annual reported deaths for the measles and scarlet fever/scarlatina diagnoses are presented in Appendix A.
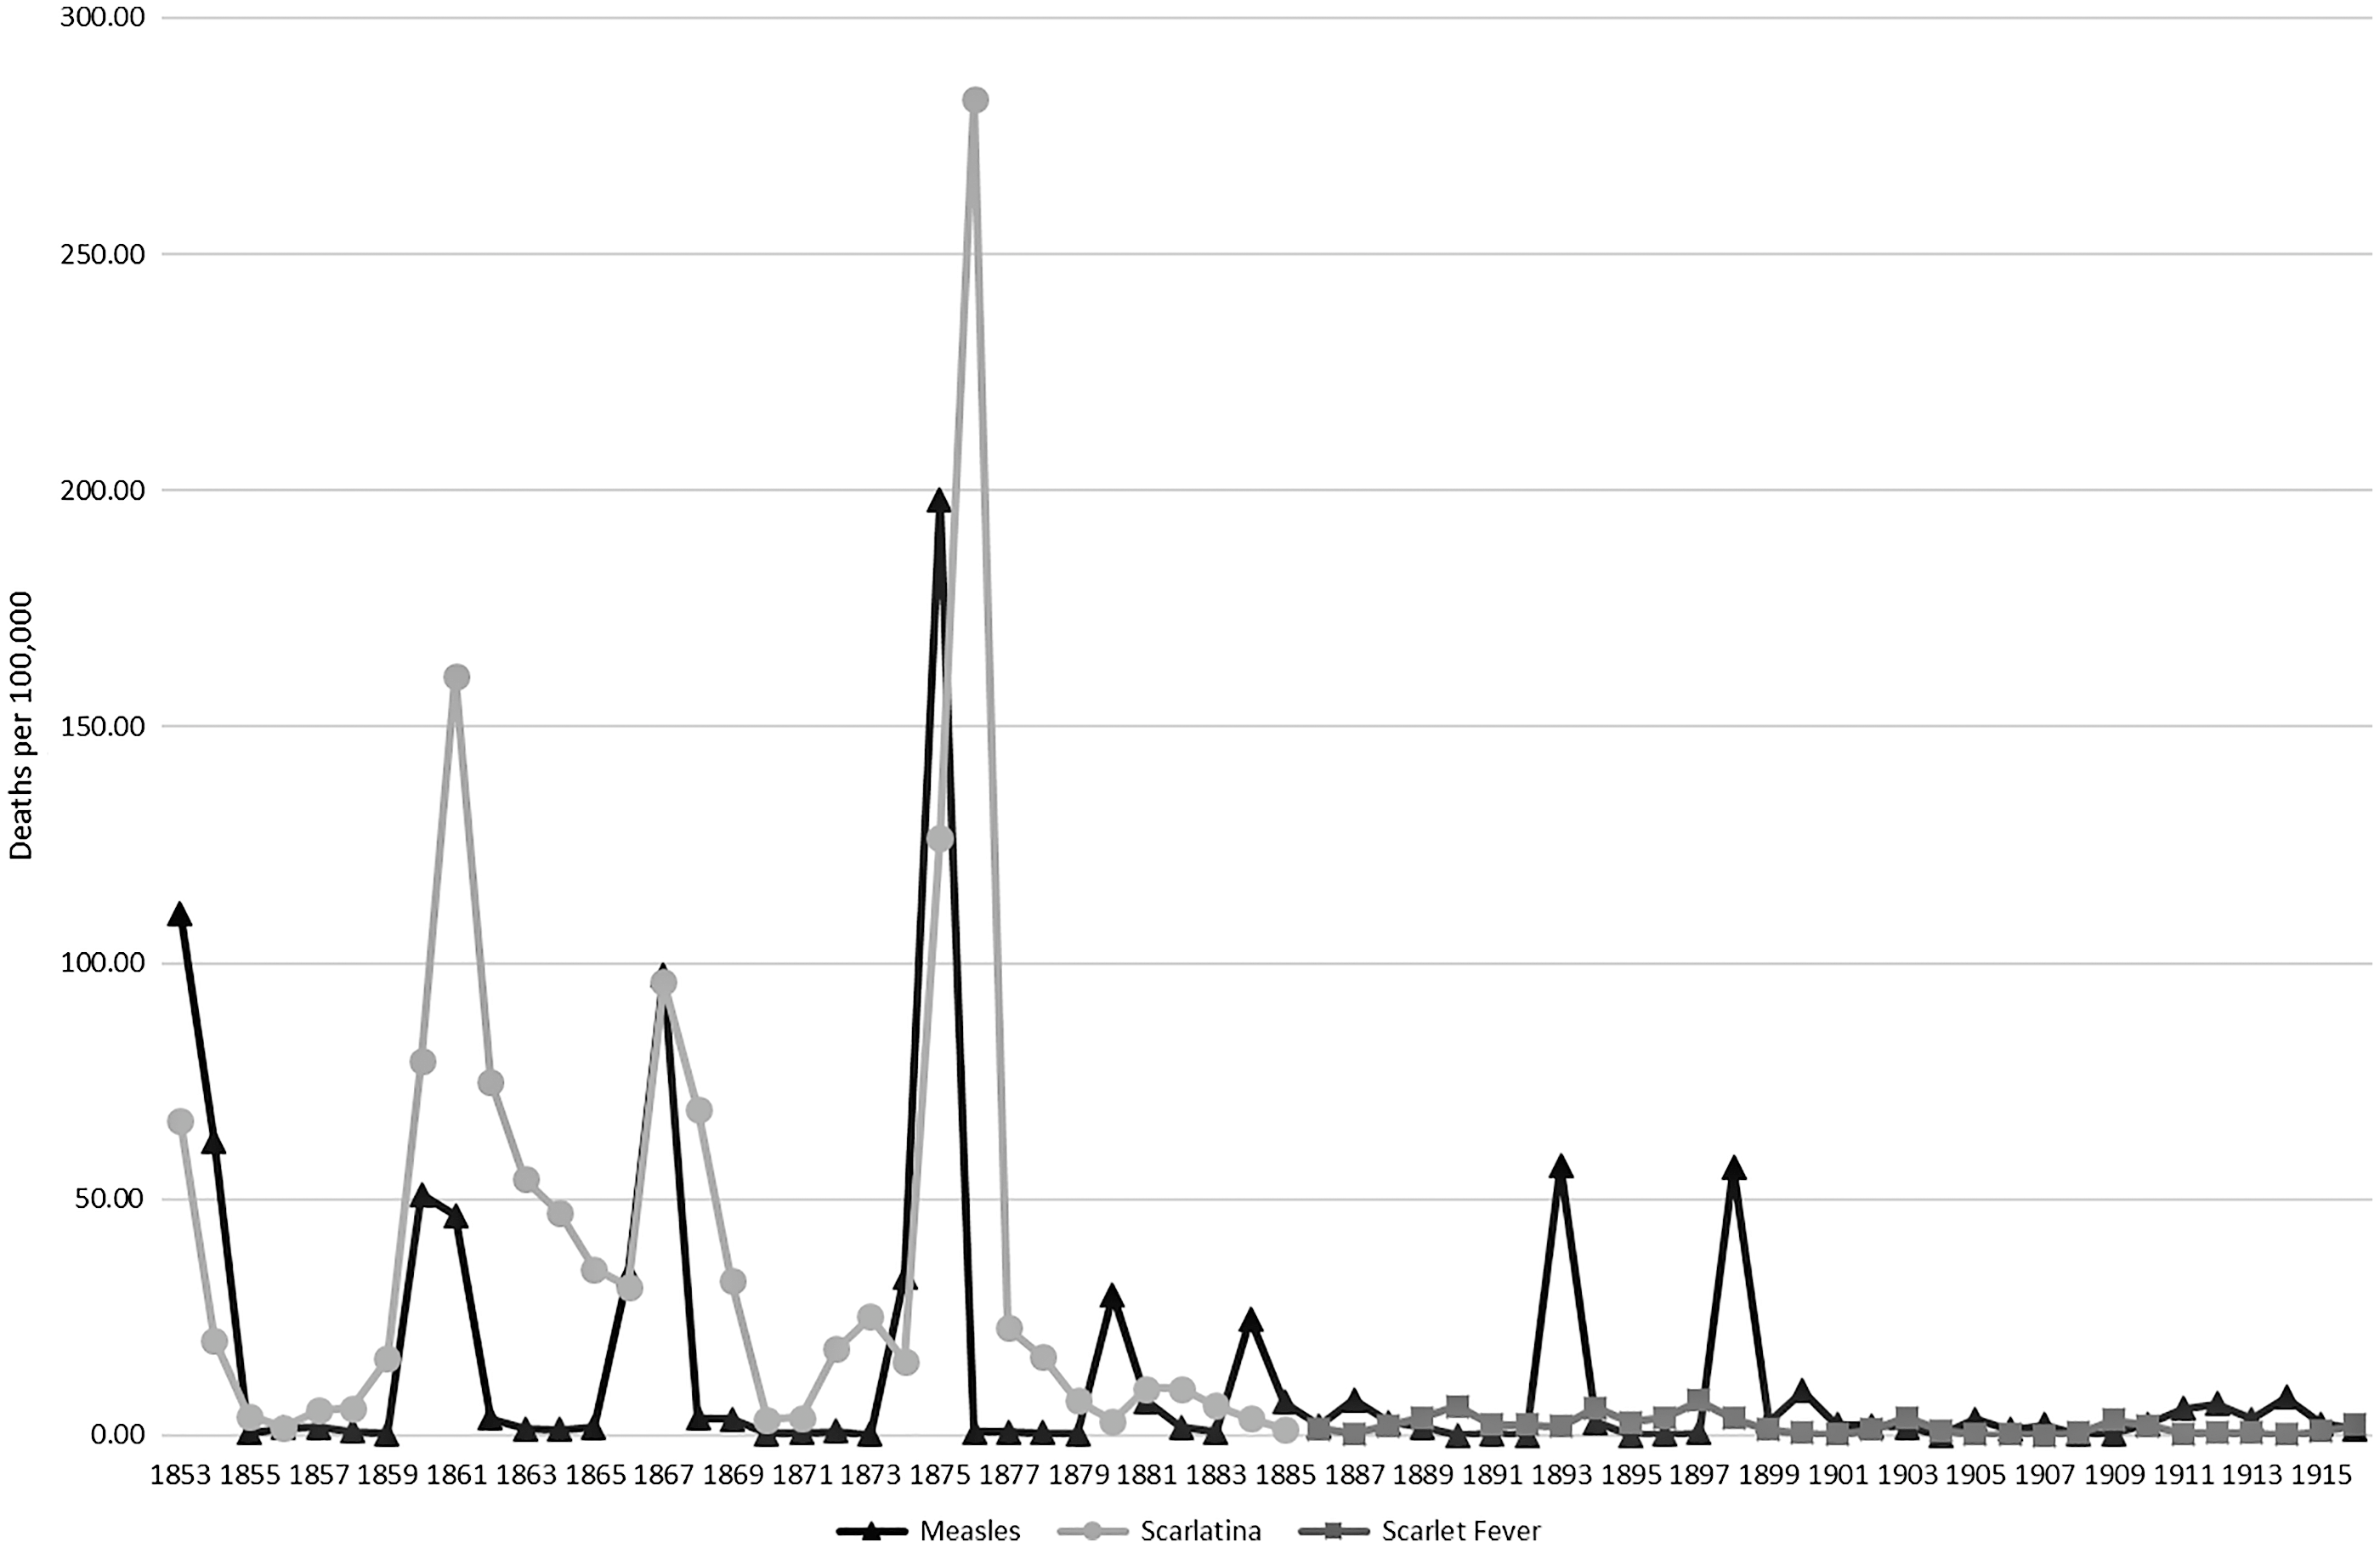
Figure 1. Scarlet fever versus measles mortality in Victoria 1853 to 1916 per 100,000 living population. Calculated from Victorian Registrar General’s Reports.
This graph raises a number of questions, the first of which is whether the results are a product of a “real” biological reality or an artifact of recording methods. Additional questions arise about the demographic profile of the population, socioeconomic context, and other observations of disease synergies. Not all these questions can be fully answered with the data available from this period. In this article we weigh the available evidence and argue for the mostly likely underlying cause of these mortality patterns.
Current Understanding of Measles and Group a Streptococcus
The measles virus is one of the most contagious microbes known to infect humans. It is an RNA virus in the Paramyxoviridae family spread person to person through respiratory droplets. It is thought to have diverged from the rinderpest virus, which infects cattle, after the advent of the Neolithic—with recent research suggesting a divergence date as late as the eleventh to twelfth centuries (Furuse et al. Reference Furuse, Suzuki and Oshitani2010). Measles mortality is typically due to respiratory or neurologic complications (Barkin Reference Barkin1975). Its effects include suppression of the host’s immune response that can last well beyond the active measles infection, from weeks to years (Mina et al. Reference Mina, Metcalf, Swart, Osterhaus and Grenfell2015). The specific elements of measles-induced immune modulation include reducing a person’s antibody memory to past infections (Mina et al. Reference Mina, Kula, Leng, Li, de Vries, Knip, Siljander, Rewers, Choy, Wilson, Larman, Nelson, Griffin, de Swart and Elledge2019), and a depletion of B cells, which generate antibodies (Petrova et al. Reference Petrova, Sawatsky, Han, Laksono, Walz, Parker, Pieper, Anderson, de Vries, Lanzavecchia, Kellam, von Messling, de Swart and Russell2019). Thus, the current literature demonstrates that the presence of measles has the potential to increase morbidity and mortality of other infectious diseases such as scarlet fever.
Scarlet fever, also once known as “scarlatina,” is caused by Streptococcus pyogenes, one of the most common pathogenic bacteria that infect humans.Footnote 1 In Victoria, the Registrar General used “scarlatina” until 1885 and “scarlet fever” thereafter. This was part of a refinement in 1886 of the cause of death classifications used by the Victorian Registrar General, which mostly followed changes in British nosology of the time.Footnote 2 The Streptococcus genus diversified greatly after the adoption of agriculture by its human host (Mathews Reference Mathews and Sriprakash2005), and the structure of S. pyogenes has been researched extensively. The strep bacterium has a protein (M) that takes different forms, and these differences can account for variation in the virulence and manifestation of the disease (Walker et al. Reference Walker, Barnett, McArthur, Cole, Gillen, Henningham, Sriprakash, Sanderson-Smith and Nizhet2014). Therefore, M-typing has been useful, and a change in the frequency of different types of GAS diseases over time could signal a change in the dominant circulating M-type.Footnote 3
Historically, group A strep infections were categorized by the location within the body, but the disease effects are not limited to the initial site of infection. For example, the body’s immune response to a pharyngeal (throat) or skin infection can lead to inflammation in the kidneys (post-streptococcal glomerulonephritis) (Wilks et al. Reference Wilks, Farrington and Rubenstein1995: 171). Other sequelae to group A strep infections such as scarlet fever and strep throat include acute rheumatic fever and rheumatic heart disease (U.S. National Library of Medicine 2020).
As well as variation in disease manifestation due to different M-types, the presence or absence of bacteriophages also plays a role. Bacteriophages are viruses that infect bacteria, and in some cases cause those bacteria to produce toxins. True scarlet fever is caused by the effects of pyrogenic exotoxins secreted by the infected Streptococcus. Of these, Exotoxin A is best studied; it is produced when the bacteriophage T12 infects the bacteria (McShan and Ferretti Reference McShan and Ferretti1997). Thus, both shifts in M-types and gain or loss of the bacteriophage are key determinants of changes in scarlet fever virulence.
While the propensity for bacterial infections to follow viral ones is well known, as are measles’s particular immunosuppressive effects (see de Vries et al. Reference de Vries, McQuaid, Amerongen, Yüksel, Verburg, Osterhaus, Duprex and Swart2012; Hahm Reference Hahm, Griffin and Oldstone2009; Karp et al. Reference Karp, Wysocka, Wahl, Ahearn, Cuomo, Sherry, Trinchieri and Griffin1996; Schneider-Schaulies and Schneider-Schaulies Reference Schneider-Schaulies, Schneider-Schaulies, Griffin and Oldstone2009), to our knowledge epidemic synchrony between measles and scarlet fever has not been previously identified. There has been some debate over whether common childhood infectious diseases, including measles and scarlet fever, have operated independently. For example, Coleman’s (Reference Coleman2015) examination of average measles and pertussis (whooping cough) incidence rates in the United States in the mid-twentieth century found that their incidences were positively associated, and that pertussis peaks lagged measles peaks by three to four weeks. Coleman argues that this pattern can be explained by measles-induced immunosuppression in combination with other factors; for example, both diseases target the respiratory epithelium and affect children at a similar age. Using model-based interference applied to historical weekly records of morbidity and mortality in London (England), Noori and Rohani (Reference Noori and Rohani2019) similarly found support for the link between measles infection and pertussis morbidity and mortality, but variable magnitude estimates. They note that the inconsistency in their findings might reflect variability in the effects of measles infection related to factors such as age and/or the need for additional models; their study did not account for loss of previous immunity to pertussis following measles infection (ibid. 2019: 7). Rohani et al.’s (Reference Rohani, Green, Mantilla-Beniers and Grenfell2003) modeling also suggests that other factors, such as the birth rate, can affect whether measles and pertussis co-occur; they found that when the birth rate was low, the two diseases peaked in the same year, whereas when the birth rate was high, they peaked in alternating years.
Coleman (Reference Coleman2016) similarly argues for a relationship between scarlet fever and another viral childhood disease, varicella (chickenpox). Work by Smallman-Raynor and Cliff (Reference Smallman-Raynor and Cliff2013) using data from English public boarding schools in the 1930s suggests that the major common childhood infectious diseases operated largely independently, with little interaction in either cause or consequence. However, they note that this finding might be due to some confounding factor such as a lack of cocirculation of certain pathogens in these semiisolated populations (ibid. 2013: 344). Furthermore, as their study only included school-aged children, this might not hold when younger children are considered (Coleman Reference Coleman2015).
The mid-nineteenth-century scarlet fever pandemic is considered to have occurred between the 1820s and 1880s (Parish Reference Parish2004; Swedlund and Donta Reference Swedlund, Donta, Herring and Swedlund2003), with some variation by location. For England, Creighton (Reference Creighton1894: 726) gives 1839–40 as the date of the first major scarlatina (scarlet fever) epidemic there, and the last big epidemic year as 1874. With registrations of deaths beginning in the then-colony in 1853 and cause-specific figures printed in the Victorian Registrar General’s reports, there is an opportunity to examine whether mortality patterns and relationships identified elsewhere might also apply in Victoria.
Part 1: Epidemic Synergy, 1853–76
In late 1851 vast resources of gold were discovered in the central-western regions of Victoria. With the legend of the Californian Gold Rush of 1849 fresh in people’s minds, there was a similarly large migration of people into southeastern Australia in 1852 and 1853. In 1853 more than half the colony’s population consisted of new migrants in their first year of settlement (Roberts Reference Roberts2006). This massive influx dramatically overtaxed resources and infrastructure, potentially affecting the at-risk population for certain diseases. At the time of the 1861 census, 39 percent of Victoria’s population was living in temporary dwellings such as tents and drays (Jackson and Bridge Reference Jackson, Bridge and Vamplew1987: 349; see also Butlin Reference Butlin1964: 219–20 for further details of the materials used in these dwellings and changes over time).
Concurrent with the overall increase, the population profile of Victoria changed dramatically over the study period. In the 1850s, men outnumbered women by two to one, single men between the age of 20 and 30 making up a large proportion of the population. Women began migrating to Victoria in larger numbers in the 1860s, and although men still greatly outnumbered women, fertility rates increased and the proportion of children grew (Roberts Reference Roberts2013). With the increase in the child population came an increase in childhood (endemic) diseases and establishment of cyclic epidemic patterns. Despite the relatively small number of women, the highest fertility rates for the period of study were in the early 1860s (see “Part 2: The End of a Synergy”; information on fertility rates from the 1850s is unavailable).
The changing population demographics through this period are reflected in other diseases from the time. Diarrheal diseases were an important cause of death for children, especially in the 1860s with mortality rates often around 3,000 deaths per 100,000 in the under one age group (Roberts, unpublished). This was by far the most common cause of death of children through the period of study. The diphtheria pandemic arrived in Victoria in the late 1850s and would remain important until the end of the century. “Whooping cough” (pertussis) was another frequent descriptor as a cause of death (Roberts Reference Roberts2006, Reference Roberts2013). Quarantine practices in Victoria managed to limit the impact of other infectious diseases such as cholera (Maglen Reference Maglen2005) and while epidemics of influenza occurred in the 1840s and 1890s (Campbell Reference Campbell2002), influenza was not influential in the period between 1853 and 1876 (Roberts Reference Roberts2006, Reference Roberts2013). Measles and scarlet fever, the focus of this study, were not only independently very important threats to children but also showed the strongest epidemic patterns.
When examining results based on historical data, the first potential explanation to consider is whether the observation could be due to misdiagnosis or some other data-collection anomaly. Misdiagnosis must be considered as a potential explanation for the association between “measles” and “scarlet fever” diagnosed deaths, as the two diseases produce a red rash and might superficially appear similar. We reject misdiagnosis as an explanation in this data set for several reasons, detailed in the following text.
Firstly, it is a common untested assumption by modern researchers that nineteenth-century and other historical physicians were less able to diagnose diseases they encountered because they did not have access to the same technology and scientific knowledge as their modern counterparts. However, this may not always have been the case. Indeed, it is very likely that nineteenth-century doctors were, on average, seeing many more cases of measles and scarlet fever than most modern physicians do and would have been very familiar with the differences in the signs and symptoms of the two diseases.
Misdiagnosis with other epidemic diseases is also unlikely. Diphtheria, whooping cough, and typhoid, which had mortality rates similar to measles and scarlet fever in this period, were easily identifiable by their distinctive symptoms. Many of the classical symptoms of scarlet fever were identified as early as the sixteenth century (Rolleston Reference Rolleston1928). John Philip Ingrassias in Naples (1553), Willan (1565) in Lower Germany, and Jean Cottyar (1578) in Poitiers reported on its specific clinical symptoms; they also discussed the occurrence of “dropsy” (edema, which can be related to kidney disease) and arthritis as sequelae of the disease (Rolleston Reference Rolleston1928).Footnote 4 Sydenham’s descriptions of measles and scarlet fever from 1683 also support the long antiquity of doctors being able to differentiate the two diseases from their physical symptoms. He states, “[T]he whole skin [of a patient with scarlet fever] becomes covered with small red maculae, thicker than those of measles, as well as broader, redder and less uniform. These last for two or three days and then disappear. The cuticle peels off, and branny scales remain lying on the surface like meal” (Sydenham 1683, as quoted in Rolleston Reference Rolleston1928: 927).Footnote 5
Historical descriptions of the diagnosis of measles and scarlet fever from the study period support the position that they were clearly distinguished and not routinely misdiagnosed at this time. For example, both Atken and Squire point to the dark red spotted rash of measles compared to the scarlet “efflorescence” of scarlet fever (Aitken Reference Aitken1864: 319), the former preceded by catarrhal symptoms and the latter frequently associated with renal symptoms (Aitken Reference Aitken1864: 304, 319; Squire Reference Squire and Quain1882a: 924, Reference Squire and Quain1882b: 1387).
The data presented in this article are based on mortality, not morbidity, and therefore the diagnoses are likely to be more reliable. While misdiagnosis is possible, even likely, in the early stages of these diseases, as symptoms progress the risk of misdiagnosis reduces. For example, measles does not cause peeling or ulceration of the skin, which scarlet fever does, and measles causes catarrhal reactions in the eyes while scarlet fever does not (Garcia Reference Garcia2010; U.S. National Library of Medicine 2020; Warrack Reference Warrack1918).
Furthermore, the usage of the term “measles” as a cause of death drops to very low number between epidemics, whereas the “scarlet fever” diagnosis rates do not (see figure 1 and Appendix A). This corresponds with the necessary build up of a nonimmune population before a measles epidemic can take place (Bartlett Reference Bartlett1960; Kim-Farley Reference Kim-Farley and Kiple2003: 212), which is thought to be more than 250,000 people (Wilcox and Gubler Reference Wilcox and Gubler2005). The observation of a rapid die out of measles between epidemics in Victoria is supported by the heat mapping presented in figures 2 and 3. Figure 2 shows the dramatic reduction in deaths attributed to “measles” in all age groups following an epidemic. It also shows that—with the exception of the epidemic years 1867, 1874–75, 1880, 1893, and 1898—the diagnosis of measles was rarely given to a person over the age of 10 years, which was not the case for the “scarlet fever” and “scarlatina” diagnoses. After the 1898 epidemic, the frequency of use of “measles” as a diagnosis depicts a more endemic pattern, which is consistent with the behavior of that disease in larger populations.

Figure 2. Specific mortality rates for Age and Year (deaths per 100,000) for deaths described as “Measles,” calculated from the Victorian Registrar General’s Reports as a heat map, 1864 to 1916.

Figure 3. Specific mortality rate for Age and Year (deaths per 100,000) for deaths described as “Scarlet Fever” and “Scarlatina,” calculated from the Victorian Registrar General’s Reports as a heat map, 1864 to 1916.
If there was frequent confusion between the two diagnoses, we should see correlations between them in both epidemic and nonepidemic years. However, table 1 and figure 4 show little correlation in the frequency of diagnosis of the two diagnostic categories outside of the epidemic periods. For example, looking at the ratios of the frequency of diagnosis of scarlet fever/scarlatina versus measles, and vice versa, displayed in table 1, in 1876 the diagnosis of “scarlet fever” was used 448 times more frequently than “measles” but in 1875 the diagnosis of “scarlet fever” was used nearly half as frequently as “measles.” Figure 4 presents a scatter plot of the number deaths per 100,000 given as “measles” and “scarlet fever”/“scarlatina,” yielding a Pearson’s correlation coefficient of only 0.42 and even lower if separate periodization is removed from the analysis.Footnote 6 In nonepidemic years the correlation, while still not significant, improves slightly suggesting that if there is a correlation during nonepidemic years between the two diagnoses it is negative and monotonic.Footnote 7 This causes us to reject the hypothesis that “measles” and “scarlet fever” diagnosis were used as synonyms in the nineteenth century in the study area. Indeed, outside the epidemic years there is very little correlation between the two diagnoses’ usage.
Table 1. Crude mortality rates for “measles” and “scarlet fever”/“scarlatina” (per 100,000) and ratios of number of measles deaths for every “scarlet fever”/“scarlatina” death and vice versa, calculated from Victorian Registrar General’s Reports 1853 to 1916
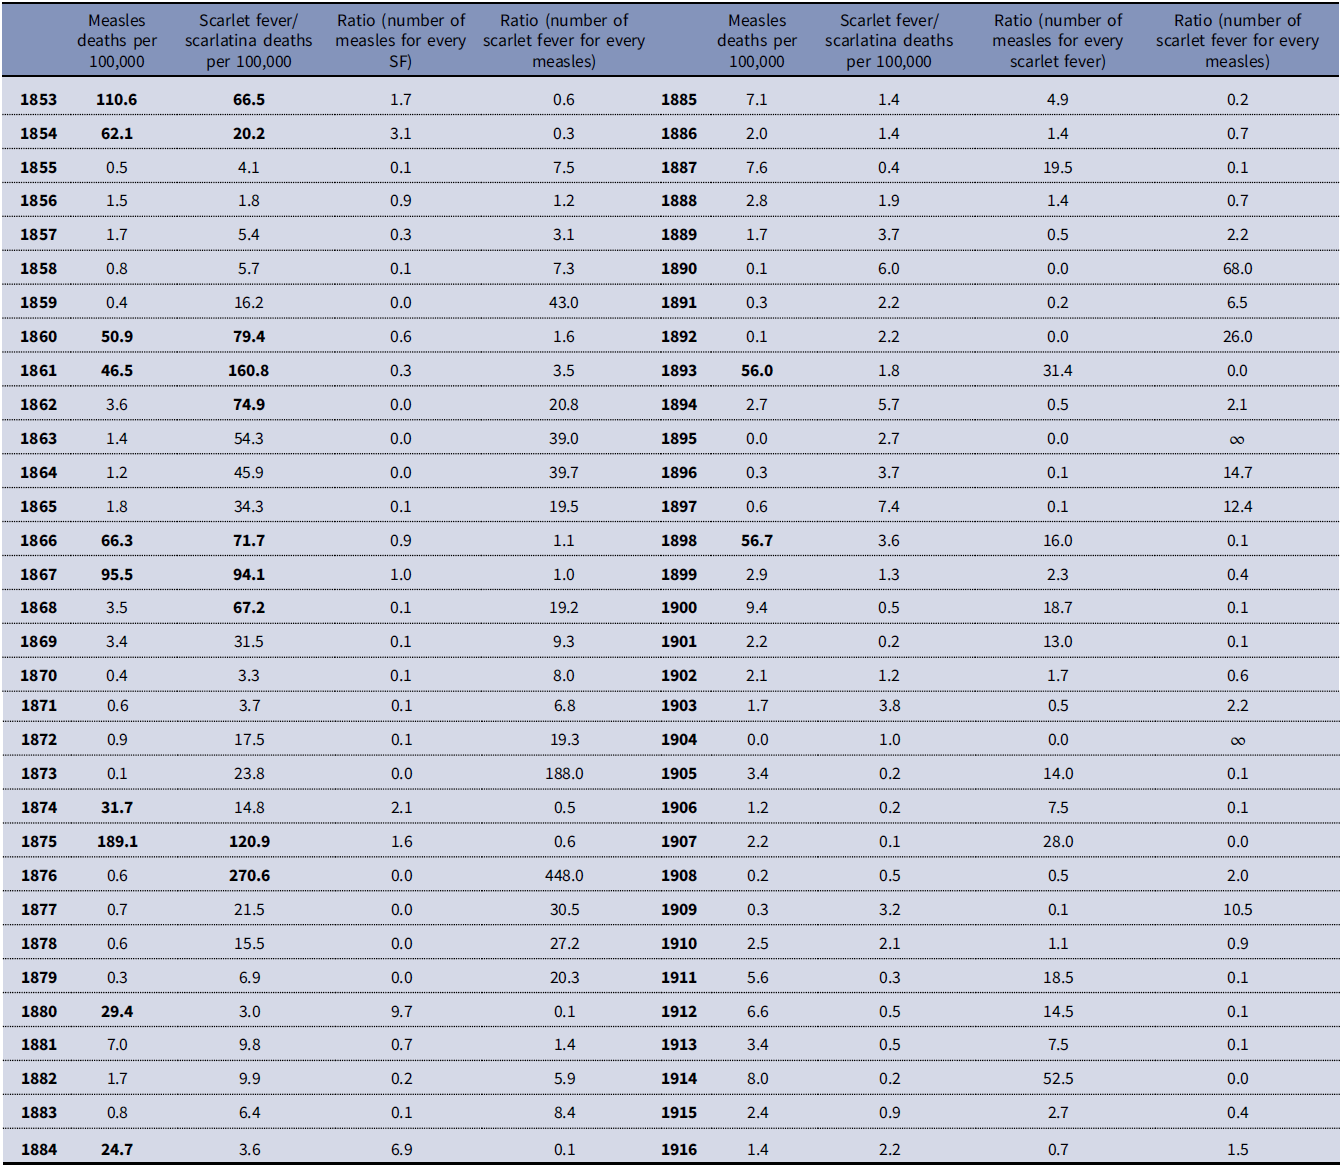
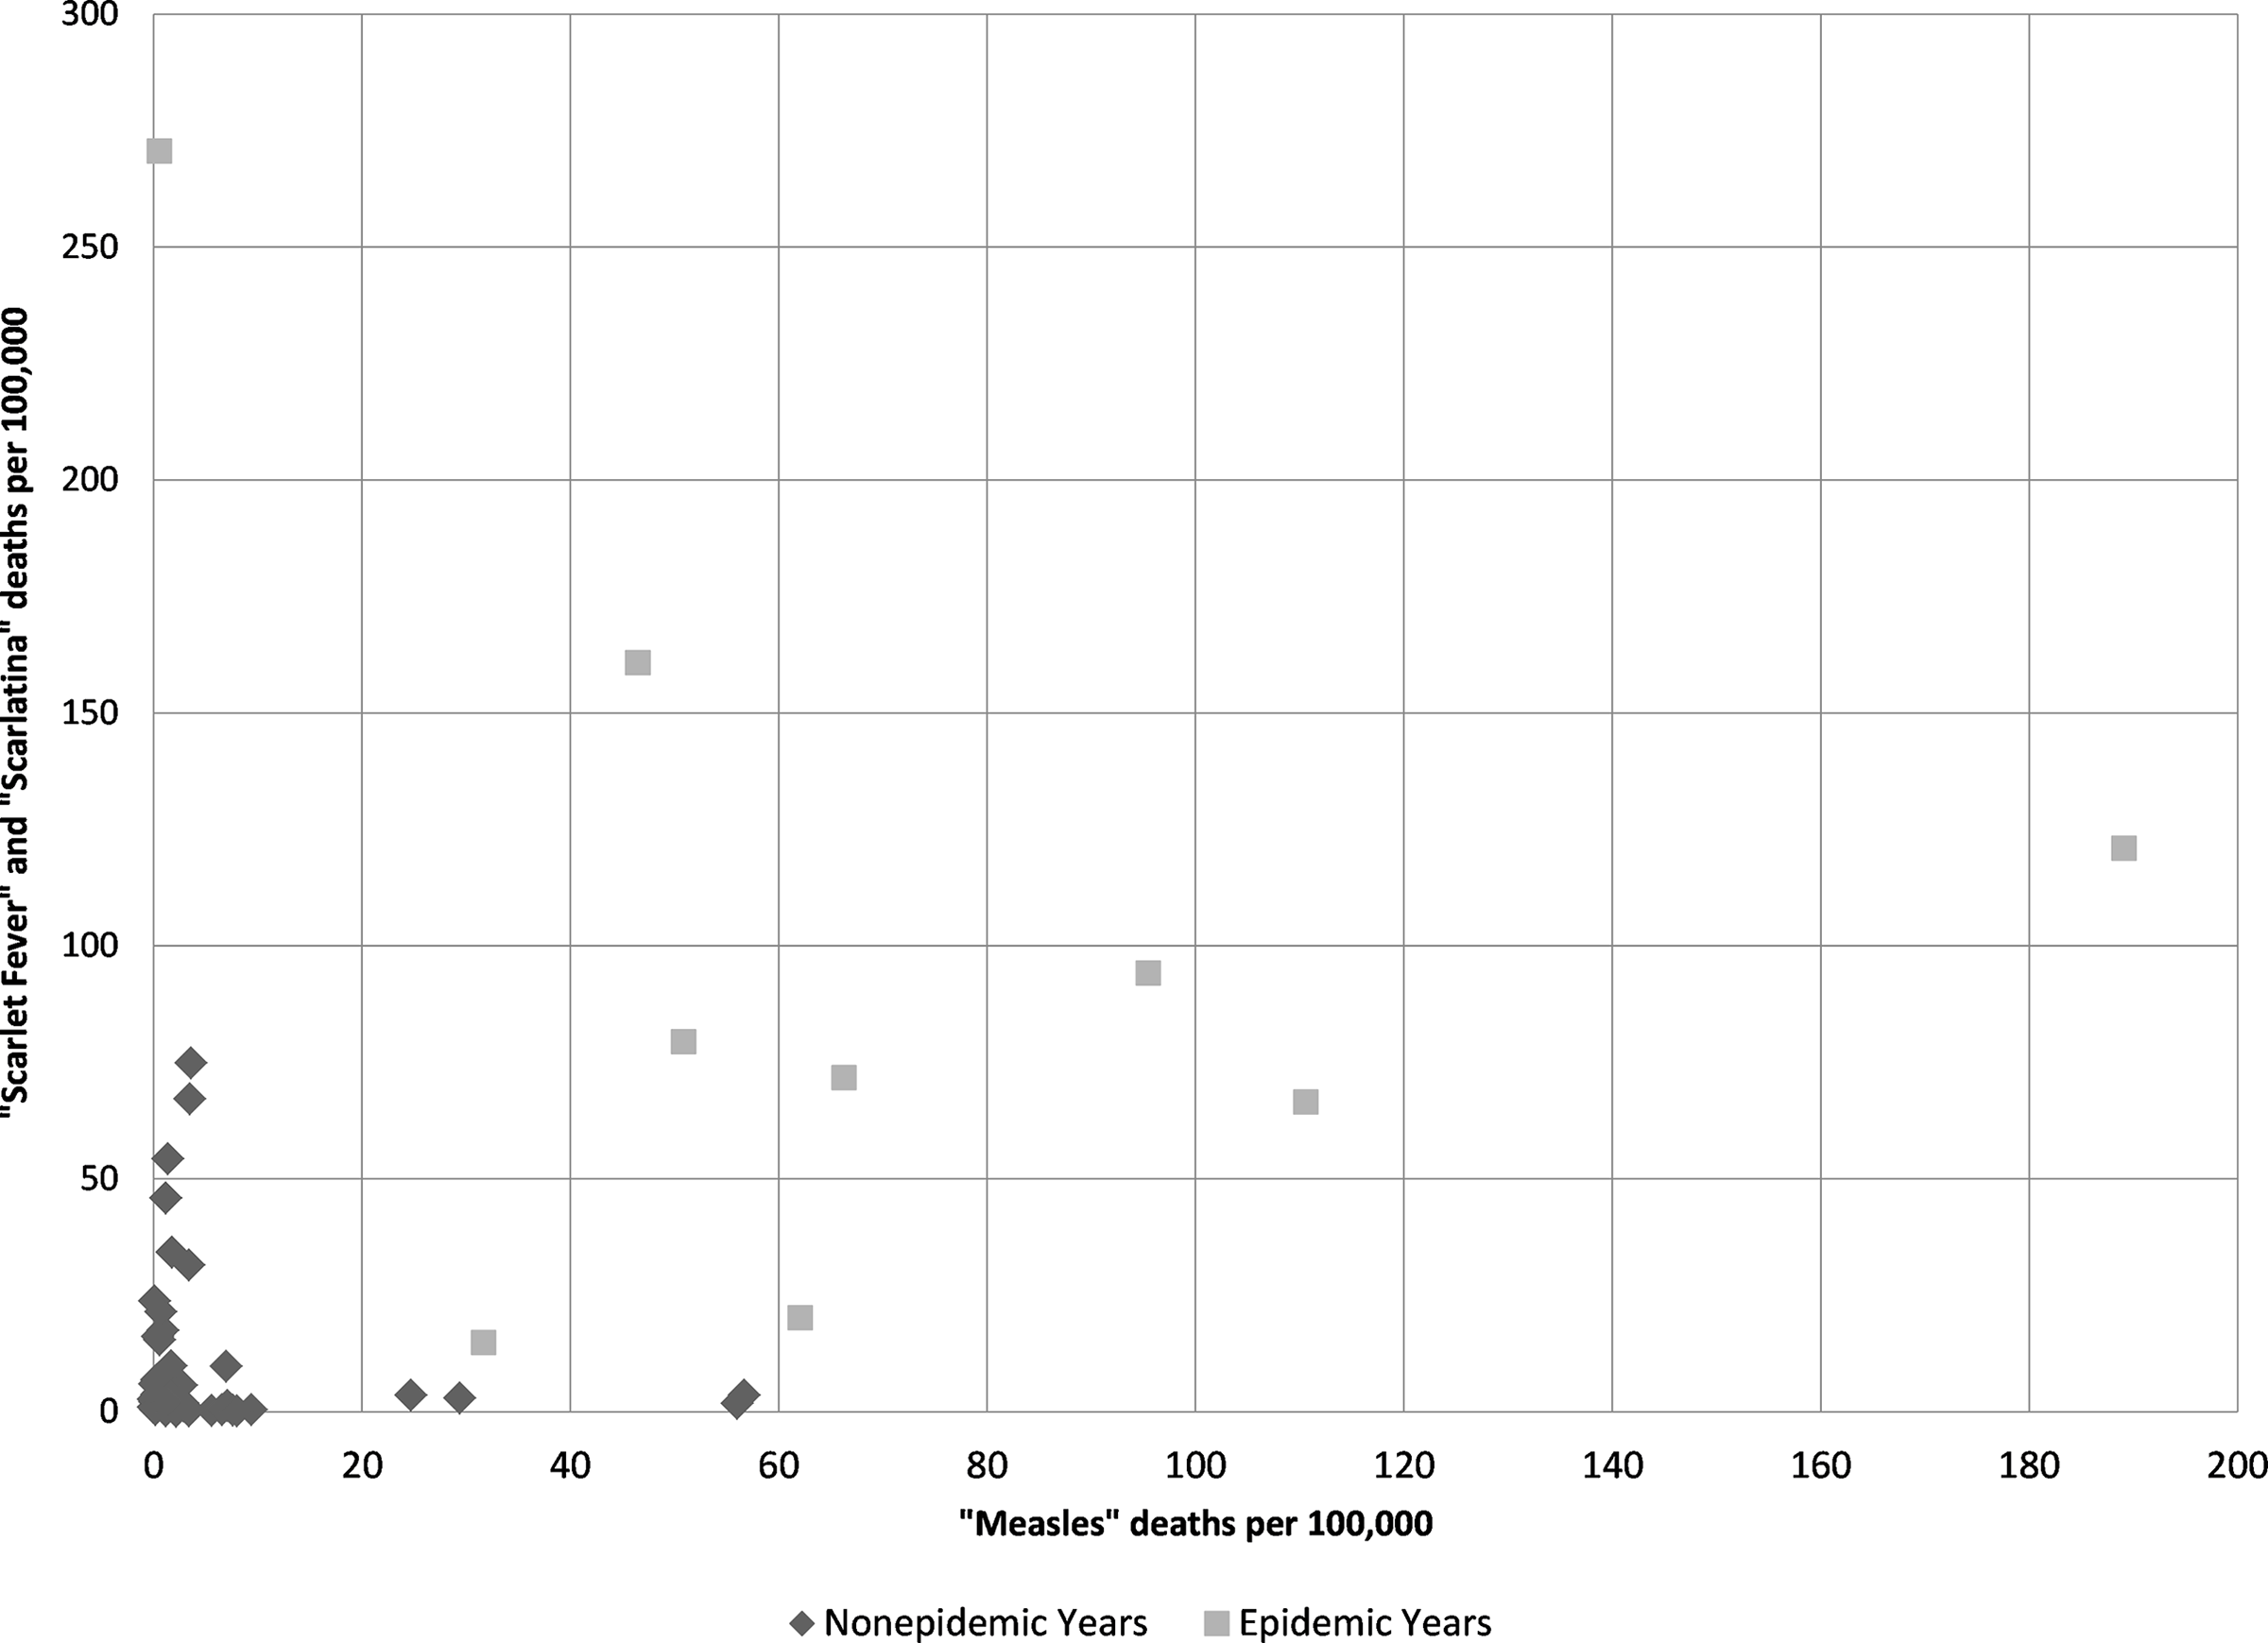
Figure 4. Regression chart of “scarlet fever” and “scarlatina” mortality rates per 100,000 compared to “measles” mortality per 100,000 (r = 0.42) calculated from Victorian Registrar General’s Reports.
Table 1 reveals that the peak in deaths assigned to measles often occurred in the year before the peak in “scarlet fever”/“scarlatina” deaths, which suggests measles was making the population vulnerable to infection with the GAS pathogen. This observation of a delay between the measles and scarlet fever mortality peaks is consistent with the hypothesis of Mina et al. (Reference Mina, Metcalf, Swart, Osterhaus and Grenfell2015) that the period of immune memory loss after an infection with measles can last months or years, possibly until reexposure to the relevant agents (Mina et al. Reference Mina, Kula, Leng, Li, de Vries, Knip, Siljander, Rewers, Choy, Wilson, Larman, Nelson, Griffin, de Swart and Elledge2019). We explore this possibility further in the following text.
A simple explanation for the apparent epidemic synchronization between scarlet fever and measles is that children were being infected with both measles and group A strep at the same time. The Registrar General reported a single cause of death in the Victorian mortality statistics and did not report contributing factors that may have affected the progression of a disease to death, therefore rates of coinfection are not available from the mortality statistics. Coinfection of measles virus and S. pyogenes would increase the extent of the skin reactions and the risk of pneumonia, empyema, ear and sinus infections, and meningitis (GAS)/encephalitis (measles), which are symptoms and complications of both diseases (U.S. National Library of Medicine 2020). Furthermore, both measles and group A strep have immune-suppressing influences, and thus coinfection might result in a bidirectional synergistic effect.Footnote 8
However, figure 1 and table 1 show that measles deaths were often peaking just before the peak in deaths from scarlet fever. An infection of scarlet fever might have been secondary to the measles infection (i.e., an opportunistic infection), the virus damaging an individual’s respiratory epithelium and weakening their immune system—an opportunity then exploited by the bacteria. Furthermore, beyond immediate secondary infections, the combination of immunosuppression and longer-term (months to years) immune memory loss following measles might have contributed to a rapid increase in the pool of hosts susceptible to scarlet fever infection, and thus “forced” the timing of the next group A strep epidemic. Mathematical modeling could aid in testing this hypothesis.
There is a strong correlation between measles and scarlet fever in the following year.Footnote 9 Variably intense immunosuppression and immune memory loss would be consistent with the variation in lag time between the epidemic peaks of measles and scarlet fever seen in figure 1 and table 1. Moreover, the combination of measles and scarlet fever epidemics might have increased mortality rates as some individuals would have been hit by both diseases in short succession (see Aaby Reference Aaby, Maza and Peterson1991 for a review and discussion of excess morbidity and mortality following measles).
This is an area that requires further research, as mortality statistics, which sample the population without replacement, are not necessarily a good proxy for morbidity—yet morbidity records from the period are problematic. Unfortunately, the period of the proposed lagged epidemics under examination here yields series that are too short for time-series analysis, which requires around 50 degrees of freedom for reliable prediction. Additionally, this relationship would be better tested with weekly or monthly data, which are unavailable here. Ideally, we would also want data to determine scarlet fever fatality rates of recent measles survivors versus nonrecent measles survivors. With historical data, such ideal criteria are rarely met.
While measles-induced immunosuppression can explain why a bacterial disease such as scarlet fever would follow measles peaks, it does not explain why this synchrony in Victoria occurred for scarlet fever and not another bacterial disease such as pertussis or diphtheria. It also does not explain why scarlet fever did not respond to the measles epidemics of 1884, 1893, 1898, and 1900. However, ecological interference might have played a role, in that an interference interaction occurred such that scarlet fever excluded other diseases (see Rohani et al. Reference Rohani, Green, Mantilla-Beniers and Grenfell2003). When scarlet fever mortality declined and the synchrony with measles ended, there is some indication that pertussis might have filled its vacated niche. Measles epidemics in 1884, 1893, 1898, and 1900 were followed by pertussis peaks in 1884–86, 1894, 1889, and 1901–2, respectively. This is only a suggestion at this point and requires further investigation.
The synergy between measles and scarlet fever in Victoria in the 1853–76 period might have been unidirectional or bidirectional. A unidirectional synergism, with measles preceding scarlet fever, could have seen scarlet fever developing as a secondary infection in measles-infected hosts, the virus making the respiratory epithelium more vulnerable to bacterial colonization. Alternatively, it might have been the result of measles-induced immune modulation lasting weeks to months beyond the viral infection, creating a pool of susceptibles and “forcing” the timing of scarlet fever epidemics.
While there is very little evidence for bacterial facilitation of viral infection, there is a considerable amount of research supporting the role of viral infections in facilitating bacterial ones (Bosch et al. Reference Bosch, Giske-Biesbroek, Trzcinski, Sanders and Bogaert2013). Similarly, with scarlet fever mortality generally lagging measles in the Victorian data presented here, there is less evidence for a bidirectional synergy, though it remains a possibility. At a social level, practices regarding quarantine and isolation within hospitals might have played a role in transmission in both directions (measles transmission to scarlet fever patients, and vice versa). The two pathogens might also have been transmitted simultaneously from coinfected individuals; previous studies have found evidence that coinfection can increase transmission of both pathogens (see Alizon Reference Alizon2013b). Both measles and GAS have immune-suppressing effects, so coinfection is likely to increase mortality risk.
We have demonstrated a temporal association between measles and scarlet fever epidemics from 1853 to 1876, but this data does not permit any evidence of a spatial association between the two diseases other than that they occurred in the same colony/state.
At the time of writing, historic quantitative data sources on a spatial association between measles and scarlet fever have not been analyzed. Potential sources of information below the colony/state level such as hospital admission records, contain their own confounding variables that must be navigated with care (e.g., hospital admission policies). Here we will briefly discuss some qualitative data from contemporary newspapers that indicate a spatial and temporal relationship between these two diseases was noted locally at the time.
A search of the National Library of Australia’s Trove database on digitized newspapers containing the terms “measles” plus “scarlet fever,” excluding advertisements, returns 160 newspaper article matches for the 1870s and 56 for the 1860s. A number of articles discuss measles and scarlet fever epidemics co-occurring in the same community (including, Anonymous 1874: 15; Anonymous 1875: 7; Bunce Reference Bunce1877: 4; Ratepayer 1875: 6; West-Ford Reference West-Ford1876: 1). One of the articles reviewed specifically observes a pattern of scarlet fever outbreaks following measles: “After dying out for lack of more subjects to ferment, there was a lull of active trouble until scarlet fever came, following measles, as it sometimes, though not in variably, will do” (Thomson 1877: 4).
Part 2: The End of a Synergy
Thus far this article has shown that there was an apparent disease synergy between measles and scarlet fever in Victoria, Australia from 1853 to 1876, and that this observation was not artifactual of nineteenth-century disease recording. The next question is, why did scarlet fever mortality rates stop responding to measles epidemics after 1876? For this we currently have little direct data, so the following discussion is largely speculative. However, the timing of the end of this disease synergy points to some potential explanations.
By the mid-1870s, while gold production was still very important to the economy of Victoria, farming and manufacturing had also become significant industries and Melbourne had developed a key position on the “Clipper” trade route (Blainey Reference Blainey2006). The same factors argued by others as contributing to the decreased virulence of the scarlet fever pathogen might also at least partially explain why the observed synergy between measles and scarlet fever in Victoria ended in 1876. These factors include demographic and economic changes that reduced the pool of susceptible individuals as well as improvements in public health measures, such as improved hygiene and better isolation of patients, which decreased transmission and tilted selection pressures in favor of less virulent strains (Katz and Morens Reference Katz and Morens1992; Mathews Reference Mathews and Sriprakash2005). We hypothesize that this reduced virulence was due to a shift in the dominant M-type or loss of the bacteriophage and provide evidence to support this. In the text that follows, we review the possibility that population growth, a shifting demographic profile, and economic change contributed to the loss of synchrony in mortality from measles and group A streptococcal infections.
During the 1850s the dramatic increase in population overtaxed the colony’s existing infrastructure, with a detrimental impact on living conditions. Over the course of the rest of the century, the infrastructure gradually caught up with the needs of the population and living conditions improved (Blainey Reference Blainey2006). As an example of the reduction in secondary health stresses through an improvement in living conditions, table 2 shows the improvement in the quality of housing in Victoria as recorded in the censuses. Particularly dramatic is the reduction in the number of people living in tent/dray housing between the 1860s and 1870s. This might explain the overall reduction in mortality rates and, by reducing transmission, could have contributed to a shift in the dominant GAS M-type in the 1870s. Similarly, lower general mortality might also have contributed to decreased virulence. Increased background mortality in a host population can select for increased virulence because the parasite has limited time to exploit the host’s resources (Alizon Reference Alizon2013a)—therefore as host population mortality rates declined, selection pressures toward virulence might have weakened.
Table 2. Materials of outer walls of dwellings in Victoria (total). Modified from Jackson and Bridge (Reference Jackson, Bridge and Vamplew1987:349)

In addition to overall population growth, it is important to consider the demographics of the population in terms of the groups most at risk, namely children who were the most likely to lack immunity and for whom these diseases were more severe. To do this we can look to fertility rates and the proportion of children in the population. The fertility rates presented in figure 5 and population counts for census years of 1861, 1871, 1881, and 1891 (figure 6) suggest that the proportion of children under five years of age in the population was higher before the mid-1870s. The period between 1875 and 1885 where the scarlet fever epidemic cycle appears to have been broken shows a generally declining fertility rate in the study area. This change in the proportion of the population in the youngest (and most susceptible) age groups might have contributed to a change in GAS type.

Figure 5. General Fertility Rate, 1864 to 1920, calculated from information in Caldwell (1987) (number of babies born per 1,000 women aged between 15 and 49 years).
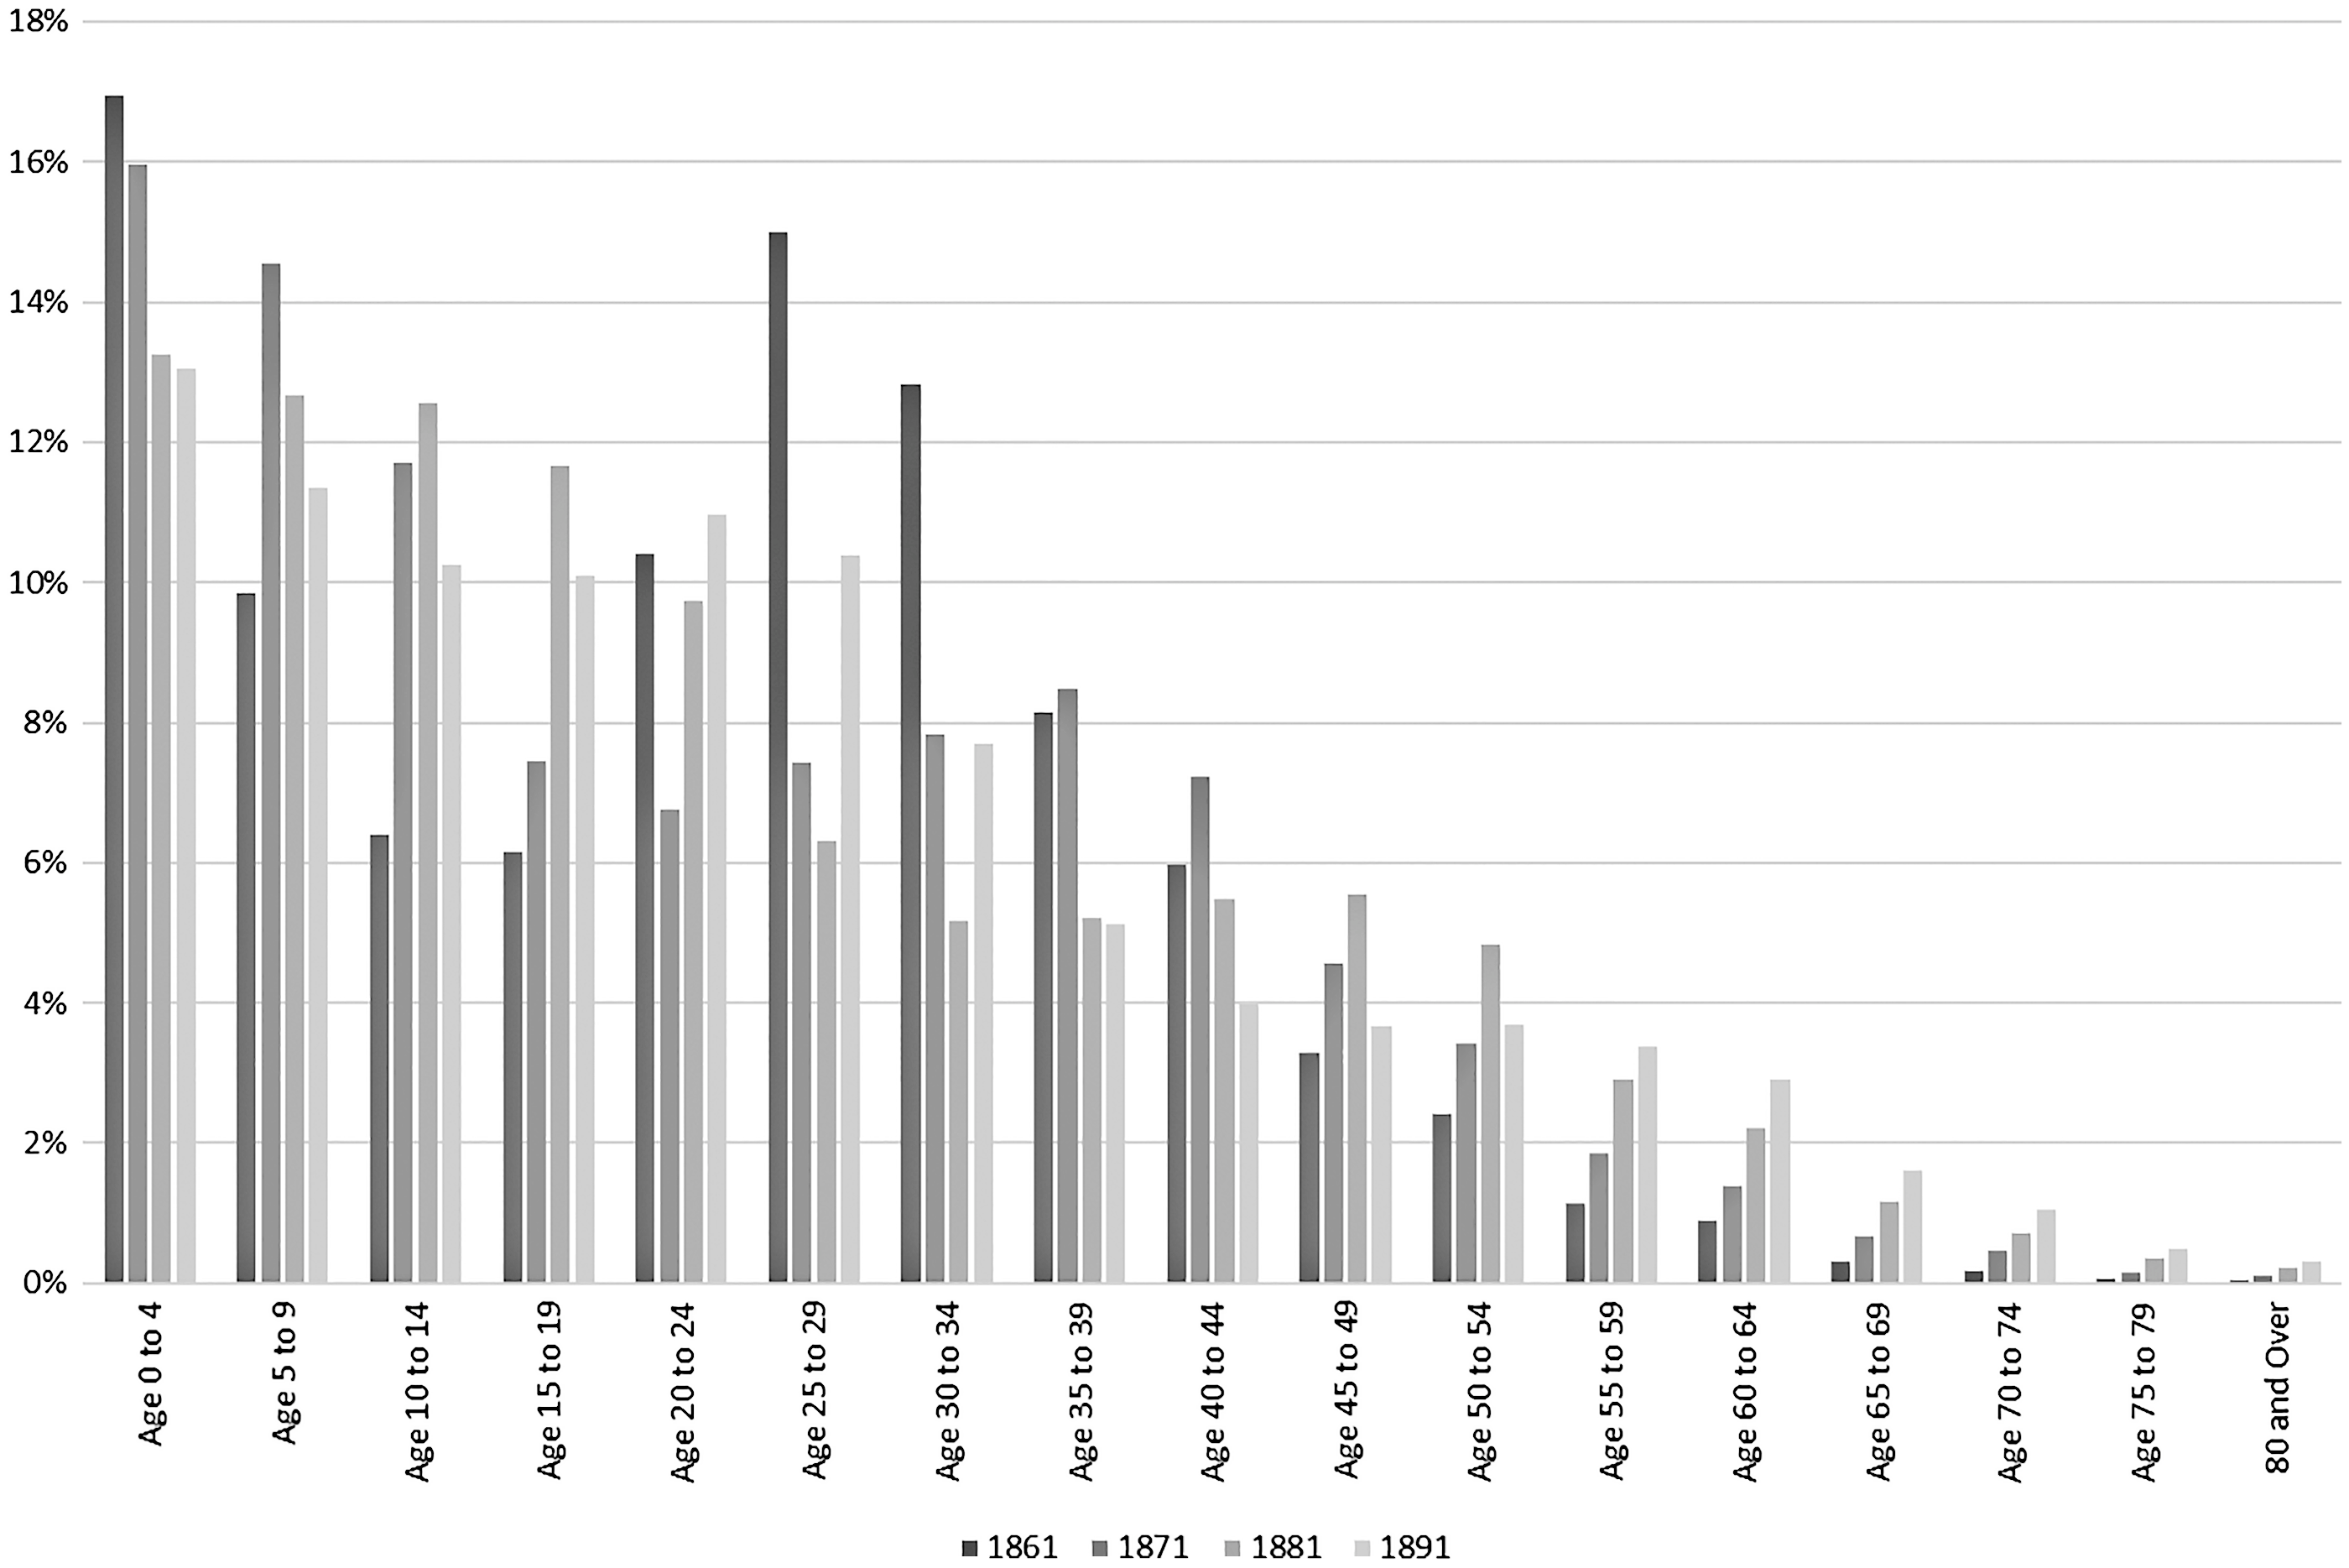
Figure 6. Age groups as a percentage of total population, Victorian Census Reports 1861, 1871, 1881, and 1891.
While other researchers have observed a change in the virulence of scarlet fever in the nineteenth century, it is not fully understood why the scarlet fever epidemic cycle ended in the 1870s. Appleby (Reference Appleby1975) and Duncan et al. (Reference Duncan, Duncan and Scott1996) show that scarlet fever epidemics in England and Wales between 1847 and 1880 occurred at an interval of five to six years, in a similar pattern to those in Victoria. Duncan et al. (Reference Duncan, Duncan and Scott1996) conclude that the epidemic cycle ended because of improved nutrition due to a dramatic fall in the wheat price. Appleby (Reference Appleby1975) also hypothesizes on some association between bread prices and scarlet fever epidemics in England and Wales. This fall in the wheat prices was due, in part, to the development of large-scale wheat farming in the Wimmera and Mallee regions of Victoria during the 1870s. Other factors that led to the drop in wheat prices included progressively larger steam-powered shipping replacing sail transport, the invention of the combine harvester, and the development of a worldwide telegraph network (Bate Reference Bate1988), which enabled better transport and distribution of wheat from areas such as Victoria to the rest of the world. Similar to improvements in living conditions, improved nutrition could not only have increased scarlet fever survivorship directly by increasing host resistance but also it might have facilitated a change in the dominant type of GAS by reducing background mortality.
Another consideration is whether medical and public health developments could have played a direct or indirect role in the change in group A strep and measles manifestation in the late 1870s. In 1874 Billroth demonstrated the presence of streptococci in pus from wound infections, and Pasteur identified streptococci in the blood of a woman with puerperal sepsis in 1879 (Porter Reference Porter1999). The 1870s also saw some major reforms to medical practice through the work of Florence Nightingale and other like-minded individuals. Nurse-to-patient ratios dramatically improved and hospital administration and practice were enhanced (ibid.). The Public Health Act was passed by the British Government in 1875 (Hurren Reference Hurren2005), and its measures were adopted relatively quickly by Australian medical practitioners (DeCosta Reference DeCosta2002).
While Joseph Lister’s antiseptic advancements probably reduced rates of postsurgical infections with GAS, the late 1870s is far too early for any recognized medical development to treat either disease. Although primary care medicine improved with the professionalization of nurses, direct medical interventions probably played no significant part in the observed disease changes (see Alter Reference Alter2004; Livi-Bacci Reference Livi-Bacci1991; McKeown Reference McKeown1976; Smith Reference Smith1990; Szreter Reference Szreter1988). However, these health-care-related developments might have played an indirect role in facilitating a change in the dominant type of GAS affecting the population.
A further possibility often raised in historical studies of disease is that the observed changes in disease frequency might be due to a change in case definition—in other words, that this might explain the decline in scarlet fever mortality and the end of the synergy. We recognize that when studying disease frequency, especially in a historical context, what is being studied is the artifact that is diagnosis, not the direct biological reality (Roberts Reference Roberts2014). In examining a change in frequency of a diagnosis, we must first distinguish between a change in case definition and a change in the biological reality of the disease. Nosological classifications did change over the period of study, concurrent with the large number of medical and scientific discoveries in the nineteenth century. However, the diagnosis-specific mortality patterns displayed for measles and scarlet fever do not fit a typical pattern for a change in case definition.
We present an example of what a change in case definition looks like in the mortality data in figure 7. This chart shows the mortality rates for the diagnoses “typhoid/typhus fever” and “enteritis.” Between 1889 and 1991, Victoria’s Registrar General’s reports show a reduction in the number of deaths described as “typhoid/typhus fever” but an approximately equal and opposite increase in the number of deaths described as “enteritis” at the same time. When the total number of deaths from intestinal infections is calculated, using both nosological classifications, a constant increase in mortality can be observed. With the available data, the change in mortality given as “typhoid/typhus fever” and “enteritis” is best explained as artifactual of a change in case definition and not the result of a change in the biological reality of the disease. This pattern is not observed for mortality given as “measles” and “scarlet fever/scarlatina.”
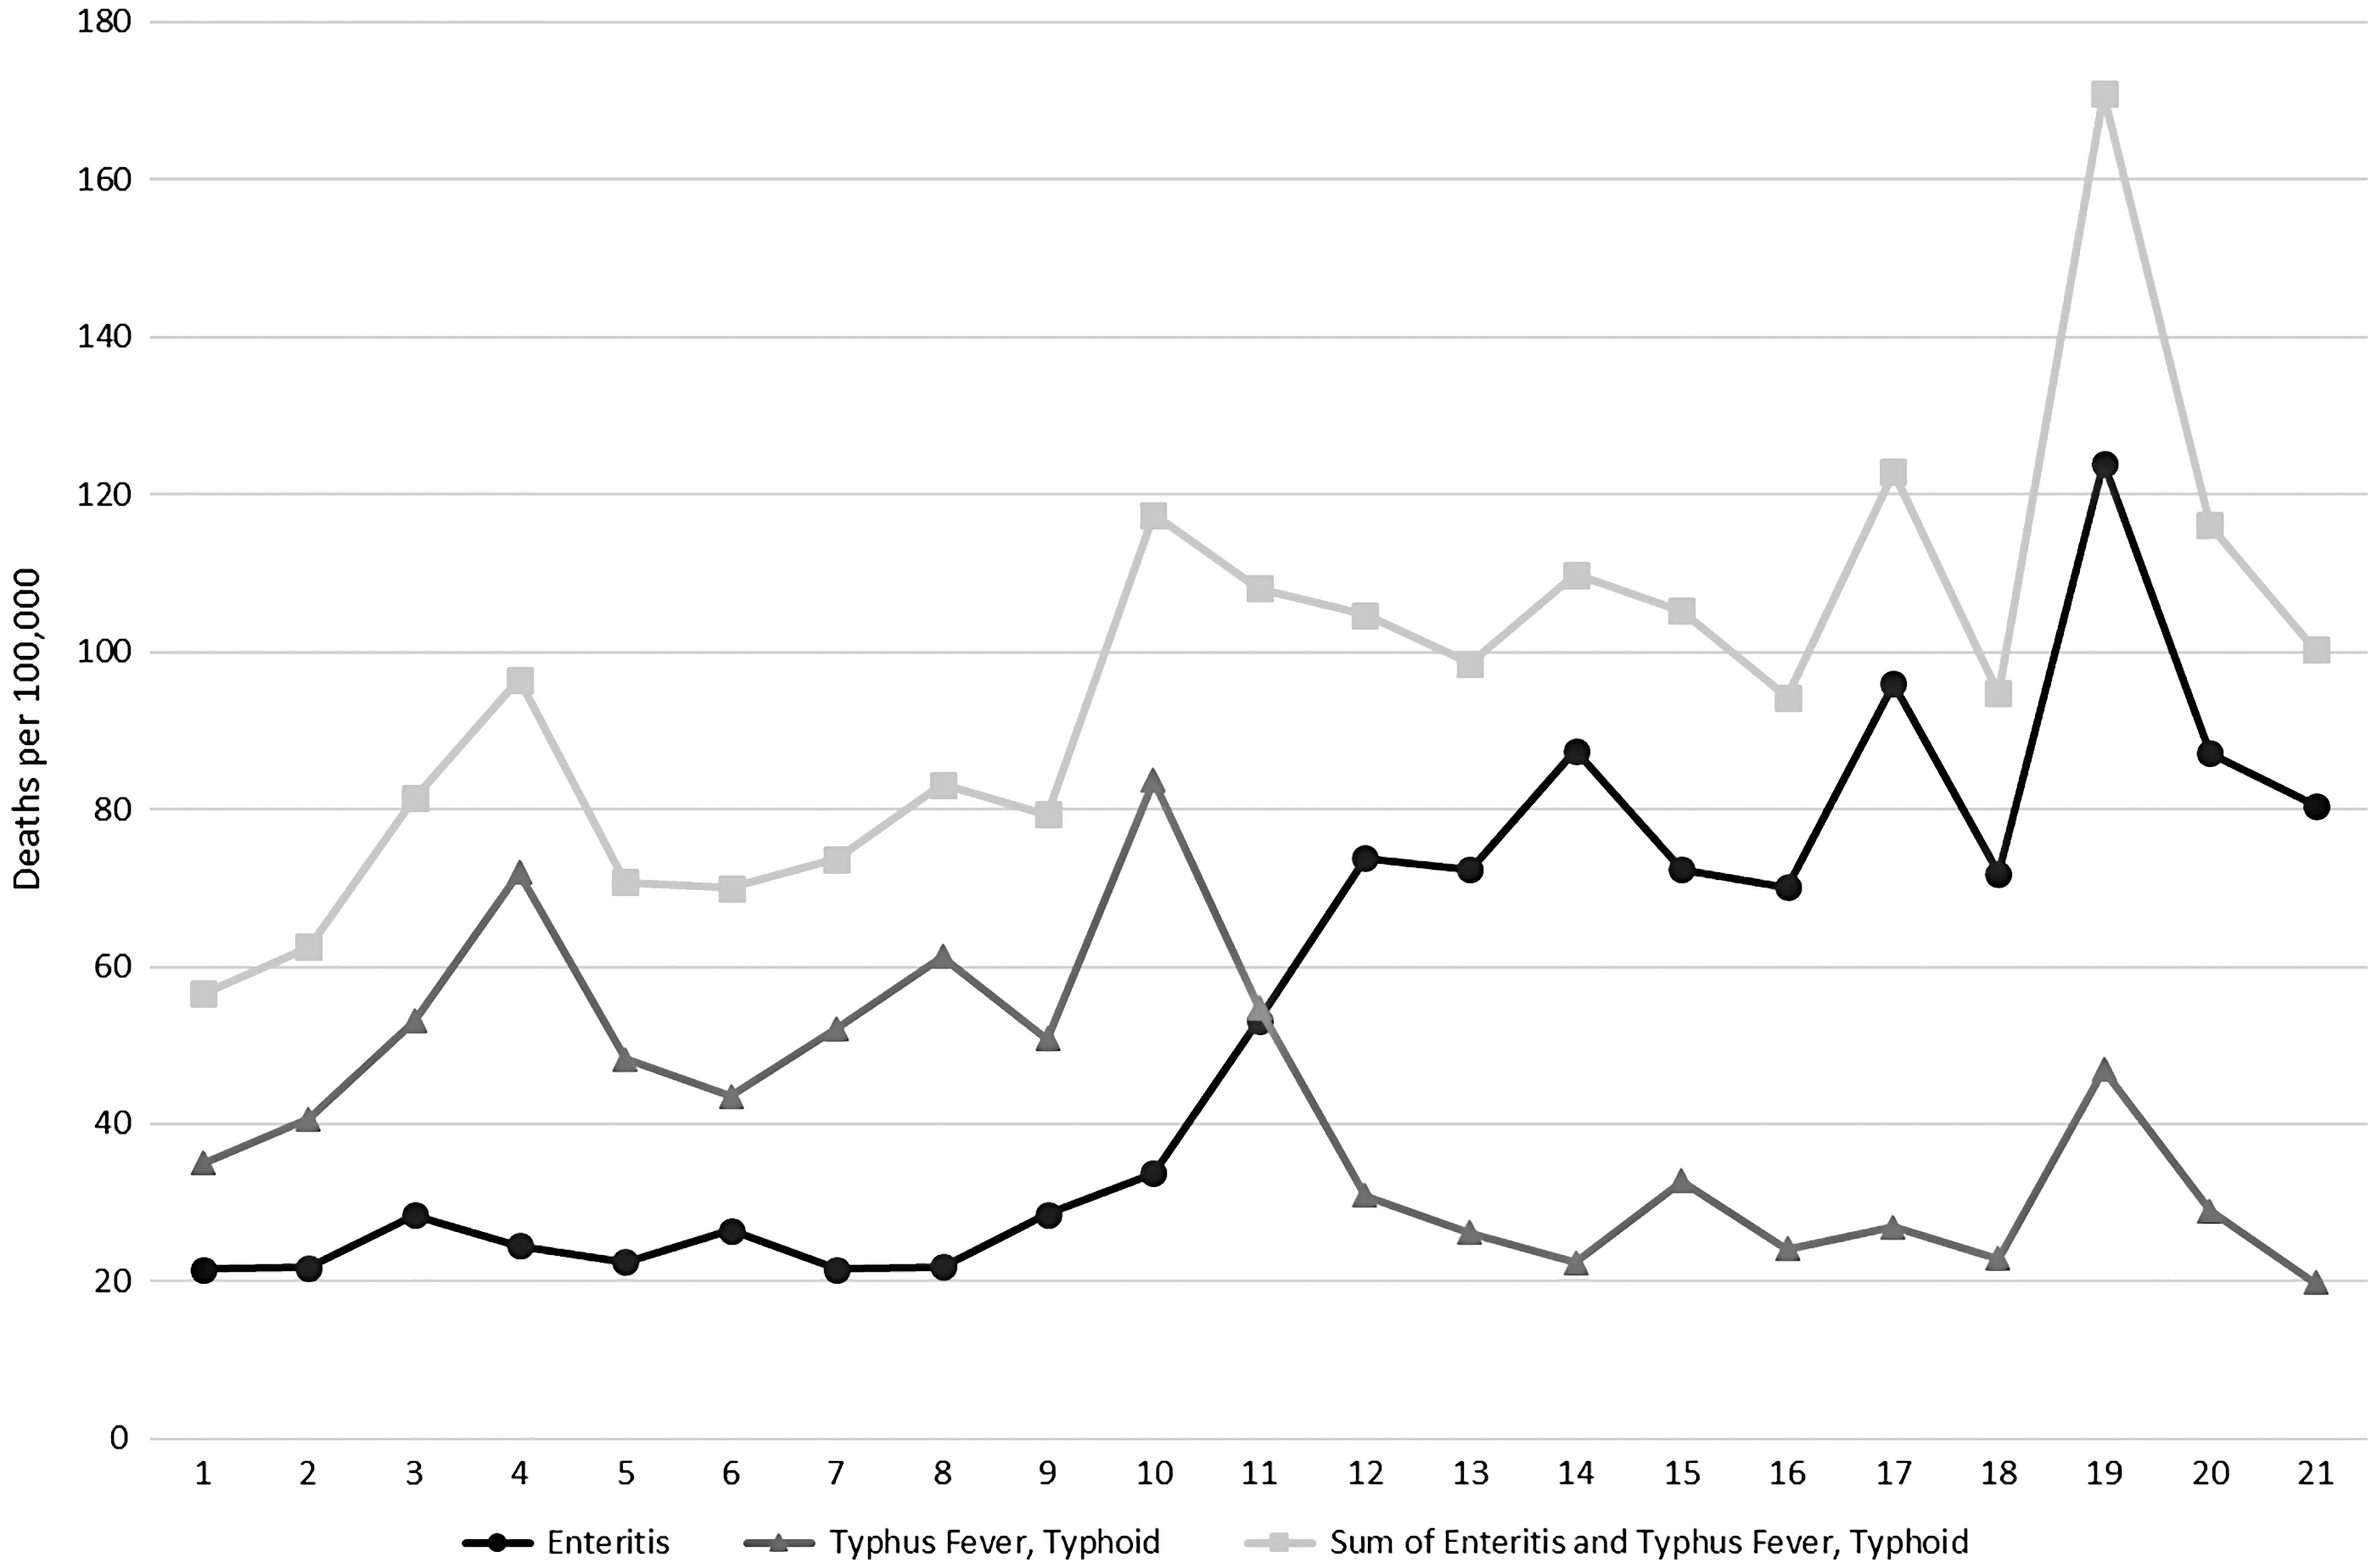
Figure 7. “Enteritis” and “typhus fever”/“typhoid” mortality rates per 100,000 summed to produce a mortality rate for total intestinal infections, calculated from the Victorian Registrar General’s Reports.
We suggest that reduced group A strep virulence in Victoria from the late 1870s was due to either an alteration in the dominant M-type and/or a loss of, or change in, the bacteriophage affecting the local GAS pathogen. Both scenarios could have resulted in a less virulent pathogen, leading to a decrease in mortality from initial group A strep infections such as scarlet fever and an increase in mortality from more chronic causes. As different GAS M-types cause different infections at different rates, we also examined other diagnoses that could be associated with group A strep infections. These were diagnosed as “puerperal fever,” “erysipelas,” “rheumatic fever,” and “Bright’s disease” in the Victorian Registrar General’s reports.Footnote 10
As expected, the mortality frequency for “puerperal fever,” “erysipelas,” and “rheumatic fever” parallel the mortality described as “scarlet fever” (figures 8, 9, and 10). Figure 10 is a cumulative chart because of apparent changes in case definition for diagnoses that could be associated with rheumatic fever; mortality figures for this category are potentially incomplete, especially in the period 1903–7. Mortality rates associated with “erysipelas,” a skin infection and an initial disease form, appear to decrease after the cessation of the scarlet fever epidemics. At the same time, mortality attributed to “puerperal fever” and “rheumatic fever” appears to have increased slightly. The mortality rate for “Bright’s disease” also increased from the 1870s onward, but much more dramatically (figure 11). This change in frequencies of mortality from different types of group A strep infections, especially sequalae infections, supports the hypothesis that there was a change in GAS M-type or a loss of the bacteriophage sometime in the late 1870s.

Figure 8. Diagnosis specific mortality rates for “metria/puerperal fever” per 100,000 in Victoria from 1853 to 1900 as calculated from the Annual Victorian Registrar General’s reports.

Figure 9. Cause specific mortality rates for “erysipelas” per 100,000 in Victoria from 1853 to 1916 with age standardized mortality for 1901 as calculated from the Annual Registrar General’s reports.

Figure 10. Diagnosis-specific mortality rates for “rheumatic fever” per 100,000 in Victoria from 1853 to 1900 calculated from the Annual Registrar General’s reports to Parliament (note charted as cumulative figures).
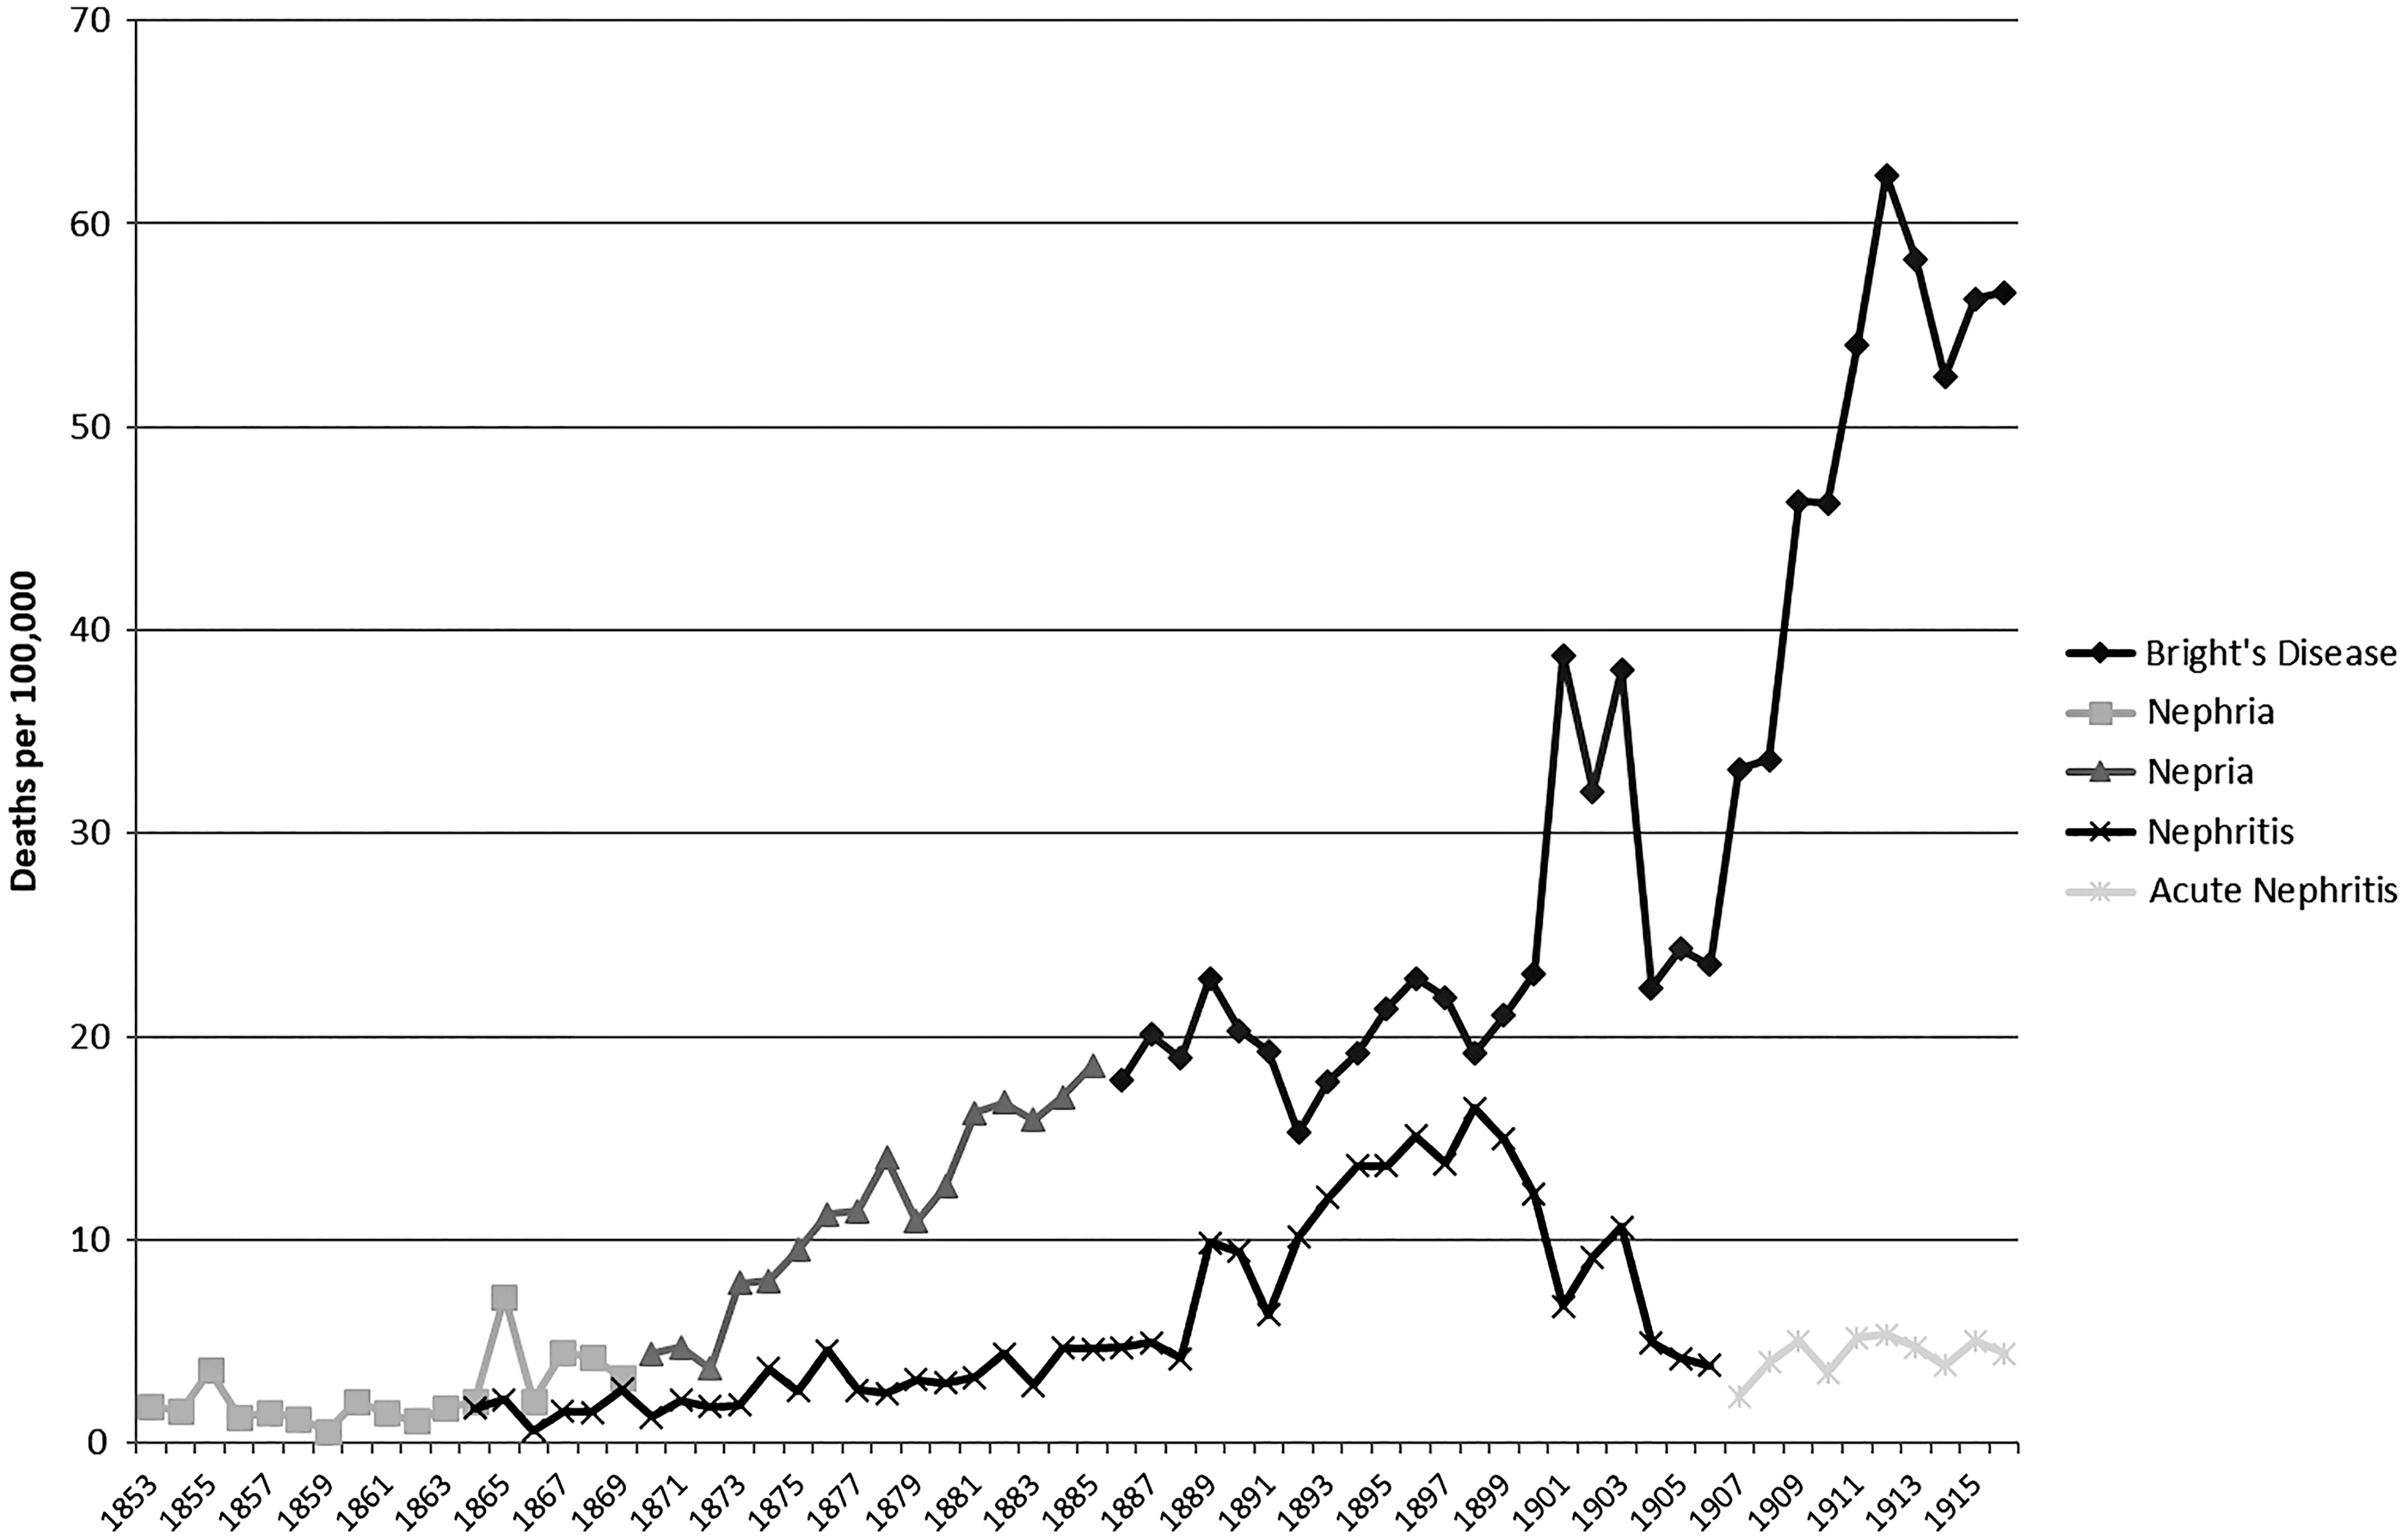
Figure 11. Cause-specific death rates for “nephritis” and “nepria/Bright’s Disease” per 100,000 in Victoria from 1853 to 1900 as calculated from the Annual Victorian Registrar General’s reports.
Inflammation of the kidneys, or nephritis, can have many causes, including infection, poisoning, hypertension, congenital causes, and pregnancy (Del Mar and Murray Reference Del Mar and Murray2006). Importantly, it often occurs as a progression of another infection, and infection with GAS (post-streptococcal glomerulonephritis) is considered the most common cause of the disease in the past (Larson Reference Larson and Kiple2003). As early as the eighteenth century “edematous swelling with scanty, dark and at times totally suppressed urine” was identified as a dangerous complication that occurred in the convalescent period following scarlet fever (Burserius de Kanifeld Reference Burserius de Kanifeld1801).
Two groups of diagnoses (figure 11) could be considered to describe nephritis within the study period: “nephritis” and “nepria/Bright’s disease.” Of these, “nepria/Bright’s disease” diagnosis is probably more likely to include the disease currently called post-streptococcal glomerulonephritis. Stewart’s (Reference Stewart and Quain1882: 175) statement that “Bright’s disease” often resulted from an infection with scarlet fever, erysipelas, or acute rheumatism supports this. The observed increases in mortality rates from “nepria/Bright’s disease” in 1855, 1860–62, and 1866–68, which follow the scarlet fever epidemics, also support this conclusion. The correlation of mortality between “scarlet fever” and “nepria/Bright’s disease” is moderately positive for 1853–76 but switches to a negative in the 1877–1916 period.Footnote 11 This suggests a shift in the manifestation of GAS infections, in this case from a highly virulent epidemic disease of children (in the form of scarlet fever) to an endemic disease of adults.
While post-streptococcal glomerulonephritis is a childhood disease, it can contribute to renal failure later in life; this accounts for the observation that “Bright’s disease” was predominately a cause of death given to older adults (Hoy et al. Reference Hoy, White, Dowling, Sharma, Bloomfield, Swanson, Mathews and McCredie2012). This would also correlate with a reduction in virulence and therefore an increase in the potential to survive initial GAS forms. Therefore, there may be an argument that the increase in Bright’s disease mortality was a result of the aging of the pre-1877 scarlet fever survivors. One would expect, however, that there would be a decrease of Bright’s disease cases over time as a result of the pre-1877 scarlet fever survivors making up a progressively smaller percentage of the population. Because the Bright’s disease cases are sustained in high numbers from the 1870s into the twentieth century, we do not believe the number of survivor cases is significant. Furthermore, the legacy of past GAS infections can lead to rheumatic heart disease in later life. If these legacy cases were causing the increase in Bright’s disease from the 1870s to 1916, deaths from rheumatic heart disease should also show a similar pattern, which they do not.
In summary, the end of the synergistic relationship between measles and scarlet fever after 1876 lacks an obvious singular explanation. However, the same factors suggested by others as contributing to the increasing and subsequent decreasing virulence of the scarlet fever pathogen through changing selection pressures, namely levels of hygiene and degree of isolation of patients (Katz and Morens Reference Katz and Morens1992: 305; Mathews Reference Mathews and Sriprakash2005), might have played a role. Additionally, Zhu et al. (Reference Zhu, Olsen, Nasser, Beres, Vuopio, Kristinsson, Gottfredsson, Porter, DeLeo and Musser2015) found that genetic changes that increased toxin production in GAS also increased transmission. Thus, it is plausible that the combination of decreased virulence with decreased transmission ability changed its relationship with measles epidemics.
Conclusion
In Victoria from the 1850s to the mid-1870s we see an apparent five- to nine-year synchronic cycle of measles and scarlet fever, with each disease causing more than 100 deaths per 100,000 in the peak epidemic years. We examined potential explanations for this pattern in the preceding text. The antiquity of differentiation between cases of measles and scarlet fever along with the patterns of diagnosis suggest that nineteenth-century doctors were not confusing these diseases at death in a statistically significant proportion of cases. The patterns of mortality rates also do not fit a change in case definition, which we have observed for other diseases in this data set. There were major shifts in the demographics and socioeconomics of the study population over the period, as well as improvements in public health and medicine, and these might have contributed to selection pressures that led to a shift in the dominant GAS M-type present in the population. Therefore, the analysis of data associated with the synchronization of measles and scarlet fever, and the rejection of other potential causes for the pattern, leads to a hypothesis that there was a synergistic relationship between measles and group A strep infections before the 1876 epidemic, which was lost afterward.
There are several limitations to the analyses and arguments presented here. First of all, there are the inherent problems faced in using historical mortality data. These include, but are by no means limited to, studying infectious disease in a period when contagion theory was only developing, analyzing mortality patterns using historic data sources produced very early in the development of public registration, and dealing with the complexity inherent in large data sets. Additionally, as Hahn et al. (Reference Hahn, Knox and Forman2005) have shown, the mechanisms of many group A strep infections are still not fully understood, and the work by Mina et al. (Reference Mina, Kula, Leng, Li, de Vries, Knip, Siljander, Rewers, Choy, Wilson, Larman, Nelson, Griffin, de Swart and Elledge2019) and others is just beginning to tease out the variable impact of measles infection on the immune system and immune memory.
Despite these challenges, this work demonstrates the value of detailed analysis of historical death records. The potential synergistic relationship between measles and scarlet fever in Victoria, previously unidentified, appears tied to the gold rush context of high fertility and mortality, crowding, and makeshift housing (tents, drays); when those factors changed, there was a corresponding change in the epidemiological pattern. Although we cannot establish a causal relationship with the data available, this close examination of the Registrar General’s reports in conjunction with other historical data provides new insight into an important period in Australian—and global—history. It also adds to our knowledge of the effects of measles beyond immediate morbidity and mortality and supports arguments for a change in the GAS pathogen as the primary cause of the end of the nineteenth-century scarlet fever pandemic. In particular, we point to the importance of social conditions beyond creating vulnerabilities to infection or social disparities in health (e.g., along lines of socioeconomic status or class), to shaping broader processes, including pathogen evolution and patterns of interaction between diseases. It is our hope that this work will spur others to investigate potential similar relationships elsewhere, particularly where more precise historical data is available.
This topic is unfortunately timely given the current measles epidemics in many countries and the recent and continuing rise in invasive S. pyogenes infections in England and elsewhere (Lynskey et al. Reference Lynskey, Jauneikaite, Kwong Li, Zhi, Turner, Mosavie, Pearson, Asai, Lobkowicz, Chow, Parkhill, Lamagni, Chalker and Sriskandan2019). Once thought to be on the decline following the discovery of antibiotics, diseases associated with group A strep (notably rheumatic fever, puerperal sepsis, necrotizing fasciitis, and toxic shock–like syndrome) have been increasing in frequency over the last 20 years, due in part to multidrug-resistant strains of the bacteria (Leboffe and Pierce Reference Leboffe and Pierce2005). Furthermore, virulence in group A strep appears to show a cyclic pattern (Denny Reference Denny, Stevens and Kaplan2000; McKeown Reference McKeown1976: 82–83). Meanwhile, measles immunization rates have declined in some regions and the disease is becoming more common in many lower-income countries (Mina et al. Reference Mina, Metcalf, Swart, Osterhaus and Grenfell2015: 694). The potential of a revival of a dormant relationship between measles and scarlet fever should not be dismissed. Future research might use mathematical modeling to further investigate the potential relationship between measles and virulent GAS and other pathogens and begin the analysis of some of the more problematic historical data on disease morbidity from the study period.
APPENDIX A
Foundation Data
Table A1. Foundation data

Note: There are a couple of minor things to note in the data presented here. First, for 1866 the crude mortality rate is nearly a third of 1865 and 1867 despite being an epidemic year. This is most likely an error in the source data. The number of deaths reported as “measles” and “scarlet fever” may only represent a fraction of the total deaths from these causes. This is also the case from 1904 to 1908, which may have been an administrative teething problem with recording of public data changing from being a colonial to federal responsibility with the unification of the Australian colonies in 1901. There is, however, continuity of mortality rates outside of these exceptions.


