Introduction
Medicare is the most important public financed insurance programme for the elderly population in the United States (US). It covers the majority of the costs of hospital care (Part A), medical care (Part B), and prescription drugs (Part D) for citizens and legal residents of five years or more from age sixty-five to death. Medicare is the second largest entitlement programme of the US. It has an annual budget of $500 billion or more and accounts for 15 per cent of the federal budget (David and Moffit, Reference David and Moffit2006). The implications of the baby boom generation's retirement for the financial burden of Medicare have been widely discussed in both the professional community and the popular press in attempts to find solutions to make Medicare solvent without significant welfare loss for seniors (Wydon and Ryan, Reference Wydon and Ryan2011).
However, there are two crucial issues that are closely tied to the long-term outlook for the financial stability of Medicare, but which have been ignored in current discussions, and hence require further investigation. First, there is a lack of in-depth investigation of how changes in the demographic characteristics of the retirement population will influence Medicare expenditures. Specifically, there is great need to understand the implications of gender and racial composition, and physical stature, measured by height, weight, and body mass index (BMI), to Medicare expenditures. Second, most of the existing studies are cross-sectional studies that ignore the nature of Medicare as an entitlement programme that covers each beneficiary from age sixty-five until death, a feature that requires longitudinal analysis to understand the effect on lifetime Medicare expenditures of the demographic and biological changes in the population by demographic groups. The much-needed longitudinal analysis, however, poses many modelling challenges regarding the dynamics of relationships among gender and racial composition, weight and height, life expectancy, functional ability deterioration, demand for health care services, and Medicare expenditures.
Demographically, we know that the proportion of black beneficiaries is expected to increase because of the higher increase in longevity among blacks than among whites since the 1940s. For example, average life expectancy at birth among black women increased by around twenty-two years from 55.5 in 1940 to 77.4 in 2008, while the increase among white women was much less, at about thirteen years, from 67.3 to 80.8 (US Census Bureau, 2012). A consequence of this higher increase in longevity among blacks is that the proportion of black Medicare beneficiaries is expected to increase from 2.8 per cent in 2000 to about 7 per cent by 2030 (Administration on Aging, 2009).
Biologically, one major change in the human body from the twentieth century in the US is the continuous increasing prevalence of obesity (Flegal et al., Reference Flegal, Carroll, Ogden and Johnson2002). Existing research indicates that obesity-induced chronic diseases, such as diabetes, hypertension, and heart failure, will significantly increase both annual and lifetime Medicare spending (Finkelstein et al., Reference Finkelstein, Fiebelkorn and Wang2003; Thorpe et al., Reference Thorpe, Florence and Howard2004; Thorpe, Reference Thorpe2005; Cawley Reference Cawley2008; Yang and Hall, Reference Yang and Hall2008; Lakdawalla and Philipson, Reference Lakdawalla and Philipson2009). However, these results were estimated at the aggregate level without breaking down the Medicare population by gender or race. The applicability of these results for future Medicare generations, therefore, is dependent on an exceedingly strong assumption that the racial and gender compositions of the future population, as well as the prevalence of obesity by race and gender, will be similar to current retirees. Such an assumption will not be likely to hold. Currently, African American women have the highest obesity rate at 52.9 per cent, while other gender and racial groups have much lower rates, between 30 and 40 per cent, but projections of future obesity rates show a greater increase among whites and males than among blacks and females (Ogden, Reference Ogden2009).
When modelling the effect of BMI on Medicare costs, the dynamic relationship between gender, race, body weight, longevity, and health care expenditures needs to be addressed. On the one hand, the higher health care expenditures of the overweight and obese in a single year could be offset by shorter longevity (Flegal et al., Reference Flegal, Graubard, Williamson and Gail2005). On the other hand, body weight of older people changes in the ageing process, with decreasing BMI by age (Newman et al., Reference Newman, Yanez, Harris, Duxbury, Enright and Fried2001). Therefore, to consider only Medicare costs associated with cross-sectional body weight could potentially underestimate the financial burden of obesity.
In contrast to the attention given to the discussion of BMI, height, which is another important biomarker, has been largely ignored in the literature examining the effect of population biological changes on Medicare spending. The average height of the adult population in the US increased every decade in the twentieth century until the mid-century birth cohort (1955–1974) (Komlos and Lauderdale, Reference Komlos and Lauderdale2007). Height is an indicator of childhood nutrition, and has been found to be positively associated with better health status, including lower mortality and disability rates, and better cognitive functions (Costa, Reference Costa1993; Fogel, Reference Fogel1994; De Beer, Reference De Beer2004). But we are not aware of previous studies that have investigated the implications of the increasing population height on health care expenditures. Differently from the racial patterns of most bio markers, where white adults have obvious advantages, evidence shows that surviving black adults tend to be equally as tall as or even taller than whites (Deaton, Reference Deaton2007). Therefore, to understand the total influence of changes in BMI and height by gender and race on Medicare spending is of important policy significance.
In this study, we contribute to filling the knowledge gap by investigating how the demographic changes in gender and race, and the disparities in physical stature by gender and race among the baby boomers, could influence Medicare expenditure forecasting.
Data
We used two data sources in this study: the longitudinal Cost and Use files of Medicare Current Beneficiary Survey (MCBS) from 1992 to 2001, and the longitudinal Health and Retirement Study (HRS). The MCBS is used for the dynamic model estimation and simulation of lifetime Medicare expenditures of the 1920s to 1930s birth cohort, and the HRS is used for the descriptive analysis of future trends in weight and height among the near elderly.
MCBS survey and claims
The MCBS is a representative sample of Medicare beneficiaries in the United States. Collected annually by the Centers for Medicare and Medicaid Services (CMS), the Cost and Use files provide two types of data: individual surveys and medical care claims. The survey files provide information on demographic characteristics, including height, weight and health status (including mortality, functional status and existing chronic diseases), along with age, income, race, gender, and other sociodemographic characteristics. The claims’ files contain the diagnoses, charges, and Medicare payments for all respondents’ medical care events during the survey period, for both Medicare Part A and Part B services.
Survey respondents under age sixty-five, plus those with missing height, weight, gender, or race information, were excluded from our analysis. Due to the limited sample size, we also excluded all minorities except non-Hispanic blacks. Because we estimated the dynamic changes in health, body weight, and Medicare expenditures, we used only respondents with at least two years of observations. From an initial 45,966 individuals, this resulted in one analytical sample of 75,178 observations for 25,544 white individuals and a second analytical sample of 7,672 observations for 2,609 black individuals.
In addition to the basic information regarding demographic characteristics (age, gender, birth cohort, educational level, income, marital status) and smoking history, we also included variables that varied over time. These variables are not permanent characteristics like race or gender; they hold a dynamic relationship over the aging process. Changes in one of these variables will likely induce changes in other variables, making them critical to our analysis. These variables include the following:
Body Mass Index (BMI) is calculated by the self-reported height and weight from MCBS survey data by year.
Existing chronic diseases and acute medical events are two groups of variables that closely relate to body weight. The existing chronic disease variables are obtained from the survey data, including four types of diseases that are leading causes of death and functional disability among the elderly population (Ferrucci et al., Reference Ferrucci, Guralnik, Pahor, Corti and Havlik1997): cardio/cerebral vascular diseases, respiratory system diseases, cancer (excluding skin cancer), and diabetes (both type I and type II). Acute medical care events refer to inpatient or emergency care of clinical conditions related to these diseases except diabetes. These conditions are identified by the ICD-9 code of the primary diagnoses from the claims data.
Functional disability and mortality are measures of health capital. They are measured by a categorical variable based on the reported activities of daily life (ADL), instrumental activities of daily life (IADL), and death. Specifically, of the four responses, 0 represents the best health status of survivors without disabilities, 1 represents moderately disabled with limitations in at least one IADL and up to three ADLs, 2 represents severely disabled with limitations in three or more ADLs, and 3 represents death.
Annual Medicare Part A and Part B expenditures per person per year are obtained from the claims data and summarised at the year level. All expenditures are inflated to 2001 dollar values, based on the Medical Care Component of the Consumer Price Index published by the Bureau of Labor Statistics. Because Medicare Part D was not in effect until 2006, Medicare claims data for prescription drugs were not available, and we did not include prescription drug expenditures in our models.
HRS survey
Unlike the MCBS, the HRS is a cohort-based longitudinal survey that covers representative samples of several birth cohorts in the US from age fifty to death. We used the self-reported height and weight from the initial survey of three cohorts when their age was between fifty and sixty, including the following: the original Health and Retirement Study (original HRS) cohort born between 1931 and 1941, who are currently Medicare beneficiaries but younger than the birth cohort from the MCBS in our simulation; the war babies (WB) born between 1942 and 1947, the first of whom turned sixty-five in 2007; and early baby boomers (EBB), born between 1948 and 1953, who will turn sixty-five in 2013.
Econometric model
The dynamic model estimated in this study is a simultaneous equation system that contains four groups of equations introduced below.
Medicare expenditure equations
The centrepiece of the model includes two two-part models estimating annual Part A (A) and Part B expenditures (B). Because of the highly skewed distribution of medical care expenditures, the first part is a logit regression predicting the probability of any hospital stay or outpatient care in a single year. The second part is a linear regression on the natural log of the expenditures, if there are any. The independent variables include BMI, its square term, functional status (H), existing chronic diseases (E), acute medical events (S), demographics and smoking history (D). Let t represent the year of the observation, the first part is depicted as follows:
 \begin{equation*}
{\rm Prob(}q_t > 0) = \beta _0 ^q + \beta _1 ^q BMI_t + \beta _2 ^q BMI_t ^2 + \beta _3 ^q H_t + \beta _4 ^q E_t + \beta _5 ^q S_t + \beta _6 ^q D_t + \varepsilon _{q1}
\end{equation*}
\begin{equation*}
{\rm Prob(}q_t > 0) = \beta _0 ^q + \beta _1 ^q BMI_t + \beta _2 ^q BMI_t ^2 + \beta _3 ^q H_t + \beta _4 ^q E_t + \beta _5 ^q S_t + \beta _6 ^q D_t + \varepsilon _{q1}
\end{equation*}
The second part is depicted as follows:
 \begin{equation*}
q_t > 0) \,{=}\, \alpha _0 ^q + \alpha _1 ^q BMI_t + \alpha _2 ^q BMI_t ^2 + \alpha _3 ^q H_t + \alpha _4 ^q E_t + \alpha _5 ^q S_t + \alpha _6 ^q D_t + \varepsilon _{q2}
\end{equation*}
\begin{equation*}
q_t > 0) \,{=}\, \alpha _0 ^q + \alpha _1 ^q BMI_t + \alpha _2 ^q BMI_t ^2 + \alpha _3 ^q H_t + \alpha _4 ^q E_t + \alpha _5 ^q S_t + \alpha _6 ^q D_t + \varepsilon _{q2}
\end{equation*}
where (q ≡ A, B).
Acute health care events equations
We used three logit regressions to predict the probabilities of the three separate types of acute medical care events. The dependent variable in each equation is the onset of each one of the three acute medical care events (S = 1) during the survey period. The independent variables include BMI, its square term, functional status at the beginning of the survey period, demographics, and smoking history. This group of equations helps to measure the indirect effect of obesity on Medicare costs through its influence on the frequency of acute medical care events. Let k represent the type of acute medical care event (cardiovascular or cerebravascular diseases, respiratory diseases, or cancer), the equations are depicted as follows:
 \begin{equation*}
{\rm Prob}\left(S_t ^k = 1\right) \,{=}\, \delta_0 ^k + \delta _1 ^k BMI_t + \delta _2 ^k BMI_t ^2 + \delta _3 ^k H_t + \delta _4 ^k E_t + \delta _5 ^k D_t + \varepsilon _k
\end{equation*}
\begin{equation*}
{\rm Prob}\left(S_t ^k = 1\right) \,{=}\, \delta_0 ^k + \delta _1 ^k BMI_t + \delta _2 ^k BMI_t ^2 + \delta _3 ^k H_t + \delta _4 ^k E_t + \delta _5 ^k D_t + \varepsilon _k
\end{equation*}
Changes in body weight equation
We used one linear regression to estimate the annual change in body weight among survivors. The dependent variable is BMI at the beginning of a survey year (BMIt +1). The independent variable includes BMI at the beginning of the survey year (BMIt), major acute medical care events during the current year, the functional status and existing chronic diseases at the beginning of current year, demographics, and smoking history.
 \begin{equation*}
BMI_{t + 1} \,{=}\, \theta _0 + \theta _1 BMI_t + \theta _2 BMI_t ^2 + \theta _3 H_t + \theta _4 E_t + \theta _5 S_t + \theta _6 D_t + \varepsilon
\end{equation*}
\begin{equation*}
BMI_{t + 1} \,{=}\, \theta _0 + \theta _1 BMI_t + \theta _2 BMI_t ^2 + \theta _3 H_t + \theta _4 E_t + \theta _5 S_t + \theta _6 D_t + \varepsilon
\end{equation*}
Deterioration in functional status and mortality equation
We constructed one multinomial logit model to estimate the deterioration in functional status and probability of death, conditional on age, health status, chronic diseases, and body weight. The dependent variable is the functional status or death by the end of the survey year (Ht+ 1). The independent variables include BMI, its square term, functional status, and existing chronic disease at the beginning of the survey year, acute medical care events during the survey year, demographics, and smoking history. This equation helps to estimate the indirect effect of obesity on health care expenditures through its influence on deterioration of functional status and mortality.
 \begin{equation*}
{\rm Prob}(H_{t + 1} = h) = \gamma _0 ^h + \gamma _1 ^h BMI_t + \gamma _2 ^h BMI_t ^2 + \gamma _3 ^h H_t + \delta _4 ^h E_t + \delta _5 ^h S_t + \delta _6 ^h D_t + \varepsilon _h
\end{equation*}
\begin{equation*}
{\rm Prob}(H_{t + 1} = h) = \gamma _0 ^h + \gamma _1 ^h BMI_t + \gamma _2 ^h BMI_t ^2 + \gamma _3 ^h H_t + \delta _4 ^h E_t + \delta _5 ^h S_t + \delta _6 ^h D_t + \varepsilon _h
\end{equation*}
where (h = 0, 1, 2, 3).
Initial height and other conditions
We capture the effect of height on health through estimation of the effect of height on initial health conditions that have profound influence over the ageing process. Although the average height among elderly survivors gradually decreases over the ageing process due to loss of bone density, it is hard to detect from MCBS data because we have a maximum of five years of observations for one person. So we treat height as a permanent condition and also as exogenous instead of endogenous because height is primarily determined by childhood nutrition status.
Therefore, we used reduced-form equations to estimate the initial functional status and existing chronic diseases for the first year of observations, conditional on demographics, military service experience, birth cohort, and height, and exclude height in the dynamic equation. The effect of height on longevity and health care expenditures is transferred through its influence on initial health status from age sixty-five to death over the aging process.
MLE estimation and identification
Because of the dynamic and intertwining relationship between these factors, we estimated all the dynamic equations along with the initial conditions simultaneously among the white and black samples using maximum likelihood estimation (MLE).
The simultaneous system is identified by two mechanisms. First, besides initial height, we included several exogenous variables that help to explain the variations in body weight, general health status, and health care demand by geographic regions. These variables include area health care resources (number of physicians, hospital beds, etc.), and air quality at the county level. Second, we used the discrete random effect to control for any time-consistent and time-varying unobserved individual heterogeneity to help identification. Such a method has been used in previous literature with applications of the dynamic model and has demonstrated good consistency in estimation (Heckman and Singer, Reference Heckman and Singer1984; Goldman Reference Goldman1995; Mroz, Reference Mroz1999; Yang et al, Reference Yang, Gilleskie and Norton2009).
Simulation
The interpretation of the estimated parameters in each equation in the simultaneous equation system is difficult because the effects of the coefficients in one single equation spill over to other equations. Therefore, the best way to find the effect of demographic and biological characteristics in the elderly population on lifetime Medicare spending is to apply parameters from the estimation to one birth cohort and simulate their lifetime Medicare expenditures. Therefore, we collected the surveyed respondents born in the 1920s and 1930s, observed at age sixty-five from both the white and black samples, and applied the coefficients from the dynamic models to simulate all the direct and indirect effects of race, gender, height, and BMI on Medicare expenditures.
Specifically, we performed 2,000 replications of the simulation for each black or white individual using the parameters obtained from the simultaneous dynamic models with observed demographic features, social economic status, and initial height to first simulate the initial functional status and onset of chronic diseases at age sixty-five. In the year following age sixty-five, we simulated the probabilities of major acute medical care events, and natural logs of Medicare Part A and Part B expenditures. Then, we simulated the transition in functional status and BMI and updated both the functional status and BMI in the next year. All existing chronic conditions at age sixty-five were treated as permanent in all simulations for all ages. If a person was simulated to have a new type of acute medical care event, the programme updated that person to have the associated chronic diseases throughout the remaining lifetime until death. Such procedures are repeated each year with updated functional status, chronic disease, and BMI. If any individuals were simulated to die, the programme automatically stopped; otherwise, the programme continued until age 100. We retransformed all the log expenditures to real dollar values with the adjustment of the smearing factor when calculating lifetime Medicare expenditures (Duan, Reference Duan1983).
Results
Descriptive statistics
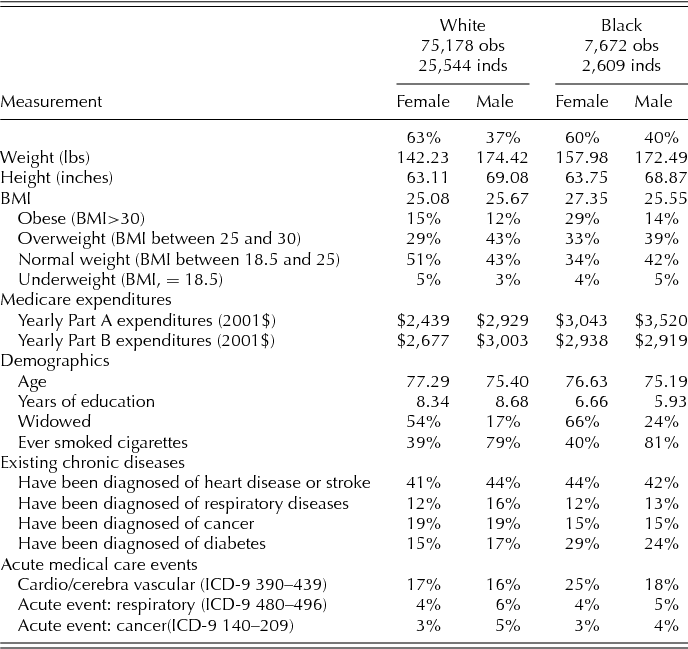
The summary statistics of the white and black study samples from MCBS levels are presented in Table 1. The average weight of black females is significantly higher than for white females (157 versus 142 lbs), but the average weight of black and white males is similar at slightly over 170 lbs. Black females are about 0.7 inches taller than white females (63.8 versus 63.1), and white males are slightly taller than black males (69.1 versus 68.9). Black females have significantly greater average BMI (27.4) and obesity rates (29 per cent) than male or any other racial groups. Annual Medicare Part A expenditures for black females and black males ($3,042 and $3,520) and annual Part B expenditures for black females ($2,938) are higher than that of white beneficiaries. But Part B expenditures for black males ($2,919) are lower than for white males ($3,003). Corresponding to obesity prevalence, black females have the highest rates of heart disease or stroke (44 per cent), and diabetes (29 per cent) as well as the highest probability of acute cardio vascular disease events (25 per cent).
Table 1 Characteristics of the white and black samples

In addition to the cross-sectional statistics, which could be biased by disparities in survival rate, we plotted the average weight, height, and BMI by gender, race, and age among survivors in Figure 1. We found different patterns for males and females. Similar to the summary statistics, we found no obvious racial disparities in height, weight, or BMI between white and black males. Among females, however, blacks are not only about 20 lbs heavier than whites in all age groups, but are also taller. Black females between age sixty-five and seventy-five are about 0.5 inches taller than white females on average, a difference that increases to approximately one inch for those age seventy-five and older. The average BMI for black women is about two units higher than for white women across all ages.
Figure 1. Weight, height, and BMI among survivors by gender, race and age
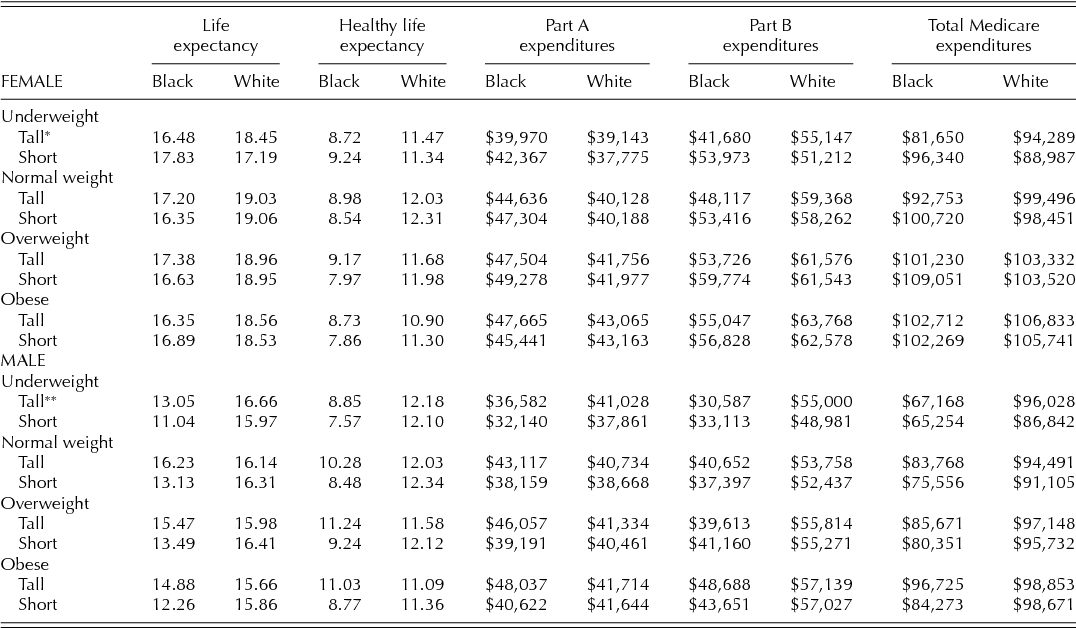
Lifetime Medicare expenditures by race, gender, baseline BMI and height
In Table 2, we summarise the simulation results regarding life expectancy from age sixty-five, healthy life expectancy (years without functional disability), and lifetime Medicare Part A and Part B expenditures, for the cohorts born in the 1920s and 1930s by gender, race, baseline BMI, and height at age sixty-five. The simulation is based on the parameters from the dynamic regression model, and the regression analysis results are presented in the Appendix tables. We divided the sample in each weight category into ‘tall’ versus ‘short’ groups, where the tall group consists of those taller than the mean height (64 inches among women, and 69 inches among men) at age sixty-five, and the short group consists of those shorter than the mean height.
Table 2 Lifetime expenditures by gender, race, baseline BMI and height
Notes: *Taller than mean height among female at age 65. ** Taller than mean height among male at age 65.
Among black females, weight is a predictor of longevity, but taller individuals have longer longevity than shorter individuals regardless of weight. For example, among the normal weight black females, life expectancy for the taller group is about 0.8 years longer than for the shorter group (17.2 versus 16.4 years). Among white females, the normal weight and the overweight groups have the longest life expectancy, but little difference between the taller and shorter groups appears within each weight category. The pattern for a healthy life expectancy is similar to that of life expectancy.
Overweight and obese females have higher lifetime Medicare expenditures (both Part A and Part B) than the normal weight group, regardless of race; however, racial differences appear in the spending patterns. Black women outspent white women in all weight categories in Medicare Part A, with the difference ranging from $600 (tall underweight) to $8,000 (short overweight). Within each weight category among black females, shorter individuals spent more than taller individuals, except for those who are underweight. Among white women, however, expenditures are similar for taller and shorter individuals within each weight category. White women significantly outspent black women in Part B expenditures in all weight categories except short-underweight.
Among males, those of normal weight have the longest life expectancy and healthy life expectancy, regardless of race. Among all weight categories of black males, taller individuals have significantly better health outcomes. For example, taller, normal-weight black males have almost three years longer life expectancy than shorter black males within the same weight category (16.2 versus 13.1 years). Among white males, no differences appear in health outcomes by height. Taller black males in the normal weight, overweight, and obese categories have higher Medicare Part A expenditures than white males in the same categories, but shorter white males have higher Medicare Part A expenditures than shorter black males in every weight category. Similar to the patterns among women, white males outspent black males in all weight categories in Part B expenditures. Overall, overweight and obese males have higher spending than the other weight categories, and white males have higher spending than black males in all weight categories.
Trends in obesity prevalence for current and future Medicare cohorts
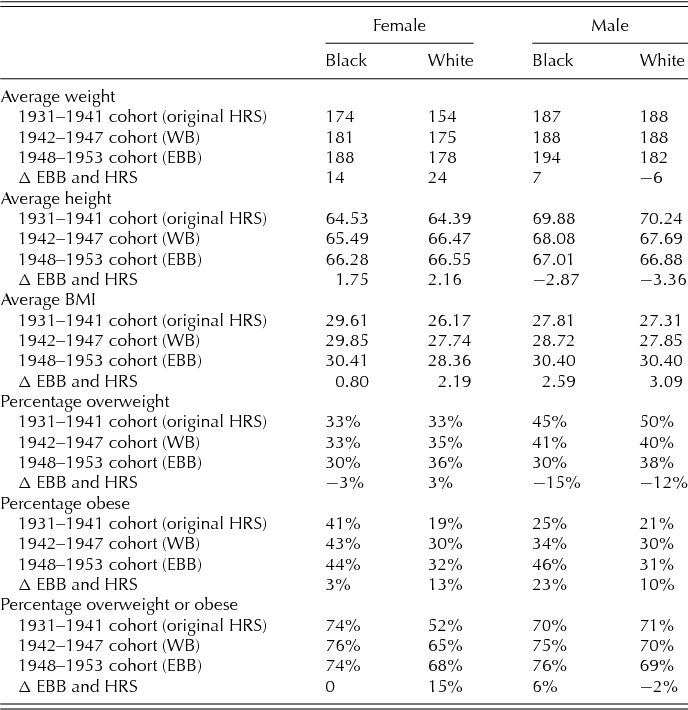
We present the average weight, height, BMI, and percentage of overweight and obese respondents between age fifty and sixty by birth cohort in Table 3. Average weight for both black and white females between fifty and sixty increases by cohort. The increase is larger among whites than blacks. White female early baby boomers are about 24 lbs heavier than the HRS cohort (178 lbs versus 154 lbs), but the increase is 14 lbs among black females (188 lbs versus 174 lbs). A 7 lb increase occurs in average weight among black males over the three cohorts, but a 6 lb decrease occurs in average weight among fifty- to sixty-year-old white males between war babies and early baby boomers. Among females, height among blacks increases by 1.8 inches, and height among whites increases by 2.2 inches; however, male height decreased among both blacks (2.9 inches) and whites (3.4 inches).
Table 3 Physical stature of future cohorts of Medicare beneficiaries between age 50 and 60
Combining the changes in weight and height, the two younger cohorts have higher average BMI and obesity prevalence than the original HRS sample at a similar age; however, no obvious racial differences appear in the magnitude of increases. The smallest increase in average BMI and obesity rates is observed among black females (1.8 units, or 3 per cent); white females show a 2.2-unit increase in BMI and a 13 per cent increase in obesity rate; white and black males show a 21 per cent (25 to 46 per cent) and 10 per cent (21 to 31 per cent) increase in obesity rates, respectively. The rate of overweight drops among black females (–3 per cent), black males (–15 per cent), and white males (–12 per cent), but increases slightly among white females. The majority of these respondents have been or will be eligible for Medicare and will carry the obesity epidemic into Medicare.
Discussion
Our study has three major limitations and therefore caution is needed in the interpretation of the results. First, we did not include the cost of Medicare Part D in our analysis. Obesity and related chronic diseases increase the demand and cost of outpatient prescription drugs under Part D. However, the literature also indicates that more generous coverage that encourages better adherence to prescription drugs could offset Medicare Part A and Part B expenditures (Yang et al., Reference Yang, Gilleskie and Norton2009; Congressional Budget Office, 2012a). Therefore, under the assumption of considering the effect of Part D, the total burden of obesity on Medicare could be either higher or lower than estimated in this study.
Second, our estimate of the per capita incremental cost of obesity is based on simulations using the MCBS data. The limitation of MCBS is that it follows the same beneficiary for three years at a maximum, and hence does not capture the whole picture of the ageing process. To combine the estimation results from MCBS and population characteristics from HRS to project the future cost of Medicare from obesity is the most practical solution we can find at hand. However, the best solution would be to develop more sophisticated models of longitudinal data that follow the respondents for a longer period to capture the dynamics of demographic change and the ageing process by birth cohorts.
Last, we used self-reported height and weight in this study, which tends to underestimate actual weight, but overestimate actual height, which leads to lower estimates of BMI (especially among women) (Villamore, Reference Villamore2001; Gillum and Sempos, Reference Gillum and Sempos2005; McAdams et al., Reference McAdams, Van Dam and Hu2007).
Conclusion
The first conclusion from our analysis is that demographic changes in Medicare beneficiaries will not exacerbate the financial pressure on Medicare other than through an increased number of beneficiaries due to racial disparities in longevity and access to outpatient care. The direct reason for lower per capita lifetime Medicare expenditures among blacks is lower Part B expenditures, which could be explained by less access to outpatient care. If the racial disparities in access to care are reduced or eliminated in the future, life expectancy and lifetime expenditures among blacks will likely increase as well.
Second, we conclude that the epidemic of obesity will bring greater financial challenges to the solvency of Medicare than indicated by previous studies. There will be disproportionally more obese older people and disproportionally higher health care expenditures per obese individual. Further, most of the new obese beneficiaries will be whites or males, who tend to have higher health care expenditures than the black females who currently have the highest obesity rate. Given the potential magnitude of increased spending associated with obesity on Medicare, promoting healthy lifestyles to stop the increase in obesity among key groups such as white males may be warranted.
There is a body of literature found that argues that despite the clinical effectiveness of chronic disease prevention, few of these interventions were cost-saving or cost-effective when taking a lifetime perspective (Neumann et al., Reference Neumann, Rosen and Weinstein2005; Cohen et al., Reference Cohen, Neumann and Weinstein2008). However, obesity prevention is more complicated than the prevention of the more ‘precisely’ defined diseases, like flu or cancer. It requires systematic change in culture and lifestyle to fight the disease, so that there is plenty of room for innovation in lifestyle change interventions to reduce the incremental cost. For example, a study by Thorpe and Yang in 2011 found that to replace the expensive individual behavioural change intervention program, which was tested effective from clinical trials of the Diabetes Prevention Programme (DPP), with a much less costly group session, would lead to 7 billion dollar Medicare net savings in ten years from diabetes prevention (Thorpe and Yang, Reference Thorpe and Yang2011). Indeed, from 2014 CMS has issued and implemented Intensive Behavioural Therapy to screen and treat obesity through behavioural therapy (Centers for Medicare and Medicaid Services, 2014).
Third, we found height has a significant influence on health outcomes and Medicare expenditures among blacks who have lower per capita Medicare expenditures, but we did not find such a pattern among whites. We are aware of recent research that found declines in the height of black female adults, possibly resulting from increasing obesity and malnutrition in childhood. This trend of increased obesity and declining height could be a double-edged sword for the health of black women and deserves further investigation (Komlos, Reference Komlos2010).
Fourth, the passage of the Patient Protection and Affordable Care Act (ACA) in 2010 poses new opportunities and challenges for dealing with the obesity epidemic. ACA promotes more attention to address racial health disparities and proposes to reward higher efficiency, instead of higher volumes of care, for Medicare beneficiaries. On the frontline of Medicare payment reform are the demonstrations represented by the Accountable Care Organization (ACO), Medical Homes, and bundled payment (Centers for Medicare and Medicaid Services, 2013). These innovations aim at a higher quality of chronic disease management that will increase access to preventive care among minority and underserved populations and save hospital care costs associated with acute complications.
However, the early evaluation results of these models were more sobering than encouraging. The report of CBO found that the physician group practice (PGP) model, which was the precedent model for ACO, did not lead to cost savings, despite a better quality of preventive care (Congressional Budget Office, 2012b). The same report also found that except for accounting book savings from bundled payment centering on very precisely defined clinical conditions, there is no evidence that bundled payment will lead to significant savings at population level. In addition, the most recent research study found that the medical home model neither saved costs, nor improved quality (Friedberg et al., Reference Friedberg, Schneider, Rosenthal, Volpp and Werner2014). Therefore, we foresee that in the next five to ten years, the majority of Medicare beneficiaries will still follow the FFS model, and our analysis is important to remind the public to be aware of the economic burden of the obesity epidemic.
In addition to the US, other western countries are facing similar challenges from obesity. For example, the National Health Service (NHS) of the United Kingdom reported in 2014 that 66 per cent of adult men, and 61 per cent of adult women in England are overweight or obese (Health and Social Care Information Centre, 2014). Similarly, according to the most recently published study, Canada is facing a historically high obesity rate. One in four Canadian adults is obese (Cotay et al., Reference Cotay, Katzmarzyk, Janssen, Dawson, Aminoltejari and Bartley2013). Moving to the southern hemisphere, the World Health Organization (WHO) categorised Australia as one of the fattest countries in the world, with an overweight rate of 67.4 per cent in 2009 (Streib, Reference Streib2009). The single player health care systems in the UK and Canada, as well as Medicare in Australia, are facing the challenge of treating obesity-related chronic diseases under a fixed budget with demands for cost-effectiveness, and are actively looking for innovative behavioural interventions at the community level to reverse the obesity epidemic and promote public health. With the increasing diversity in population characteristics in the UK, Canada, Australia, and European Union countries, and the universal challenge of balancing cost, equality, effectiveness, and efficiency of health care systems, the results of this article will reinforce the need for most western countries to take the challenge of obesity seriously.
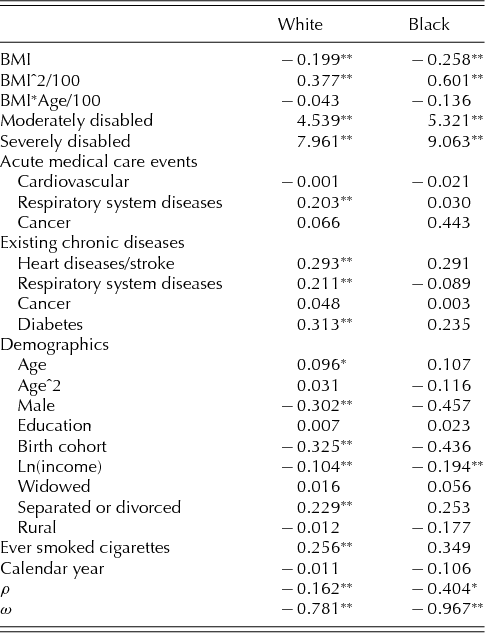
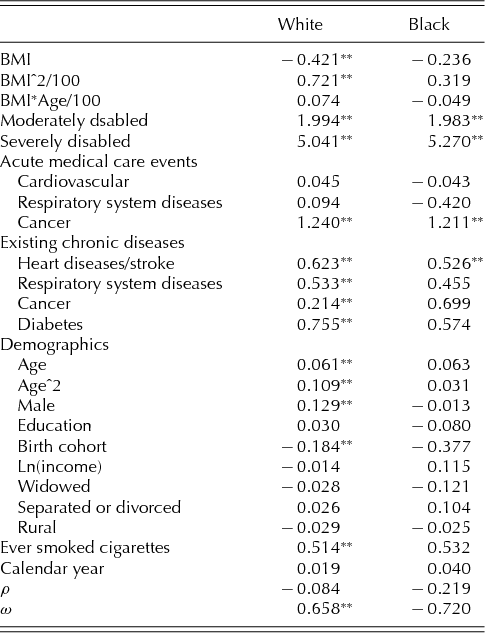
Technical Appendix: Regression results of the key variables from the dynamic model
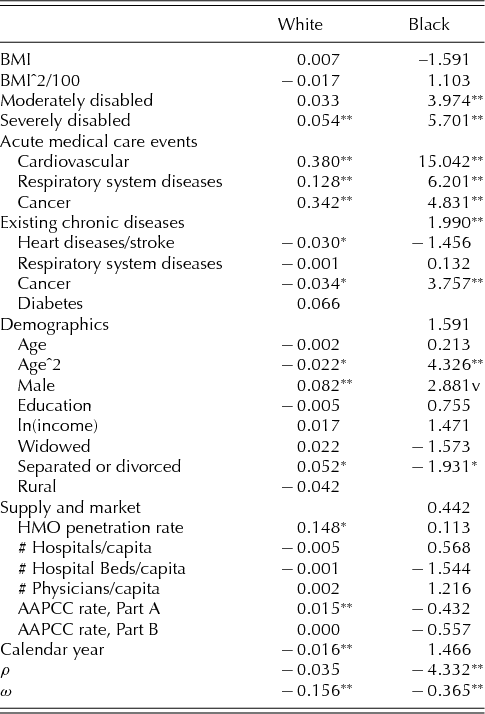
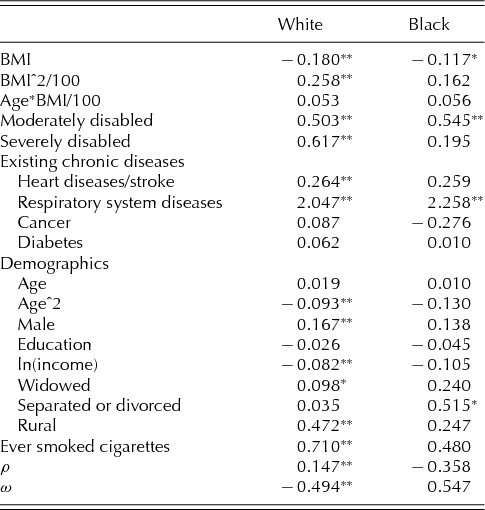
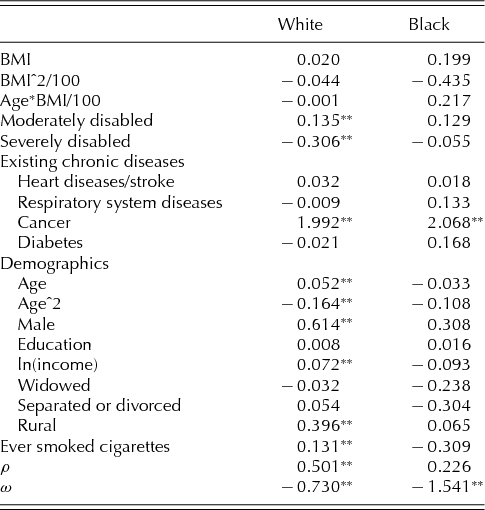
Table A1 Probability of any Part A expenditures
Table A2 Log Part A expenditures conditional on any expenditure
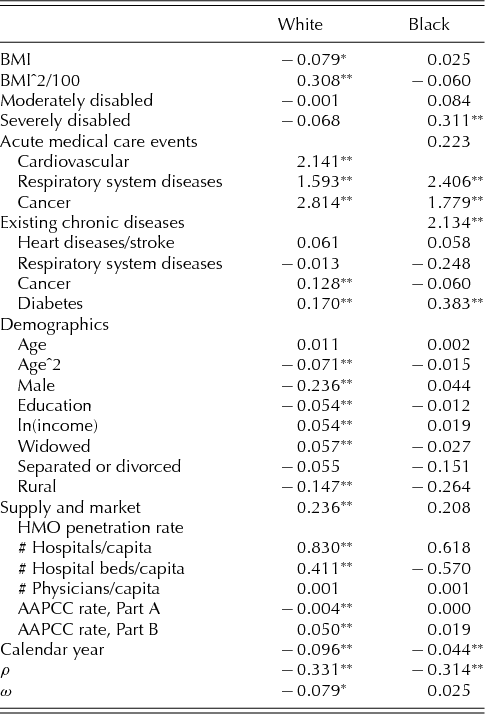
Table A3 Probability of any Part B expenditures
Table A4 Log of Part B expenditure conditional on any expenditure
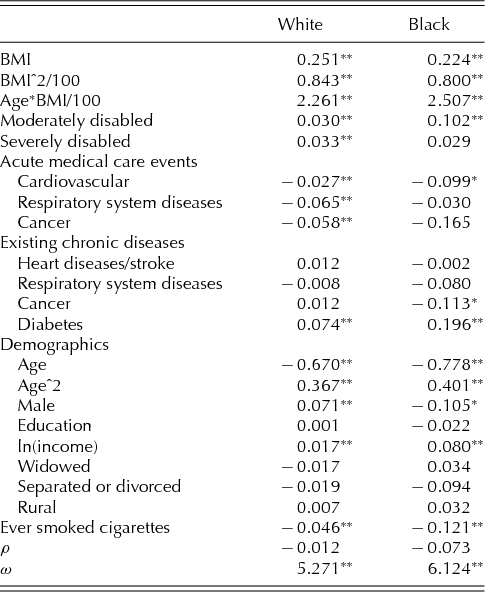
Table A5 Probability of acute health care event: cardio/cerebra vascular disease (ICD-9 390–439)
Table A6 Probability of acute health care event: respiratory system disease (ICD-9 480–496)
Table A7 Probability of acute health care event: cancer (ICD-9 140–209)
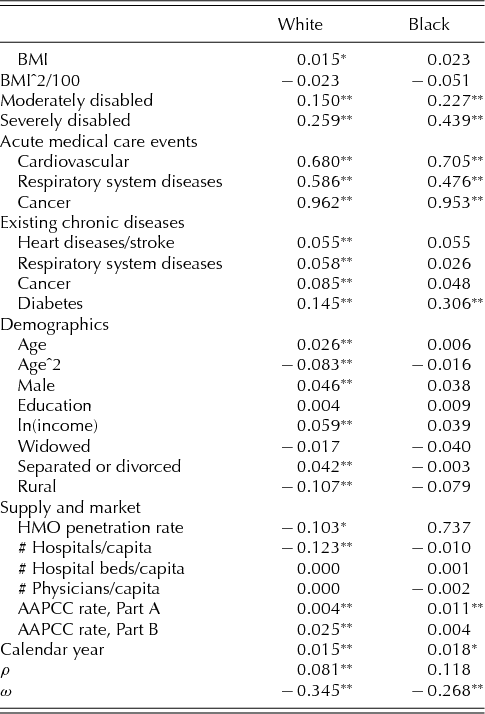
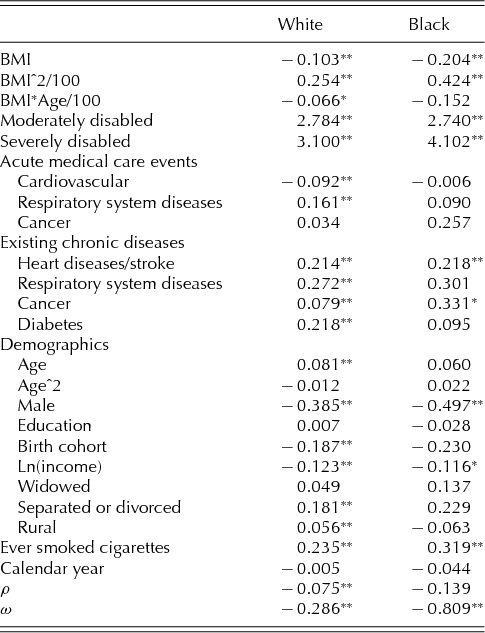
Table A8 Annual change of BMI
Table A9a Probability of being moderately disabled
Table A9b Probability of being severely disabled
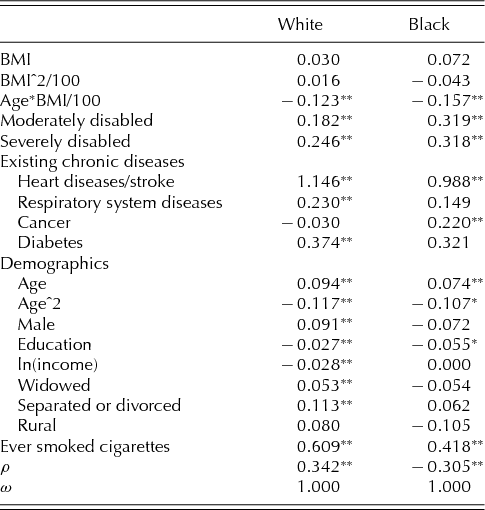
Table A9c Probability of death