


Introduction
One of the defining characteristics of any welfare state is argued to be its commitment to social citizenship. As a core idea of a welfare state, social citizenship is famously operationalised by the concept of de-commodification. According to Esping-Andersen (Reference Esping-Andersen1990: 37), it refers to ‘the degree to which individuals, or families, can uphold a socially acceptable standard of living independently of market participation’. At its most fundamental level, this extent separates eighteen industrialised economies into three groups: liberal welfare regime with the minimal commitment; conservative/corporatist welfare regime with the medium commitment; and social democratic regime with the extensive commitment.
Although Esping-Andersen’s work has been one of the most influential contributions to the field of comparative welfare state development, his is also subject to heavy criticisms. Most relevant in our discussion is Bambra’s critique where Esping-Andersen’s focus on cash benefits (e.g. sickness, pensions and unemployment) ignores the importance of welfare services in de-commodification effort. By incorporating health de-commodification index, she suggests that five, not three, groupings are possible. This also reinforces the criticism against the very concept of welfare regimes as it is ‘not a workable basis for research…Regime analysis springs from the assumption that the welfare policy package of most countries reflects a coherent practical and/or normative understanding of public welfare. This assumption is false’ (Kasza, Reference Kasza2002: 283-84). Policy specific research is therefore advocated as a more promising research avenue.
The omission of healthcare is clearly an important oversight not least because it is often one of the biggest spending items for most industrialised economies. But perhaps more importantly, we should rethink the central objectives that welfare programmes are set out to achieve. Esping-Andersen once said, ‘[F]ew can disagree with T. H. Marshall’s (Reference Marshall1950) proposition that social citizenship constitutes the core idea of a welfare state’ (Reference Esping-Andersen1990: 21). This may be true if we speak the language of ‘welfare state’. But this may not be so true if we deal with a specific welfare provision. It is of course valuable to examine how decommodifying healthcare is across different economies. But what happens if the commitment to social rights is never a priority? Perhaps what we are measuring is not what those economies are trying to achieve. By taking healthcare as a critical field of social policy, this article seeks to identify how those economies that do not necessarily prioritise social rights fare in achieving various healthcare objectives.
Welfare capitalism and health policy
Critical of the argument that the sphere of welfare capitalism is only limited to those capitalist states ‘so strongly affected by their social policy as identifiable as welfare states’, Holliday (Reference Holliday2000: 707-08) claims that it should be extended to those ‘capitalist states that do engage in social policy, while also subordinating it to other policy objectives’. In his classification of East Asian economies, social rights are either non-existent or very minimal. Where extended, they are closely linked to productive activity. In other words, ‘[t]here is no autonomous sphere for social policy as there is in those countries claiming to be welfare states’ (Wilding, Reference Wilding2008: 22). For them, the commitment to social citizenship is not a defining characteristic. ‘Instead, economic objectives are paramount, and set the tone for society as a whole… Productivist states are defined by their economic policy. The rest is incidental’ (Holliday, Reference Holliday2000: 148).
Similar to Esping-Andersen’s, Holliday’s work suffers from the lack of attention to service provisions. While the productivist elements are highlighted, it overlooks the possibility that other objectives may be present in welfare provisions. More often than not, public policies serve more than one purpose. For instance, Piven and Cloward (Reference Piven and Cloward1971) highlight that tax and social security policies could function both as regulatory and redistributive policies. Healthcare policies may primarily be about healing the sick. But they could also be about ensuring the workforce remains healthy to be productive or about redistributing risks from the rich to the poor. Much like old-age pensions that may be primarily about preventing poverty in old age or about income maintenance after retirement depending on the kind of specific policy instruments they use, healthcare systems too may present a priority order not necessarily aligned with the objective of healing the sick.
Depending on the objectives the healthcare system is believed to have achieved, a different list of performance measures can make an entry. For welfare scholars who develop a health de-commodification index, the performance of healthcare system is measured by ‘the extent to which an individual’s access to healthcare is dependent upon their market position and the extent to which a country’s provision of healthcare is independent from the market’ (Bambra, Reference Bambra2005a: 33). The index is constructed by using proxy indicators of (1) private health expenditure as a percentage of GDP; (2) private hospital beds as a percentage of total bed stock; and (3) the percentage of the population covered by the healthcare system. Applying this to the East Asian context, Yu (Reference Yu2012) concludes that East Asian economies should be located into different clusters of healthcare de-commodification. Here, Hong Kong has the highest score while Taiwan lowest. Singapore and Japan belong to the same group in between.
For other healthcare scholars, healthcare is best measured by its breadth, (i.e. percentage of population covered), depth (i.e. percentage of health cost covered) and scope (i.e. type of health services covered) (Chisholm and Evans, Reference Chisholm and Evans2010). From here, various international organisations come up with their own league tables. Perhaps, the most encompassing attempt came from the World Health Organisation (WHO). In its 2000 World Health Report, the WHO used five indicators to assess best healthcare performers: (1) overall level of population health (0.25); (2) health inequalities (0.25); (3) system responsiveness (0.125); (4) inequalities in responsiveness (0.125); and (5) equitable healthcare financing (0.25). Whereas this component measures how well a country has done in reaching different goals, the Report also produces the performance measure that highlights what might have been achieved with the resources available in the country. Each measure of goal attainment and performance combined, overall health system performance is presented as a league table. France topped the chart, followed by Italy. Singapore was ranked at six, while Japan just made the top ten. Norway was the only Scandinavian country that came within the top twenty. South Korea (hereafter Korea) performed poorly at fifty-eight, lower than Malaysia (forty-nine) and Albania (fifty-five).
Surprisingly, the standard image of the countries in the world of welfare capitalism does not appear to be reflected in this league table. Nordic countries almost always top the chart in any kind except this WHO Report (2000), for instance. Perhaps this reinforces the argument that most welfare state modelling is constructed around cash benefits whereas welfare services present a strong internal welfare state inconsistency. It may also be the case that healthcare systems in Nordic countries may not be as desirable as commonly understood. That Singapore and Japan outperform most welfare states in Europe is also surprising particularly given the fact that the Report considers fairness as of greater importance than health outcome per se. Here, it is interesting to note that the Report has been criticised in its conceptual, methodological and technical aspects. One particularly interesting point is that it makes a value judgment that applies to all countries by ‘objectives which were not their own’ (Richardson et al., Reference Richardson, Wildman and Robertson2003: 358).
Does the case of Singapore identified in the Report mean that its healthcare system deviates from our standard understanding of its productivist objectives? How about Japan and the rest of East Asian economies for that matter? Without making a value judgement, this article examines the policy objectives of healthcare in East Asia from four broad, yet most basic angles: social, medical, economic and political. It first establishes how different types of healthcare are aligned with these dimensions. It then reviews the health system arrangement in China, Japan, Korea, Taiwan, Singapore and Hong Kong. What follows is the empirical examination of where each of these economies is located along the aforementioned policy objectives. The final section discusses the policy and theoretical implication of the findings, followed by a brief conclusion.
Types of healthcare system
Healthcare is often the second biggest spending item in social expenditure terms and constitutes by far the largest area of welfare state service delivery for most European welfare states (Bambra, Reference Bambra2005b: 196). East Asian economies, except Japan, spend substantially lower than their Western counterparts on health. As Figure 1 shows, Singapore and Hong Kong’s spending levels are considerably lower than Japan’s despite their relative wealth expressed in terms of GDP per capita.

Figure 1. Health Expenditure vs GDP per Capita.
Notes: SGP (Singapore); HKG (Hong Kong SAR China); TWN (Taiwan); CHN (China); KOR (Korea, Republic); AUS (Australia); UK (United Kingdom); FIN (Finland); CAN (Canada); JPN (Japan); SWE (Sweden); DEU (Germany); FRA (France); USA (United States of America).
Sources: World Bank (2017); Food and Health Bureau (2018); Ministry of Health and Welfare (2015); National Statistics, Republic of China (n.d.).
None of the economies examined here presents either a completely market-based or a free healthcare system (for a review of different types of healthcare systems, see Wendt et al., Reference Wendt, Frisina and Rothgang2009; Freeman and Frisina, Reference Freeman and Frisina2010; Reid, Reference Reid2010; Toth, Reference Toth2016). Japan comes closest to the Bismarckian model of social insurance with a multi-payer system whereas the Chinese system is very fragmented with two national programmes at city level, creating hundreds of insurers (He and Wu, Reference He and Wu2017). Hong Kong, on the other hand, has no compulsory health insurance system to date (He, Reference He2017). The majority of residents does not hold a medical insurance policy on a personal or family basis either (Yeung and Wai-Sum, Reference Yeung, Wai-Sum, Leung and Bacon-Shone2006). As of 2016, only 35.5 per cent of the population were covered by medical insurance purchased by individuals while 48.9 per cent of the total population had neither employer-provided group medical benefits nor individually purchased insurance (Census and Statistics Department, 2017). Instead, healthcare is so heavily subsidised that universal access is guaranteed without people being insured. Although the services are not free at the point of service delivery, its heavy reliance on tax and government revenues reflects the British-style socialised healthcare. In between, Korea and Taiwan share the system of national health insurance with a single-payer system. Singapore presents a unique case in that it combines the supply-side subsidy model (as in Hong Kong) with Singapore’s innovation of a mandatory savings account (Medisave).
Healthcare systems in East Asian economies are not uniform and the types themselves do not necessarily represent strong productivist characteristics particularly in that healthcare policy is not sacrificed by outright economic productivism. Few would call tax and government financed healthcare services growth-oriented, for instance. Nonetheless, Hong Kong and Singapore are two of the East Asian economies that are often classified as quintessentially productivist (Holliday, Reference Holliday2000; Wilding, Reference Wilding2008). The system of national health insurance with a single payer is also generally considered more progressive than a multi-payer system (Hussey and Anderson, Reference Hussey and Anderson2003). Hong Kong’s heavily subsidised healthcare is financed by progressive taxation. Singapore’s seemingly regressive arrangement of Medisave can be considered to strengthen ‘ownership’ thereby promoting growth. But government subsidies to public hospitals enable healthcare fees to remain low. In short, there seems to be much more to the East Asia’s healthcare system than its presumed productivist role of enhancing human capital and sustaining a flexible workforce.
In comparison, East Asian economies share three important characteristics. First, the practice of out-of-pocket payment is more or less the norm. This seems to be closely related to the belief that welfare provisions, either in the form of cash benefits or benefits-in-kind, should not be deemed as entitlement. Second, with the exception of Japan, the private share of healthcare revenue in East Asia is rather high not necessarily because of high private health insurance membership as in the case of Australia and the USA but because of the high rate of out-of-pocket payment (see Figure 2). Third, all share the principle of liberal practice of medicine (i.e. practicing the profession as a self-employed physician) with a strong presence of private healthcare providers. In Hong Kong, for instance, although public hospitals outnumber private hospitals by nearly four times (42:11), which is the reason why it is ranked at the top of the healthcare de-commodification index (see Yu, Reference Yu2012), over 70 per cent of primary care is provided through private doctors (Department of Health, 2017; Wei et al., Reference Wei, Yin, Wong, Griffiths, Zou and Shi2017).
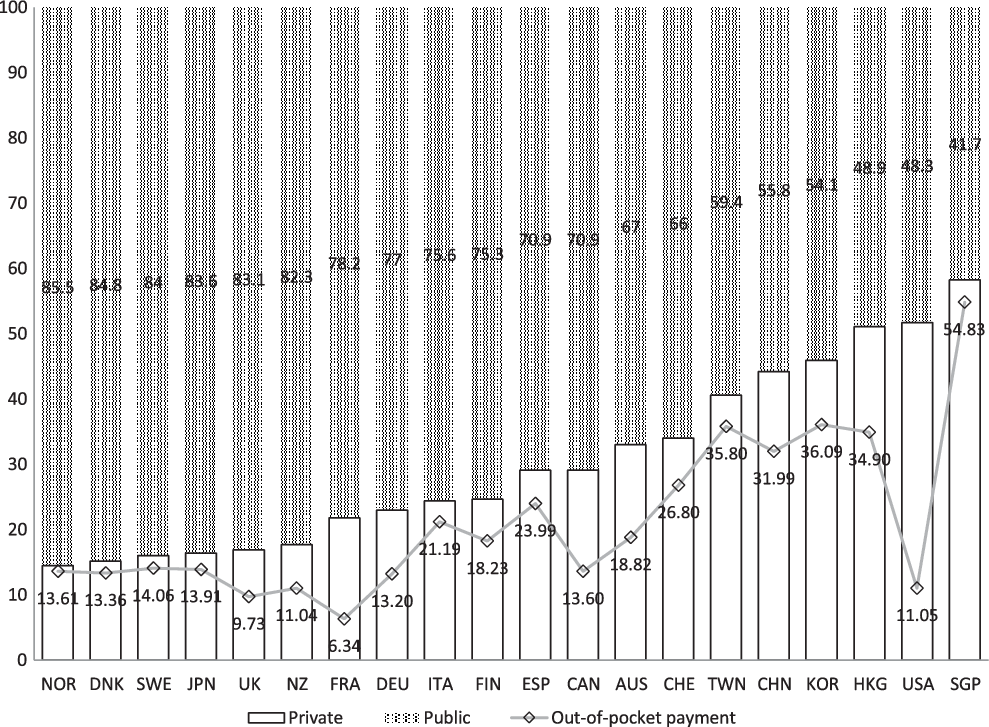
Figure 2. Public and Private Share of health expenditure as per cent of total expenditure on health, 2014.
Notes: Taiwan 2013; Hong Kong 2012; NOR (Norway); DNK (Denmark); SWE (Sweden); JPN (Japan); UK (United Kingdom); NZ (New Zealand); FRA (France); DEU (Germany); ITA (Italy); FIN (Finland); ESP (Spain); CAN (Canada); AUS (Australia); CHE (Switzerland); TWN (Taiwan); CHN (China); KOR (Korea, Republic), HKG (Hong Kong SAR China); USA (United States of America); SGP (Singapore).
Sources: World Bank (2017); OECD Stat (n.d.); Cheng (Reference Cheng2015b); Wong and Tin (Reference Wong and Tin2015).
In the following section, each country’s healthcare system is reviewed with a particular focus on the structure and financing, and some unique issues that result from them.
China
The Chinese healthcare system used to be characterised typical of the communist state. Before 1978, all health facilities were owned, funded and operated by the government and/or state-owned enterprises (SOEs) or rural cooperatives. Health resources were limited and advanced medical technology unavailable. But equal access to basic healthcare was granted to all. The commune system provided healthcare to its members in rural areas through the Cooperative Medical System. In urban areas, the SOEs organised and financed clinics and hospitals (Ramesh et al., Reference Ramesh, Wu and He2014).
The post-liberalisation period saw the disbanding of the commune system. The reform of SOEs produced millions of redundant workers who also lost their healthcare safety net. In 1994, the pilot healthcare system for urban employees was introduced. In 1998, the Urban Employees Basic Medical Insurance (UEBMI) was launched, funded by both employer’s and employee’s contributions. The share is not equally divided: employers shoulder 75 per cent (6 per cent of payroll) whereas employees pay 25 per cent (2 per cent of payroll). Whereas retired employees remain covered, most rural residents and those outside formal employment were left uninsured.
The liberalisation also led to the sharp drop of government revenues. Clinics, hospitals and other public health agencies turned to engage in revenue-generating activities. Particularly vulnerable was the majority of the rural population, only 7 per cent of which were covered by some kind of healthcare in 1999. From 2006, the New Rural Cooperative Medical Scheme (NRCMS) began to cover all rural residents. The government pays 80 per cent of the premium while households pay the remainder (Liu et al., Reference Liu, Wong and Liu2016). The rest of the urban population is subject to the 2009 Urban Residents Basic Medical Insurance (URBMI). The government pays more than 70 per cent of the insurance premium while individuals pay the rest (Liang and Langenbrunner, Reference Liang and Langenbrunner2013).
These three schemes vary in financing, management, payment and services. The urban employee’s scheme (UEBMI) has the highest average premiums and most generous while the rural scheme (NRCMS) is the cheapest and least generous. As of 2011, 95.7 per cent of the population were insured, compared to 10 per cent in 2003 despite the fact that both URBMI and NRCMS remain voluntary (Yu, Reference Yu2015). There was a decline in out-of-pocket payment as a proportion of total health expenditure between 2000 and 2012 but the share of out-of-pocket payments in disposable personal income has continued to rise. The growing inequality between the urban and rural areas also sparked the need to integrate the schemes for urban and rural residents (Liu et al., Reference Liu, Wong and Liu2016). In 2016, the merger took place to form the Urban Rural Residents’ Basic Medical Insurance (URRBMI) in order to improve administrative efficiency and equality. But many provinces maintained the separate financing mechanisms of URBMI and NRCMS (Zhu et al., Reference Zhu, Zhang, Yuan, Zhang and Zhang2017). In order to speed up the process, the National Healthcare Security Administration and the Ministry of Finance issued a circular to urge seven provincial level regions that had not yet fully integrated their rural and urban medical insurance schemes to speed up the process and establish a unified system by the end of 2019 (Xinhuanews, 2019).
Japan
The 1961 National Health Insurance Act enabled compulsory health insurance to cover the whole population. Similar to the Bismarckian model, the healthcare system is structured around occupational lines with multiple insurers. Large firms are required to establish their own health insurers/societies for their employees (Uchida, Reference Uchida, Aspalter, Uchida and Gauld2012). Small firms, on the other hand, form a single association that provides collective health insurance. Other professional occupations including government employees form separate nation-wide associations.
These occupational health insurance schemes cover about 50 per cent of the whole population. The self-employed, unemployed and pensioners aged below seventy-five belong to another scheme, known as National Health Insurance. Over 1,700 municipalities and 165 National Health Associations run this scheme, covering around 30 per cent of the population. Both employers and employees share approximately the same share of contributions. For the people aged seventy-five or over who constitute around 11 per cent of population, the government and the younger population cross-subsidise about 90 per cent of the total cost (NIPSSR, 2014).
Despite varying premiums and membership, insurance benefits are standardised throughout all public health insurance schemes (NIPSSR, 2014). Of various schemes, the scheme for the elderly aged seventy-five or over has the highest expenses. Its fiscal imbalance is likely to worsen not least because the proportion of this age group is on the rise, recording 13.8 per cent of the total in 2017 (Kyodo News, 2018). National Health Insurance is not too different in the sense that state subsidies exceed insurance premiums collected. Ironically, however, National Health Insurance is more expensive for equivalent wages than occupational health insurance premiums, half of which is paid for by employers.
The significant proportion of the public funds meant around 38.8 per cent of total healthcare expenditure came from taxes in 2014. Out-of-pocket payments constituted 12.5 per cent and the remaining 48.7 per cent came from health insurance premiums. Japan’s population fell for the seventh consecutive year in 2017 while people aged sixty-five or over accounted for a record of 27.7 per cent. There were 1.2 million fewer people enrolled in the three health insurance schemes than there were in 2015 while about 8.55 per cent of people who were supposed to pay premiums did not (The Japan Times, 2017). All this means that the practice of fair and sustainable cross-subsidisation is to be a critical component of system maintenance.
Korea
About 97 per cent of the whole population is insured under National Health Insurance. Introduced in 1977, it initially covered workers in large firms and expanded its coverage to workers in the small firms and the self-employed in the next twelve years. The remaining 3 per cent belongs to the tax-funded health assistance scheme. Similar to Japan, over 350 insurance societies constituted three different types of insurance schemes. This multiple insurer system meant varying contribution rates across insurance societies although health insurance benefits were regulated to be identical. In 2000, the merger of all societies into a single insurer established a uniform contribution schedule and benefits package (Kwon, Reference Kwon2009).
The contribution rate for employees has been on the rise from 4.31 in 2005 to 6.24 per cent of the gross monthly salary in 2018. Employers and employees typically share the insurance premium equally except private school teachers and staff where the government contributes an extra 20 per cent (Kwon et al., Reference Kwon, Lee and Kim2015). For the self-employed, the householder is responsible for the whole contribution. In both cases, higher income earners above a certain threshold are required to pay extra while there is also a ceiling on the total amount of contribution. In 2017, this only applied to 0.02 per cent of all employees (Hankook Ilbo, 2017). In large part, this is to ensure the system to be equitable between different income groups.
This single payer system relies heavily on private sectors for service delivery. A fast expansion of universal healthcare brought about a steep increase in healthcare utilisation, creating an unprecedented opportunity for private providers to grow. However, the fee-schedule for healthcare providers is strictly enforced and private providers have not been allowed to opt out of National Health Insurance, thereby establishing a purchaser-provider split from the very beginning. As of 2012, for instance, almost all clinics and about 94 per cent of hospitals were privately owned (Kwon et al., Reference Kwon, Lee and Kim2015). Similar to Japan, there is no gate keeping (e.g. GPs) in the healthcare system. Patients are not required to register with primary care doctors and can choose their own doctors and hospitals albeit at extra cost. Medical nomadism is of concern especially in relation to the increasing level of healthcare expenditure.
Taiwan
Prior to the introduction of national health insurance in 1995 a range of separate insurance schemes was in operation covering industrial workers (1950), government employees (1958), farmers (1985) and low-income households (1990). With an exception of government employees, however, dependents were not covered, leaving around 47 per cent of population uninsured. The 1995 reform achieved universalisation of healthcare and greater risk pooling by merging the existing ten insurers into one.
Unlike Japan and Korea where healthcare is financed equally by employers and employees, employers and the government play a bigger role in Taiwan. For publicly or privately-owned enterprises, for instance, the contribution split between employees, employers and the government is 30:60:10. For private school teachers, it is 30:35:35 while the government pays 70 per cent of the total contribution for government employees and members of farmers’, fishermen’s and irrigation associations. It is only the self-employed who are to pay the full contribution on their own. For the sake of simplicity, national health insurance premiums were set at a flat rate (i.e. 4.91 per cent of salary in 2014). But this mostly payroll-based contribution proved to be insufficient and was deemed inequitable. For this reason, the 2013 reform introduced a supplemental premium scheme and incorporated various other sources of income based on capital gains other than a regular payroll. This increases the base the premium draws on from 60 to 90 per cent of Taiwan’s total national income (Cheng, Reference Cheng2015a).
Similar to Korea, healthcare facilities are mostly private non-profit. Public hospitals in 2012 for instance accounted for 16 per cent of all hospitals (Lu, Reference Lu2014). Although for-profit hospitals are not permitted, these non-profit facilities behave more or less like profit-making organisations even though by definition those profits must be reinvested to healthcare-relevant activities. Taiwan’s market-oriented healthcare delivery system is often considered one of the key contributors to rising healthcare costs (Ramesh, Reference Ramesh2004). The freedom given to the patients in their choice of doctors and hospitals is also a shared feature with Korea and Japan, the effect of which is also a factor in the difficulty of controlling the overall healthcare cost.
Singapore
Singapore’s hospitals are mostly public with over 80 per cent of hospital beds in public hospitals (Ministry of Health, Singapore, n.d.). But these public hospitals ‘operate an internal system of cross-subsidization via tiered pricing’ (Phua, Reference Phua, Preker and Harding2003: 452). With greater autonomy granted to them by the first comprehensive National Health Plan in 1983, they ‘function more like private hospitals than public institutions under a central control’ (Haseltine, Reference Haseltine2013: 10). The Plan also announced the creation of Medisave to which employers and employees share half of around 8 to 10.5 per cent of monthly salary depending on their age. Saved money, which earns interest set by the government, is then withdrawn to pay the hospital bills. Every year, the government decides a maximum cap around S$ 54,500 (in 2018), at which point people divert their contribution into old-age savings account within the Central Provident Fund (CPF). Innovative in design, this individual health fund was Singapore’s answer to the increasing financial implications of the British-style health system and to encourage consumers to assume greater responsibility (Ramesh, Reference Ramesh2004).
The fact that Medisave plays no part in risk-pooling raised a question about what may happen to those with chronic illnesses and those who have been unable to save enough. For the former, a voluntary catastrophic insurance scheme, MediShield, was introduced in 1990. Later extended to become MediShield Plus and eventually replaced by MediShield Life in 2015, the new development made this MediShield scheme compulsory and reduced the coinsurance rate. Nevertheless, this complementary measure to Medisave is not exactly a scheme that pools risk as elderly people pay a considerably higher premium than young people. For the people with pre-existing conditions, an additional premium is required too (Yin and He, Reference Yin and He2018). For the latter, Medifund, a means-tested endowment fund, was introduced to provide a safety net in 1993 with a starting capital of S$200 million. Yet the fact that any extra funding to this is subject to the future budget surplus is a way to ensure that Medifund is not an entitlement.
The healthcare system in Singapore is therefore highly individualised and at the same time heavily regulated. This is also evident in the way public and private facilities are split. In the area of primary healthcare, private doctors and clinics provide approximately 80 per cent of the country’s needs. In the area of hospital beds, in comparison, public hospitals account for more than four-fifths of all hospital beds. This is in stark contrast to the weak share of public hospital beds in Korea and Taiwan. The government owns and operates sixteen of the twenty-six hospitals (Ministry of Health, Singapore, 2018). But these hospitals enjoy a considerable degree of operational autonomy (Ramesh, Reference Ramesh2008). At the same time, they are run in a similar way to private hospitals in that public hospitals offer different types of wards ranging from a full-fee paying single room (Class A) that costs S$466.52 per day to a heavily subsidised nine-bedded room (Class C) that costs S$35 per day (SingHealth, 2018). Fees in public hospitals, even in the case of non-subsidised treatment and ward, are considerably cheaper than in private hospitals. But there is almost no entirely free healthcare. Out-of-pocket payments form a large share of healthcare expenditure (Ramesh, Reference Ramesh2008).
Hong Kong
With absence of any mandatory insurance or savings scheme, the healthcare system of Hong Kong is organised around a heavily subsidised public healthcare sector. In 2015, public hospitals provide around 90 per cent of hospital medical service and 29 per cent of outpatient medical service (Department of Health, 2016). For the patients admitted to a general ward of public hospitals, effective of 18 June 2017, flat fees of HK$75 (approximately US$9.5) for admission and HK$120 (US$15.5) for daily maintenance are charged whereas a visit to an out-patient clinic costs HK$50 (US$6.5) (Hospital Authority, Hong Kong, 2020). This represents around 95 per cent of subsides to the cost, providing one of the most accessible healthcare systems for all.
Unlike Singapore, there is no differentiation of ward classes in public hospitals. Private hospitals, on the other hand, do not receive public subsidies. Nor are there any fee regulations in the private sector. Despite this seemingly strong role of the public sector, the proportion of private insurance (out of total expenditure on health), including employer-provided group medical benefits, remains one of the highest of the industrialised economies. In 2012, for instance, the figure for Hong Kong was 14.5 per cent compared to 3.1 in China, 2.5 in Japan, 5.5 in Korea and 2.5 in Singapore (Tin et al., Reference Tin, Song, Tsoi, Lee, Chong, Lam, Yeung, Ma and Maw2016: 23). The latest introduction of Voluntary Health Insurance Scheme from April 2019 is likely to increase the figures further (Chan, Reference Chan2018). Also notable is the high proportion of out-of-pocket payment in the total expenditure on health. While Singapore has the highest rate of 60.1 per cent, households in Hong Kong fork out 36.1 per cent from their own pocket, a figure similar to that in China (34.3) and Korea (35.9) but much higher than in Japan (14.3) (Tin et al., Reference Tin, Song, Tsoi, Lee, Chong, Lam, Yeung, Ma and Maw2016: 23). Out-of-pocket (OOP) payments in Hong Kong are ‘predominantly used to pay for services obtained from private health care providers. Payments to private ambulatory care providers and traditional medical providers account for about 75.0 per cent of all OOP payments’ (Langenbrunner and Somanathan, Reference Langenbrunner and Somanathan2011: 79-80).
As is the case in the tax-financed healthcare system, two issues have been particularly pressing. The first is the rise in the long waiting time for specialist outpatient care. The Research Office of the Legislative Council Secretariat (2016/17) reports that the median waiting time was sixty weeks, up from fifty-two weeks in 2012/13 for orthopaedics and traumatology, the areas with an increasing demand due to population ageing. But for the 10 per cent who faced the longest wait, referred to as the 90th percentile, the waiting period was 133 weeks, up from 107 weeks in 2012/13 (South China Morning Post, 2015). As a way of reducing the number of public hospital visits, the health voucher scheme was introduced in 2014 to encourage the elderly to use private healthcare services (The Government of the Hong Kong Special Administrative Region, 2019). However, it was reported that the scheme had not been cost-effective as the number of public hospital visits in fact increased (South China Morning Post, 2019). Ageing population put pressure on health expenditure too (Hsiao et al., Reference Hsiao, Yip, Rannan-Eliya, Kwok, Bir, Cao, Eggleston, Fitzner, Jakab, Liao, Neoh, Shen, Somanathan, Vryonides and Yaracaris1999). From 1989/90 to 2014/15, total health expenditure grew at an average annual rate of 6.0 per cent in real terms which was faster than the corresponding increase of 3.9 per cent in GDP. As a result, total health expenditure as a percentage of GDP went up from 3.6 per cent in 1989/90 to 6.0 per cent in 2014/15 (Food and Health Bureau, 2018).
Healthcare policy objectives in East Asia
‘At the most basic’, Hudson et al. (Reference Hudson, Kühner and Lowe2008: 91) argue, ‘the goal of healthcare policy can be defined as ensuring that citizens have access to adequate medical provision’. Over the past two decades or so, however, this seemingly straightforward goal has been complicated by what Palier and his colleagues call ‘healthcare policy quadrilemma’ (Palier, Reference Palier2005; Pavolini et al., Reference Pavolini, Palier, Guillén, Pavolini and Guillén2013).
‘The reforms in the health care systems are as if torn between four often (potentially) contradictory. Each reform makes a choice between these objectives: social (guaranteeing the same health services for all), medical (obtaining better health results), economic (ensuring the financial viability and the competitiveness of the systems) and political (obtaining the satisfaction of users and providers, their freedom of choice and of action, the absence of waiting lists …)’ (Pavolini et al., Reference Pavolini, Palier, Guillén, Pavolini and Guillén2013: 220).
A social objective is perhaps most closely related to the notion of social rights as it ensures equal access to healthcare for all. Tax-financed healthcare available to all for free at the point of service delivery is often referred to as satisfying this objective best (Reid, Reference Reid2010). A medical objective is to ensure the highest quality of care and to produce the highest health status for the population. Arguably, these two objectives should form the very basis of any healthcare reform. Nevertheless, Pavolini et al. (Reference Pavolini, Palier, Guillén, Pavolini and Guillén2013) argue that none of their eight country cases demonstrate that medical objectives are central in their reform trajectories. Instead, the importance of an economic objective has grown considerably under the conditions of ageing population and austerity. Interestingly, this is the dimension that East Asia is known to have managed rather well (Wagstaff, Reference Wagstaff2007). Particularly significant is the growing attention given to a political objective which is to provide a satisfactory healthcare system both to the patients and professionals. Indeed, the primary focus on healthcare reforms in England, Spain and Sweden has been to reduce waiting times and to open choices for patients. Added to this is the question of who pays and who benefits which can be both social and economic objectives. Nevertheless, as it produces who gets and who doesn’t, it is essentially about the exercise of power, hence political (cf. Lasswell, Reference Lasswell1936).
Despite this complexity, comparative welfare state literature tends to focus on the social objective more than the other three. However, it is entirely possible to conceive that the remaining three objectives may be as important, if not more, as the first if the primary objective of welfare provision is not necessarily about promoting social rights.
None of the economies under investigation can afford to ignore altogether considerations of quality of care. None thinks health inequality is better than health equality or that a rise of healthcare cost is something to be desired (cf. Goodin et al., Reference Goodin, Headey and Muffels1999). Perhaps more importantly, none of them places exactly the same order of priorities. In fact, there are important differences of emphasis that do not correspond to the standard image observed in the comparative welfare state literature. How do these differences fare in empirical terms?
Social objectives, conceptualised as to ‘guarantee equality of access to healthcare for all’ (Pavolini et al., Reference Pavolini, Palier, Guillén, Pavolini and Guillén2013: 193), are expressed in terms of population coverage; the extent of out-of-pocket payment; and the proportion of public health expenditure. All economies claim universal coverage of healthcare. In more accurate terms, the greater the proportion of the population covered, the higher the public funds allocated to health. Indeed, Xu et al. (Reference Xu, Soucat, Kutzin, Brindley, Maele, Toure, Aranguren Garcia, Li, Barroy, Flores Saint-Germain, Roubal, Indikadahena and Cherilova2018: 37) find that ‘a higher share of public spending on health is associated with better service coverage’. Hence, both public health expenditure as a percentage of GDP and public share of total health expenditure are used to understand the extent of the population coverage. The share of out-of-pocket payment is often used to capture the degree of ‘risk privatization’ thereby undermining the equality of access (Wendt et al., Reference Wendt, Kohl, Mischke and Pfeifer2010: 180). Singapore has by far the highest out-of-pocket payment rate whereas Japan has the highest public health spending as a percentage of GDP (Cheng, Reference Cheng2015b) as well as the highest public share of health expenditure as a percentage of total expenditure on health (see Figure 2).
Medical objectives are about ‘guaranteeing the highest quality of care and the optimum condition of health for the population’ (Pavolini et al., Reference Pavolini, Palier, Guillén, Pavolini and Guillén2013: 193). The quality of care is operationalised by using healthcare resources (e.g. number of hospital beds and number of physicians). Often used as a proxy for medical care inputs, the relative number of physicians is found to be strongly and significantly associated with premature mortality (Bloor et al., Reference Bloor, Hendry and Maynard2006). The relative number of hospital beds is also widely assumed to be measures of the availability of resources (Ginsburg and Koretz, Reference Ginsburg and Koretz1983) and instruments of good health (McGranahan, Reference McGranahan1972). These input measures are complemented by health conditions of the population in terms of life expectancy and infant mortality. Japan provides the highest level of healthcare resources (Figure 3) while Hong Kong has the highest life expectancy as well as the lowest infant mortality rate. China has the lowest number of physicians per 1,000 population and recorded the lowest life expectancy and highest infant mortality (World Bank, 2017; Food and Health Bureau, 2017).

Figure 3. Healthcare Resources, 2010.
Notes: Japan & Korea, 2009; Singapore 2011; SGP (Singapore); CAN (Canada); SWE (Sweden); UK (United Kingdom); USA (United States of America); DNK (Denmark); CHN (China); OECD (Organisation for Economic Cooperation and Development); AUS (Australia); HKG (Hong Kong SAR China); CHE (Switzerland); FIN (Finland); TWN (Taiwan); FRA (France); DEU (Germany); KOR (Korea, Republic); JPN (Japan).
Sources: World Bank (2017); Food and Health Bureau (2017); Ministry of Health and Welfare (2013).
Economic objectives are to ‘make the health care system not too expensive in order not to hinder economic growth’ (Pavolini et al., Reference Pavolini, Palier, Guillén, Pavolini and Guillén2013: 205) and measured in terms of health expenditure as a percentage of GDP; annual growth rate of per capita health expenditure; and fiscal prudence of healthcare system. As Singapore’s first finance minister put it, ‘not spending more than one earns’ is central to fiscal prudence (Lim, Reference Lim2017: 104). Because controlling costs and the increase in health expenditure is central to economic objectives, a higher percentage in these indicators suggests weak performance (see the radar chart formula below). As of 2014, Japan’s health expenditure was the highest at 10.23 per cent of GDP, followed by Korea (7.37), Taiwan (6.30), Hong Kong (5.70) and China (5.55). Singapore spent the least at 4.92 (World Bank, 2017; Food and Health Bureau, 2017). As Figure 4 shows, China’s health expenditure per capita has experienced the fastest growth rate of 17.07 during the period of 1995 and 2014, followed by Korea’s (8.3) and Singapore’s (7.15) while Japan’s is the lowest (1.4). Perhaps China’s status as a transition economy may have played a part while Japan’s status as an established welfare state explains its low growth rate. In terms of fiscal prudence, expressed in the form of public health expenditure as a percentage of total tax revenue, Taiwan records 29.9 per cent, followed closely by Japan (26.7). China, Korea and Singapore are located towards the bottom end of the spectrum, indicating that health expenditure takes around 14-16 per cent of the total tax revenue (Figure 5).


Figure 5. Financial Prudence of Healthcare System, 2014.
Notes: USA (United State of America); TWN (Taiwan); CHE (Switzerland); JPN (Japan); DEU (Germany); CAN (Canada); UK (United Kingdom); AUS (Australia); HKG (Hong Kong SAR China); AUT (Austria); FRA (France); FIN (Finland); CHN (China); KOR (Korea, Republic); SGP (Singapore).
Sources: OECD Stat; OECD Tax Database; WHO (2017); Food and Health Bureau (2018).
Political objectives are closely associated with political priorities given to the consideration of health inequity (Regidor, Reference Regidor2004) and the satisfaction of the population (Pavolini et al., Reference Pavolini, Palier, Guillén, Pavolini and Guillén2013). They are assessed by the level of public satisfaction and the extent of fair and equitable distribution of healthcare. Singapore achieved the highest approval rate of 85.9 per cent, followed by Taiwan (83.1) and China (72). Japan has the least support of 43 per cent (Figure 6). Hong Kong’s approval rate which is slightly better than Japan’s seems rather surprising as the tax-financed universal healthcare system tends to have high public support (Wendt et al., Reference Wendt, Kohl, Mischke and Pfeifer2010). Yet, it is important to note that its healthcare system, characterised by lower health expenditure, lower level of public funding and higher private co-payments, may come close to the ‘later developed’ National Health Service (NHS) systems in Southern Europe rather than the ‘mature NHS systems of Denmark, Finland and Great Britain’ (Wendt et al., Reference Wendt, Kohl, Mischke and Pfeifer2010: 187).

Figure 6. Public Satisfaction with Healthcare System.
Sources: MoHW, Taiwan (2016); Munro and Duckett (Reference Munro and Duckett2016); MoH, Singapore (2015); Kwon et al. (Reference Kwon, Lee and Kim2015); Murata and Aramaki (Reference Murata and Aramaki2015); He (Reference He2018).
Fair and equitable distribution of healthcare is measured by both the concentration index which is an index of the distribution of payments and Kakwani index which is the difference between the concentration index and the Gini coefficient of inequality (O’Donnell et al., Reference O’Donnell, van Doorslaer, Rannan-Eliya, Somanathan, Adhikari, Akkazieva, Harbianto, Garg, Hanvoravongchai, Herrin, Huq, Ibragimova, Karan, Kwon, Leung, Lu, Ohkusa, Pande, Racelis, Tin, Tisayaticom, Trisnantoro, Wan, Yang and Zhao2008). A positive value of concentration index indicates that the rich contribute a larger share than the poor. In all East Asian economies, except Singapore, the better-off pay most for healthcare (Figure 7). For the Kakwani index, a positive number indicates that the share of payments made by the rich is greater than their share of total ability to pay whereas a negative number indicates that payments fall as a proportion of ability to pay increases (Figure 8). Hong Kong has the most progressive system while Japan has the least. It should be noted that the data from O’Donnell et al. are rather outdated to reflect the detailed policy changes presented earlier. Nevertheless, it presents a useful reference point especially when considered together with the latest policy development. Singapore is not included in the study by O’Donnell et al. either (Reference O’Donnell, van Doorslaer, Rannan-Eliya, Somanathan, Adhikari, Akkazieva, Harbianto, Garg, Hanvoravongchai, Herrin, Huq, Ibragimova, Karan, Kwon, Leung, Lu, Ohkusa, Pande, Racelis, Tin, Tisayaticom, Trisnantoro, Wan, Yang and Zhao2008). Hence, a separate analysis has been conducted to examine the proportion of monthly household expenditure spent on healthcare by income quintiles (Figure 9). It shows that low income households spend a higher proportion of their expenses on healthcare, suggesting a reverse redistribution.

Figure 7. Who pays for Healthcare?
Source: O’Donnell et al. (Reference O’Donnell, van Doorslaer, Rannan-Eliya, Somanathan, Adhikari, Akkazieva, Harbianto, Garg, Hanvoravongchai, Herrin, Huq, Ibragimova, Karan, Kwon, Leung, Lu, Ohkusa, Pande, Racelis, Tin, Tisayaticom, Trisnantoro, Wan, Yang and Zhao2008).

Figure 8. Progressivity of Healthcare Financing.
Source: O’Donnell et al. (Reference O’Donnell, van Doorslaer, Rannan-Eliya, Somanathan, Adhikari, Akkazieva, Harbianto, Garg, Hanvoravongchai, Herrin, Huq, Ibragimova, Karan, Kwon, Leung, Lu, Ohkusa, Pande, Racelis, Tin, Tisayaticom, Trisnantoro, Wan, Yang and Zhao2008).

Figure 9. Proportion of monthly household expenditure spent on healthcare by income quintiles (%).
Source: Department of Statistics, Singapore (2019).
Put together, Figure 10 presents the extent to which health policy objectives are performed in each country. The radar chart represents a separate indicator of policy performance with a score of 1 indicating the best performance and 0 the worst. Under each objective, economies were scored on the basis of the value of each indicator.
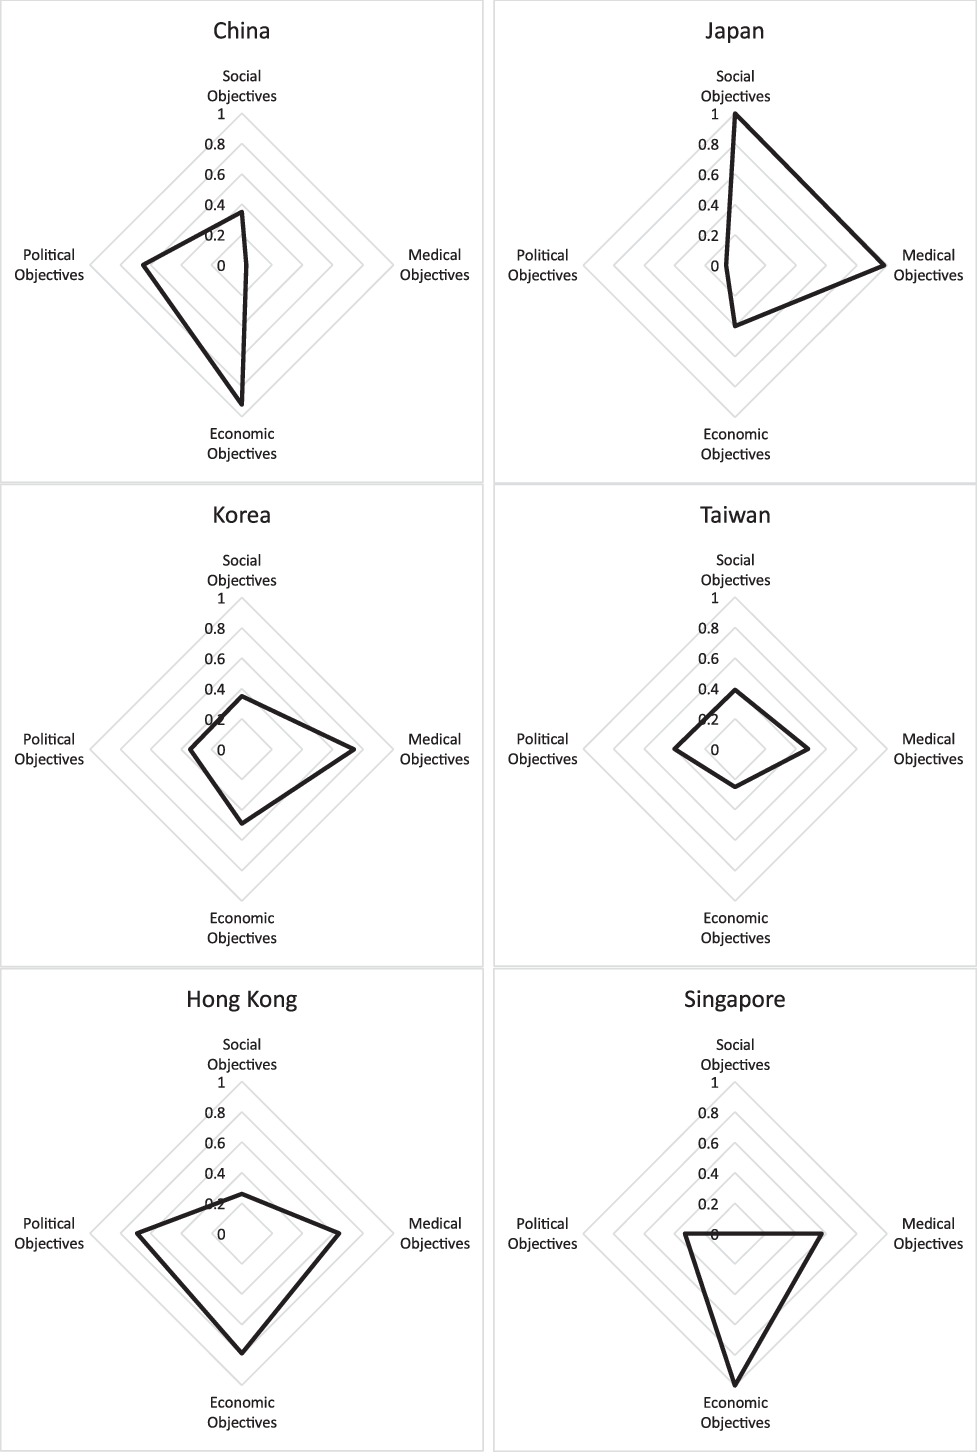
Figure 10. Healthcare Policy Objectives in East Asia.
Source: Author’s own calculation, data drawn from above figures 1 to 9.
The scoring is reverted where the higher value of indicator refers to the lower standard. For instance, the lowest score is given to the economy with the highest rate of out-of-pocket payment whereas the highest score was given to the economy with the lowest annual growth rate of health expenditure.
For all indicators where the minimum values represent the benchmark (i.e. out of pocket payment, infant mortality, health expenditure as per cent of GDP, health expenditure per capita annual growth, public health expenditure as per cent of total tax revenue), the formula is as follows: r = 1 – ((min-x)/min) * F where F = min/(min-max); x = original value; r = radar chart standardised value. Thus, for x = min, r = 1 – 0 = 1, x = max, r = 1 – 1 = 0. For all indicators in which the maximum values represent the benchmark (e.g. number of hospitals, no of physicians), the formula is as follows: r = 1 – ((max-x)/ max) * F) where F = max/(max=min); x = original value; r = radar chart standardised value. Thus, for x = max, r = 1 – 0 = 1, x= min, r = 1 – 1 = 0 (for further discussion, see Mosley and Mayer, Reference Mosley and Mayer1999).
Japan’s healthcare system is geared towards addressing social and medical objectives with relatively high standards while China’s presents a higher emphasis on economic and political objectives with a poor degree of achieving medical objectives. Hong Kong’s system serves the political, medical and economic objectives well while its performance on social objectives is rather weak. This may seem somewhat surprising as its heavily subsidised system with progressive financing guarantees equal access to government-provided healthcare (He, Reference He2017). But Hong Kong does have one of the highest private share of health expenditure and out-of-pocket payment which would have undermined the equality of access to healthcare. Singapore’s is heavily focussed on economic objectives with a very poor standard of social objectives. Korea’s and Taiwan’s healthcare systems do not appear to have a stronger emphasis on any particular dimension. Nonetheless, they seem to be most well rounded of all.
Conclusion
The present analysis raises three important implications. First, it is not just that healthcare in East Asia does not neatly fit into the welfare regime typology (Ramesh, Reference Ramesh2004; Yu, Reference Yu2014). All economies, except Singapore, have a strong element of redistribution built into their healthcare system. Not all economies are as progressive as the tax-financed healthcare system in Hong Kong. But in most it is the rich who pay more despite their somewhat regressive social insurance financing. In other words, healthcare systems in East Asia are redistributive, albeit in varying degrees. This is rarely highlighted in the comparative welfare state regime literature of East Asia (for further discussion Hwang, Reference Hwang, Irving, Fenger and Hudson2015).
Second, it is often more difficult to determine exactly what it is that a particular area of social policy is meant to achieve. In the case of healthcare, we observe a varying degree of priorities concerning social, economic, political and medical objectives. Which of these objectives the system of healthcare must address as a first and foremost priority is perhaps a moot point. They are not necessarily mutually exclusive. Nor are they necessarily complementary to each other. Equal access to healthcare is clearly very important, for instance. But there is no clear reason to believe that this is more important than maintaining a high standard of healthcare or a sustainable system of healthcare.
This brings us to a final point about whether the notion of social rights is the best conceptual lens to evaluate the system of healthcare across different economies. As Pierson (Reference Pierson1994: 5) pointed out, the welfare state is, after all, a ‘concept covering a range of disparate public policies’. Are these disparate public policies meant to be addressing social rights? Is this even desirable? In normative and prescriptive terms, perhaps the answer is yes. But whether this will guide us to see what it is rather than what it should be is questionable. Our commitment to social rights as a central conceptual framework to understand the welfare state may blind us to see what is out there beyond the formalised world of welfare capitalism as we know it.


