


Introduction
Weed control in arable fields mainly relies on herbicide applications. Because of their environmental consequences (e.g. water pollution, loss of biodiversity), it is now necessary to limit the use of herbicides by taking into account all the cropping system components. Most weed seeds survive for several years in the soil and form persistent seed banks (Burnside et al., Reference Burnside, Wilson, Weisberg and Hubbard1996; Murdoch and Ellis, Reference Murdoch, Ellis and Fenner2000; Conn et al., Reference Conn, Beattie and Blanchard2006). Depending on their longevity in the soil, seeds can germinate several years after their production and species can thus reappear in a field from which they have been absent for several years. Consequently, weed control must not only focus on yield loss at an annual scale but be reasoned over several years to be efficient in both the short- and long-term (Clements et al., Reference Clements, Weise and Swanton1994).
Modelling is an essential tool to design and evaluate integrated cropping systems for weed management because of the multi-year scale of weed management and because of the wide variation in agricultural practices (rotations, tillage, etc.) and the complexity of their interactions (Holst et al., Reference Holst, Rasmussen and Bastiaans2007). One of the most complete models of cropping system effects was developed for Alopecurus myosuroides Huds. (ALOMYSYS; Colbach et al., Reference Colbach, Chauvel, Gauvrit and Munier-Jolain2007), and we are now working on a multi-specific version. Among the weed life-cycle processes, seed-bank losses due to in-situ seed mortality in the soil play a crucial role in long-term dynamics in these models. These mortality processes must be assessed and modelled independently from weed seed germination because the latter is influenced differently by cropping system components (effect of seed depth, date of tillage, etc.; Boyd and Van Acker, Reference Boyd and Van Acker2003). Seed mortality results from seed embryo ageing caused by physiological or chemical damage (Priestley, Reference Priestley1986), pathogen attacks by bacteria or fungi (Chee-Sanford et al., Reference Chee-Sanford, Williams, Davis and Sims2006; Wagner and Mitschunas, Reference Wagner and Mitschunas2008), or seed predation by vertebrates or invertebrates (Hulme, Reference Hulme1998). Here, we focused on the two first causes as they are responsible for major seed loss processes in deeply buried seeds (Westerman et al., Reference Westerman, Liebman, Heggenstaller and Forcella2006) which are frequent in European cropping systems mainly based on ploughing. Numerous studies have analysed weed seed longevity or persistence in fields (Egley and Williams, Reference Egley and Williams1990; Burnside et al., Reference Burnside, Wilson, Weisberg and Hubbard1996) and results for more than a thousand species are summarized in a database (Thompson et al., Reference Thompson, Bakker and Bekker1997). However, the majority of data in the literature characterizes the persistence of seed banks, without distinguishing in-situ seed mortality (seed ageing, pathogen attacks) from losses due to seed germination. Moreover, in some studies, seed viability after recovery from burial is measured only through germination tests, and dormant seeds are often counted as non-viable seeds (e.g. Roberts and Boddrell, Reference Roberts and Boddrell1983; Burnside et al., Reference Burnside, Wilson, Weisberg and Hubbard1996). Results on seed-bank persistence in the literature are therefore difficult to extrapolate to different cropping systems.
As a result, the seed mortality parameter remains to be estimated for a large number of species. However, it is not feasible to study every species experimentally. Our objective was thus to search for generic relationships between in-situ seed mortality and easily measured traits (Weiher et al., Reference Weiher, Werf, Thompson, Roderick, Garnier and Eriksson1999) that characterize the species, by studying species with contrasted traits, as proposed by Keddy (Reference Keddy1992). According to Violle et al. (Reference Violle, Navas, Vile, Kazakou, Fortunel, Hummel and Garnier2007), a trait is any morphological, physiological or phenological feature that is measurable at the individual level. Seed persistence has thus been correlated with seed mass and shape (Thompson et al., Reference Thompson, Band and Hodgson1993), and seed coat thickness (Davis et al., Reference Davis, Schutte, Iannuzzi and Renner2008). Small spherical seeds, which penetrate the soil more easily, often display higher persistence, probably because their increased burial depth helps delay their germination and thus decreases short-term seed loss. Seed mortality might be related to the composition of the seed coat, which forms a physical and chemical barrier to preserve the seed and the embryo from parasite attacks as well as temperature and water fluctuations (Mohamed-Yasseen et al., Reference Mohamed-Yasseen, Barringer, Splittstoesser and Costanza1994). Relationships between seed mortality and seed composition have also been analysed in the literature. Lipid-rich seeds were thus expected to have a low survival rate because of lipid peroxidation reactions which contribute to the production of free radicals and thus to seed ageing (Corbineau et al., Reference Corbineau, Gay-Mathieu, Vinel and Come2002). However, seed half-life was not clearly correlated with either seed composition (lipids, proteins and carbohydrates; Priestley, Reference Priestley1986; Ponquett et al., Reference Ponquett, Smith and Ross1992), or phenolic compounds, which are expected to protect the seed from oxidation (Hendry et al., Reference Hendry, Thompson, Moss, Edwards and Thorpe1994; Davis et al., Reference Davis, Schutte, Iannuzzi and Renner2008).
The aim of the present study was to find functional relationships between in-situ weed seed mortality and easy-to-measure seed traits (mass, shape, dimensions, composition). Data analyses accounted for the phylogenetic relatedness between the species studied. We chose species with contrasting seed masses, shapes, types of reserves and representative of the weed flora found in north-western European cropping systems. Seeds were buried in the soil and recovered sufficiently frequently to detect a possible seasonal pattern of in-situ seed mortality, as previously observed for a weedy form of Beta vulgaris (Sester et al., Reference Sester, Dürr, Darmency and Colbach2006). In addition, we looked at possible correlations between in-situ seed mortality and seed persistence synthesized for a large range of species by Thompson et al. (Reference Thompson, Bakker and Bekker1997), in order to take advantage of this large database. Data in the literature on seed mortality, measured in similar conditions to our protocol, were used to increase the range of species we studied to search for correlations with seed traits.
Materials and methods
Seed burial and recovery
Experiments consisted of burying seed bags and then excavating them every 2 or 6 months over a period of 2 years to analyse seed viability. Seeds of 13 weeds (Table 1) commonly encountered in north-western Europe in fields under intensive cropping systems, and contrasted in their seed mass, shape and composition, were collected at full maturity in 2006 in fields near Dijon (47.317°N, 5.017°E, 220 m above sea level) in Burgundy, France. Immediately after collection, samples of 100 seeds were placed in nylon (Tergal) bags (mesh size 400 μm). For large seeds, 100 g of field soil (15% moisture content) were added to prevent direct contact between the seeds (Table 1). The soil (0.35 clay, 0.57 silt and 0.08 g .g− 1 sand) was collected from a field at the burial site (see below). The site was not managed during the burial experiment and weeds that emerged were not removed, to ensure a permanent plant canopy and to avoid soil cracks. Seed bags were placed at the bottom of openwork baskets, with three bags per species and basket. The baskets were filled with soil and buried at a depth of approximately 30 cm in a field at the INRA experimental station at Dijon-Époisses (France) in 2006. The depth of 30 cm was chosen to minimize seed loss by germination during the experiment. Every 2 months over the next 2 years, two baskets (i.e. a total of six bags) of five species were randomly excavated. For the other nine weeds, one basket was excavated approximately every 6 months over the next 2 years. When seeds were mixed with soil in the bags, the seeds were removed from the soil one by one with tweezers and the remaining soil was sieved to recover any remaining seeds.
Table 1 Species studied and experimental conditions for the seed burial experiment. Samples of 100 seeds of each species were placed into nylon bags, with or without soil, depending on the species. Seed bags were placed at the bottom of openwork baskets buried in a field at the INRA experimental station of Dijon-Époisses (France), at a seed burial depth of 30 cm. Three and six bags were excavated every 6 and 2 months, respectively

* The nomenclature follows the nomenclatural database of French flora (Kerguélen and Bock, Reference Kerguélen and Bock2009).
Germination tests were carried out before burial and then at each recovery date. Seeds were set to germinate on an imbibed filter paper in the light and at constant temperatures ranging from 15 to 25°C, depending on the species, for at least 1 month, until no more germination occurred. Temperature conditions were chosen to be optimal for each species (Montégut, Reference Montégut, Chaussatet and Deunff1975; Webster, Reference Webster1979; Lonchamp and Gora, Reference Lonchamp and Gora1980). The germination of dormant seeds was stimulated with gibberellins or stratification, depending on the species requirements (Webster, Reference Webster1979; Lonchamp and Gora, Reference Lonchamp and Gora1980). Finally, any remaining ungerminated seeds were dissected under a microscope, and firm white embryos were considered as viable (Sawma and Mohler, Reference Sawma and Mohler2002). The percentage of viable seeds was calculated relative to the number of viable seeds initially buried. A linear (equation 1) or a broken-stick linear model (equation 2) was fitted to the proportion of viable seeds of each species against time (with three or six repetitions per date), starting with the initial viability tests, using respectively PROC GLM and PROC NLIN routines in SAS (SAS Institute, Cary, North Carolina, USA, 1999):
where V s(t) is the proportion (in seeds·seeds− 1) of viable seeds of the species s at time t (in years), i.e. the time since burial in years; DECs, DEC1s and DEC2s are the seed mortality rates (in seeds·seeds− 1·year− 1) for the whole period, the first and the second year of the experiment, respectively. R 2 values were calculated as 1 − [(sum of error squares)/(total corrected sum of squares)].
Measurement of seed traits
Seed traits were measured on the same seed lots as those buried in the soil. The seed dry mass of each species was measured individually on 100 seeds dried at 80°C for 48 h. Images of 100 seeds were taken with a camera (pixel size comprised between 2.2 and 4.2 μm according to the species) and seed area, in two dimensions, was then individually determined by image analysis (Majumdar and Jayas, Reference Majumdar and Jayas2000; Muracciole et al., Reference Muracciole, Plainchault, Bertrand and Mannino2007). For each species, a seed shape index IndVar was computed, as the variance of the relative seed dimensions (Thompson et al., Reference Thompson, Band and Hodgson1993):

where L s, w s and h s are the seed length, width and height (mm), respectively; mean(L s, w s, h s) and max(L s, w s, h s) are the mean and maximal values of these three measurements. The seed shape index is close to zero for spherical seeds and increases for elongated or flattened seeds.
For seed composition analyses, outer structures of Poaceae seeds were removed (glumes, lemma and palea of Avena fatua and Alopecurus myosuroides, glumes of Echinochloa crus-galli). Dispersules of other species were kept intact. Seeds were dried at 80°C for 48 h, and two 250-mg samples of seeds were taken from each species. Seeds were milled to a fine powder and stored at − 17°C until further analysis. Nitrogen content was measured by the Dumas procedure (Hansen, Reference Hansen1989) and was multiplied by 6.25 (Mariotti et al., Reference Mariotti, Tome and Mirand2008) to estimate seed protein content. Lipid content was determined, following Jensen et al. (Reference Jensen, Johnels, Olsson and Otterlind1972), by dissolving seed oil in hexane:isopropanol (3:2 v/v), centrifuging and collecting the supernatant, then evaporating the solvent with a rotary evaporator. The oil remaining in the tube was then weighed.
One hundred seeds (full dispersules) of each species were exposed to X-rays at a radiation intensity ranging from 17–30 kV for 5–12 s (Faxitron MX-20 cabinet X-ray system) depending on the species, in order to optimize visualization of the seed coat. The thickness of the seed coat, including the tegument, the fruit coat (pericarp) and possibly the remnants of floral pieces, was then measured individually on Xray images using image analysis software (ImageJ; Rasband, Reference Rasband2009). The resolution ranged between 9 μm for small and 20 μm for large-seeded species.
Some missing values on seed traits were completed with data from the literature. This was the case for the seed lipid and protein contents of a few species. As shown by the different measurements made by Jones and Earle (Reference Jones and Earle1966), Barclay and Earle (Reference Barclay and Earle1974) and Earle and Jones (Reference Earle and Jones1962), these traits are relatively constant among seed lots of each species. Seed length, width and height can vary among seeds of a given species, but they were only used to calculate the seed shape index, which is less variable than the dimensions.
Seed mortality and persistence estimated from the literature
Seed mortality data (DEClit s) were taken from multi-annual experiments found in the literature. The aim was to compare them to the mortality rates measured in the present study, in order to check their consistency and to increase the range of analysed species to search for correlations with traits. Data were only taken from studies where a known quantity of seeds was buried at a depth of more than 5 cm in undisturbed soil, to minimize seed losses through germination. In addition, the large database of Thompson et al. (Reference Thompson, Bakker and Bekker1997) was used to compute a seed persistence index to test whether this index could be used to predict seed mortality. The longevity index developed by Bekker et al. (Reference Bekker, Bakker, Grandin, Kalamees, Milberg, Poschlod, Thompson and Willems1998) was not satisfactory because it was identical (i.e. 1) for most of the species studied here. The following seed persistence index was preferred because it better distinguished species according to their persistence:
where Ts, STs and LTs are the number of studies reporting a transient ( < 1 year), short-term persistent (between 1 and 5 years) and long-term persistent (more than 5 years) seed bank for the species s, respectively.
Predicting seed mortality from seed traits or from the literature
The correlation of the seed mortality rates measured here with mortality rates from the literature (DEClit s) was studied by linear regressions, using PROC GLM in SAS:

The effect of the presence of soil was included in the model to test whether the addition of soil in the seed bags had an influence on the measured seed mortality rates. δ and αsoil presence are regression coefficients (year− 1·year), with αsoil presence taking different values in the presence or absence of soil in the seed bag. Relationships were then studied between the seed mortality parameters (DECs, DEC1s and DEC2s) measured experimentally or estimated from the literature for five additional species on one hand, and seed traits and the seed persistence index on the other hand. Mortality rates based on the literature (i.e. for Alopecurus myosuroides, Arabidopsis thaliana, Datura stramonium, Geranium dissectum and Stellaria media, Table 2) were re-estimated with equation (5) to account for possible experimental differences, instead of using the actual rates given in the original papers.
Table 2 Annual in-situ seed mortality rates (±SE, seeds·seeds−1·year−1) measured during the seed burial experiment compared to seed mortality and persistence data from the literature

1Toole and Brown, Reference Toole and Brown1946; 2Roberts and Feast, Reference Roberts and Feast1972; 3Lewis, Reference Lewis1973; 4Egley and Chandler, Reference Egley and Chandler1983; 5Barralis et al., Reference Barralis, Chadoeuf and Lonchamp1988.
Analyses were carried out with raw data or logn-transformed variables. In the latter case, the linear model is equivalent to a multiplicative model, which better accounts for multiplicative interactions between factors. Multiple regressions (including all explanatory variables) were preferred to a series of successive single regressions because multiple regressions enable the detection of minor effects which are usually hidden by major effects in single regressions. Manual backward stepwise regressions were performed using proc GLM routine and type III sum of squares in SAS:

where seed traits are dry mass (mg), the seed shape index (dimensionless), and seed lipid and protein content (%). αtrait and γ are regression coefficients. DEC1s and DEC2s were transformed by adding the constant 0.01 to obtain strictly positive values and make the logn transformations possible. To account for differences in variance, sum of squares were weighted by the inverse of the seed mortality rate variances. Explanatory variables were kept in the final model if they were significant at α = 0.05.
In order to account for the phylogenetic relatedness in these comparisons, relationships were also analysed using phylogenetically independent contrasts (Felsenstein, Reference Felsenstein1985). This method is based on the comparison of pairs of taxa sharing an immediate common ancestor within a phylogeny. A fully resolved tree was built based on the latest phylogeny available (APG III, 2009) and from recent phylogenetic studies at the sub-family level (Quintanar et al., Reference Quintanar, Castroviejo and Catalan2007; Kim and Donoghue, Reference Kim and Donoghue2009). Standardized independent contrasts were calculated as the differences in trait or mortality values (either on raw or log-transformed variables), using Grafen's (Reference Grafen1989) branch length estimation method. Multiple linear regressions (manual stepwise backward regressions) were then carried out on the seed mortality contrast as a function of the seed trait contrasts, with the additional constraint of a zero constant (i.e. the regression was forced through the origin; Garland et al., Reference Garland, Harvey and Ives1992):

where α′trait and γ′ are regression coefficients.
Pairwise correlations within traits and between mortality parameters and traits were also studied, taking into account (or not) phylogenetic relatedness between species. These results are not shown as they did not provide different results from multiple regressions.
Results
Estimation of seed mortality rates
For most of the species, the seed recovery rate (number of recovered seeds relative to number of buried seeds) in the seed bags exceeded 95% (Table 1). However, in some species, only 22 to 64% of the seeds could be recovered at the end of the experiment (versus 100% a few months after burial). Equations (1) and (2) were fitted with R 2 values comprised between 0.23 and 0.96. During the 2 years of burial, the overall annual decrease in seed viability ranged from 0.01 ( ± SE = 0.002) or 0.02 ( ± 0.014), for Echinochloa crus-galli and Fallopia convolvulus, to 0.69 ( ± 0.040) for Digitaria sanguinalis (Table 2). During the first year of burial, seed mortality was lower than during the second year in all except one species (Fig. 1, Table 2). Once seed viability decreased, marked variability between seed bags was observed at each recovery date (see the standard deviations in Fig. 1). No clear general seasonal pattern could be detected in seed mortality for the studied species at the seed recovery frequency used here (every 2 months).

Figure 1 Variation in seed viability ( ± SD) of Amaranthus hybridus (A), Capsella bursa-pastoris (B), Galium aparine (C), Matricaria perforata (D) and Polygonum lapathifolium (E) during 2 years of burial in the soil at a depth of 30 cm. The first observation is the initial seed viability measured before burial. Lines are fittings of the broken-stick regression (equation 2).
The overall seed mortality rate DECs that we measured was positively correlated with the seed mortality rates observed in the literature (Fig. 2). However, this result was obtained by excluding Avena fatua and Echinochloa crus-galli from the analysis, as for these species we measured a lower seed mortality rate than that reported in the literature (Table 2). The effect of the presence of soil in the seed bags was not significant, indicating that the addition of soil to the seed bags had no influence on seed mortality in our experiments. Similar results were found for the mortality rates calculated for the first or second year of burial (DEC1s = 1.40·DEClit s, R 2 = 0.69, P value = 8.3·10− 4, df = 10; DEC2s = 1.54·DEClit s, R 2 = 0.52, P value = 8.5·10− 3, df = 10). The regression parameters exceeded 1 (P values < 0.02, df = 10), indicating that the rates measured here were significantly larger than those observed in the literature.

Figure 2 Relationship between the measured seed mortality rate (DECs) over the 2-year burial experiment with a seed depth of 30 cm and the mortality rate ( ± SE) taken from data in the literature (DEClit s). The line shows the fitting of equation (5). E. crus-galli and A. fatua were excluded from this regression.
Seed trait values and correlation with seed mortality
The seed traits varied widely, with seed masses ranging from 0.1 to 18 mg and shapes from spherical to elongated (Table 3). Monocotyledonous species (A. myosuroides, A. fatua, D. sanguinalis and E. crus-galli) had low lipid contents ranging from 4 to 14%, while four dicotyledonous species (A. thaliana, Capsella bursa-pastoris, D. stramonium and Papaver rhoeas) had a seed lipid content exceeding 30% together with high protein content. The seed coat was the thinnest (18 μm) in Digitaria sanguinalis and Capsella bursa-pastoris (Fig. 3). It was ten times thicker in fruits such as the achenes of Ambrosia artemisiifolia (159 μm) or Fallopia convolvulus (230 μm). The seed persistence index calculated from Thompson et al. (Reference Thompson, Bakker and Bekker1997) ranged from 1.8 for Galium aparine to 3.0 for Ambrosia artemisiifolia and Polygonum lapathifolium. The seed mortality rates decreased hyperbolically with seed coat thickness (Fig. 4). The relationship was significant whatever the period of time for which mortality rates were calculated, seed coat thickness explaining as much as 62% of the between-species variability during the second year (Table 4). These negative correlations remained significant when controlling for phylogenetic relatedness, with R 2 between 0.37 and 0.81 (Fig. 5). The seed mortality rates were not significantly correlated with other seed morphological traits, or with either seed reserves or the seed persistence index, whether the effects of phylogeny were considered or not.
Table 3 Morphological seed traits and seed composition (±SD) of the species studied. Seed mass, dimensions and coat thickness were individually measured on 100 seeds while lipid and protein contents were determined on two samples of 250 mg of dry seeds

Origin of traits taken from the literature: 1Aitzetmüller et al., Reference Aitzetmüller, Matthaüs and Friedrich2003; 2Barclay and Earle, Reference Barclay and Earle1974; 3Flynn et al., Reference Flynn, Turner and Stuppy2006; 4Holm-Nielsen, Reference Holm-Nielsen1998; 5Jones and Earle, Reference Jones and Earle1966; 6Kühn et al., Reference Kühn, Durka and Klotz2004; 7Schroeder et al., Reference Schroeder, Deli, Schall and Warren1974; 8Sevic, Reference Sevic2003.

Figure 3 X-ray images of seeds of nine weed species with contrasted seed coat thickness. (A) Avena fatua; (B) Ambrosia artemisiifolia; (C) Capsella bursa-pastoris; (D) Chenopodium album; (E) Echinochloa crus-galli; (F) Polygonum lapathifolium; (G) Stellaria media. Scale bars represent 1 mm.

Figure 4 Annual seed mortality rate (DECs, ± SE) in the soil as a function of seed coat thickness ( ± SD). Results of a 2-year burial experiment with seeds recovered from a depth of 30 cm (♦) and data from the literature (⋄). The line shows the fitting of equation (6). A mortality rate exceeding 1 means that all the seeds lost their viability in less than 1 year.
Table 4 Effects of species traits on seed mortality measured in the present burial experiment (13 species) or estimated from the literature (four additional species)

Results of the analysis of the model (6) with SAS. Only variables significant at 0.05 were kept in the final model.
* The mortality rate of G. dissectum was not estimated from the literature for a second year of burial since it exceeded 1 for the first year.
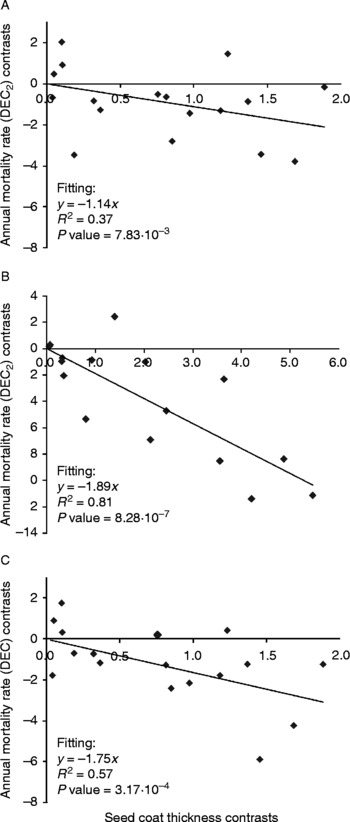
Figure 5 Relationships between seed coat thickness contrasts and mortality rate contrasts during the first year (A), second year (B) or during the whole period of burial (C). Contrasts were calculated on log-transformed data. The line shows the fitting of equation (7).
Discussion
During the first year of burial, seed viability only decreased slightly in most of the studied species, even in non-dormant species such as Matricaria perforata (Woo et al., Reference Woo, Thomas, Peschken, Bowes, Douglas, Harms and McClay1991). Seed losses due to germination could therefore be considered as negligible in the present experiment, and the mortality observed during the second year mostly resulted from parasite attacks or seed ageing. The higher mortality rates during the second year may be explained by the lag time necessary for the seed teguments to soften or to lose their toxic compounds, or for seed pathogens to develop sufficiently to cause serious seed losses. Marked differences appeared in seed viability among species after 2 years in the soil. For instance, more than 75% of the seeds of Galium aparine or Digitaria sanguinalis disappeared whereas more than 80% of Amaranthus hybridus or Polygonum lapathifolium seeds were still viable. For the latter species, tillage prior to crop sowing should be chosen carefully to create conditions that are unfavourable for germination (i.e. bury seeds, till when seeds are dormant, etc.) as long as their seeds are viable. Species with short-term viability will only persist in fields with frequent favourable crops where they emerge and reproduce best. Poorly diversified and notill cropping systems will enable even weeds with high mortality rates to reproduce each year, resulting in large populations.
For most of the studied species, the seed mortality rates measured in the present experiment were consistent with those observed in the literature. However, the mortality rates that were measured here were systematically higher than those found in the literature. The latter were obtained in seed burial conditions that differed from those in the present study by their soil climate and texture, which may have an effect on seed in-situ mortality. Conversely, the mortality rates measured in the present study for Echinochloa crus-galli and Avena fatua were lower than those reported in the literature (0.01 versus 0.51 from Egley and Chandler, Reference Barralis, Chadoeuf and Lonchamp1983; 0.03 versus 0.69 from Barralis et al., Reference Egley and Chandler1988; Lewis, Reference Lewis1973; Toole and Brown, Reference Toole and Brown1946). The higher mortality rates reported in the literature for these two weeds could be explained by differences in the protocols. For instance, seeds were usually buried less deeply in studies in the literature, and seed germination was thus not completely inhibited. This point illustrates the difficulty we had in finding studies suited to our objective (i.e. assessing seed mortality independently of seed losses by germination) and using similar seed burial protocols. In the present experiment, the seed mortality rate was computed with a linear regression for two successive 1-year periods. It would have been useful to extend our seed burial experiment beyond 2 years, especially for seeds with low mortality rates, and to fit a single sigmoidal model to data as in other studies (e.g. Masin et al., Reference Masin, Zuin, Otto and Zanin2006) where each species was characterized by its half-viability period. On the other hand, we were able to analyse a large number of contrasted species and to relate the observed seed mortality rate with easily measured seed traits. Indeed, seed coat thickness (which varied more than tenfold in the studied species) was negatively correlated with seed mortality in the soil during the 2 years of our burial experiment, whether phylogenetic relatedness was included or not. This relationship explained half the variability in mortality rates. This seed trait has rarely been measured in spite of its assumed importance in several processes in seed bank dynamics (seed dormancy, predation or persistence). Very few data are available in the literature as, until recently, no techniques were available to measure this trait rapidly on a large number of species. Now, improved technology is available, e.g. X-ray images, which proved to be very efficient for such measurements. For very thin seed coats, however, the precision of the measurements was affected by a low resolution of the images.
The present results confirm, for a larger number of species, those of Davis et al. (Reference Davis, Schutte, Iannuzzi and Renner2008) who found an analogous relationship between seed coat thickness and the time to half mortality in five American weed species. A thick seed coat can provide the seed embryo with efficient protection against external aggressions caused by microorganisms and other abiotic factors such as temperature and moisture variations. However, the present study shows that seed coat thickness only explains approximately two-thirds of the variability in seed mortality. Seeds may present natural permeability sites or other structural features (e.g. the strophiole) that enhance seed permeability (Kelly et al., Reference Kelly, Staden and Bell1992). Moreover, other traits of the seed coat could influence seed mortality, such as seed surface characteristics (e.g. smooth versus rough) creating microsites favouring the colonization of the seed by microorganisms (Chee-Sanford et al., Reference Chee-Sanford, Williams, Davis and Sims2006). Conversely, chemical compounds such as phenols may protect seeds from fungal or bacterial attacks (Hendry et al., Reference Hendry, Thompson, Moss, Edwards and Thorpe1994). However, considering the costs of these protection mechanisms, a trade-off can be expected between them. Indeed, a negative relationship was reported between seed coat thickness and seed phenol content, the former playing a primary role in preserving seed integrity, the latter having only a complementary effect (Davis et al., Reference Davis, Schutte, Iannuzzi and Renner2008).
The remaining unexplained variability in seed mortality was not significantly correlated with seed lipid or protein contents, which is consistent with reports in the literature (Priestley et al., Reference Priestley, Cullinan and Wolfe1985). The total protein and oil contents might, however, not be sufficiently precise to identify the seed's ability to survive over the years. Proteins that are used as markers of seed lot conservation ability could be better predictors for seed mortality (Ogé et al., Reference Ogé, Bourdais, Bove, Collet, Godin, Granier, Boutin, Job, Jullien and Grappin2008; Rajjou et al., Reference Rajjou, Lovigny, Groot, Belghaz, Job and Job2008). However, these chemical characteristics cannot be easily identified and measured in a wide range of species.
Seed mortality in the soil was not correlated with seed mass and shape, in contrast to the results of prior studies on seed persistence (Cerabolini et al., Reference Cerabolini, Ceriani, Caccianiga, Andreis and Raimondi2003). In these studies, the most persistent seeds were small and spherical. These seeds may migrate easily to deeper soil layers where germination is inhibited, thus reducing seed loss through germination and increasing persistence (Bekker et al., Reference Bekker, Bakker, Grandin, Kalamees, Milberg, Poschlod, Thompson and Willems1998). This was not the case in our experimental conditions (where seed burial was fixed) or in most fields where seeds are buried by tillage, irrespective of their morphology (Moss, Reference Moss1988). Saatkamp et al. (Reference Saatkamp, Affre, Dutoit and Poschlod2009) also failed to find a relationship between seed survival measured in their burial experiments and seed persistence in the literature. This is consistent with results of the present experiment, where seed mortality and seed persistence were not correlated either.
The weed flora present in a particular field is the result of several elements of cropping systems interacting with the seed bank. The present equations for predicting seed mortality in the soil therefore need to be integrated into comprehensive weed dynamics models that account for the remaining life-cycle processes and relate model parameters to species traits. We have already succeeded in relating pre-emergence growth parameters to seed mass (Gardarin et al., Reference Gardarin, Dürr and Colbach2010) and are still working on germination and dormancy parameters. Seed dormancy might also be explained by seed coat properties (Baskin and Baskin, Reference Baskin and Baskin1998), which could result in a correlation between mortality and dormancy. A relationship between these two processes is also expected as there is no advantage in being dormant and avoiding early germination if the seeds do not survive to germinate in later seasons. Many other crucial processes, such as seed predation, still remain to be modelled at the interspecific level. These multi-specific weed dynamics models will be used to evaluate different crop management techniques, such as burying the seeds by mouldboard ploughing to prevent the emergence of the most unwanted weeds, in interaction with the characteristics of each species.
Acknowledgements
The present work was financed by INRA (Département Environnement et Agronomie), ANR OGM VIGIWEED (ANR-07-POGM-003-01) and the Region of Burgundy. The authors are grateful to the INRA experimental station of Dijon-Époisses for providing the experimental site for the seed burial, to Christophe Salon and Anne-Lise Santoni (INRA, UMR LEG) as well as Lionel Bretillon and Stéphane Grégoire (INRA, UMR FLAVIC) for analyses of the seed reserves, to the Station Nationale d'Essais des Semences (SNES), to Laurence Le Corre for the seed coat X-ray images and to two anonymous reviewers for their helpful comments.


