Introduction
Seed germination is the first step of the plant's life cycle and the basis for crop yield (Han and Yang, Reference Han and Yang2015). Knowledge of the mechanisms of seed germination is therefore important for both fundamental and applied issues. Under favourable conditions, seed germination begins with imbibition, followed by radicle protrusion, and elongates through the covering layers, followed by seedling development (Weitbrecht et al., Reference Weitbrecht, Müller and Leubner-Metzger2011). Seed germination is regulated by many factors, including ambient temperature, light conditions (Shi et al., Reference Shi, Wang, Mo, Tang, Zhong and Deng2015), plant hormones (Chen et al., Reference Chen, Zhang, Neff, Hong, Zhang, Deng and Xiong2008; North et al., Reference North, Baud, Debeaujon, Dubos, Dubreucq, Grappin, Jullien, Lepiniec, Marion-Poll, Miquel, Rajjou, Routaboul and Caboche2010; Wilson et al., Reference Wilson, Kim, Bakshi and Binder2014) and salt (Xu et al., Reference Xu, Chen, He, Zhan, Cheng, Zhang and Wang2017a).
Abscisic acid (ABA) not only endogenously synthesizes but also exogenously applied, promotes seed dormancy and inhibits seed germination (Finkelstein et al., Reference Finkelstein, Reeves, Ariizumi and Steber2008). The PYR/PYL/RCAR (pyrabactin resistance/PYR-like/regulatory components of the ABA receptor) family of START domain proteins were identified as receptors for ABA (Ma et al., Reference Ma, Szostkiewicz, Korte, Moes, Yang, Christmann and Gril2009b; Park et al., Reference Park, Fung, Nishimura, Jensen, Fujii, Zhao, Lumba, Santiago, Rodrigues, Chow, Alfred, Bonetta, Finkelstein, Provart, Desveaux, Rodriguez, McCourt, Zhu, Schroeder, Volkman and Cutler2009). These proteins bind PP2Cs (type 2C protein phosphatases) including ABI1, ABI2 and PP2CA (Ma et al., Reference Ma, Szostkiewicz, Korte, Moes, Yang, Christmann and Gril2009b). The PP2Cs interact with SNF1-related kinase 2 (SnRK2) (Zhu, Reference Zhu2016). The SnRK2 family, which is activated by ABA, acts as a positive regulator of seed dormancy (Nakashima et al., Reference Nakashima, Fujita, Kanamori, Katagiri, Umezawa, Kidokoro, Maruyama, Yoshida, Ishiyama, Kobayashi, Shinozaki and Yamaguchi-Shinozaki2009). SnRK2s phosphorylate bZIP transcription factors such as ABI5 and ABFs (ABA-responsive element-binding factors) (Furihata et al., Reference Furihata, Maruyama, Fujita, Umezawa, Yoshida, Shinozaki and Yamaguchi-Shinozaki2006). The accumulation of the bZIP transcription factors then causes the inhibition of seed germination (Lopez-Molina et al., Reference Lopez-Molina, Mongrand and Chua2001).
The balance between ABA and gibberellins (GAs), under the control of environmental factors, is widely accepted to be an important factor regulating seed germination (North et al., Reference North, Baud, Debeaujon, Dubos, Dubreucq, Grappin, Jullien, Lepiniec, Marion-Poll, Miquel, Rajjou, Routaboul and Caboche2010). During germination the GA content increases by up-regulation of GA biosynthesis and down-regulation of GA inactivation (Yamauchi et al., Reference Yamauchi, Ogawa, Kuwahara, Hanada, Kamiya and Yamaguchi2004; Rieu et al., Reference Rieu, Eriksson, Powers, Gong, Griffiths, Woolley, Benlloch, Nilsson, Thomas, Hedden and Phillips2008). In the presence of bioactive GA, the GA receptor GID1 (GIBBERELLIN INSENSITIVE DWARF 1) interacts with DELLA proteins (the GRAS family of transcription factors) promoted by GA. DELLA regulates hypocotyl growth by direct interaction with PIF (phytochrome interacting factor) (de Lucas et al., Reference de Lucas, Davière, Rodríguez-Falcón, Pontin, Iglesias-Pedraz, Lorrain, Fankhauser, Blázquez, Titarenko and Prat2008).
About 34 million hectares of irrigated land are salt-affected worldwide (FAO, 2011). Salinity has long been considered a major and wide-ranging factor that affects seed germination and early seedlings (Darwin, Reference Darwin1856). The high Na+ concentrations not only suppress seed imbibition and embryo growth (Daszkowska-Golec, Reference Daszkowska-Golec2011; Khajeh-Hosseini et al., Reference Khajeh-Hosseini, Powell and Bingham2003; Rajjou et al., Reference Rajjou, Duval, Gallardo, Catusse, Bally, Job and Job2012; Radhakrishnan and Baek, Reference Radhakrishnan and Baek2017; Attia et al., Reference Attia, Alamer, Selmi, Djebali, Chaïbi and Nasri2018) but also leads to inhibition of cell survival, growth and division (Zehra et al., Reference Zehra, Gul, Ansari and Khan2012). Salt tolerance in plants has been linked to a large number of factors, for example NHX1, localized to the tonoplast and SOS1 (SALT OVERLY SENSITIVE 1) localized to the plasma membrane, two key regulators to maintain low cytoplasmic Na+ concentration in plant cells (Zhu, Reference Zhu2002; Deinlein et al., Reference Deinlein, Stephan, Horie, Luo, Xu and Schroeder2014); endogenous ABA contents, which rapidly decline upon imbibition during the early phase of germination (Preston et al., Reference Preston, Tatematsu, Kanno, Hobo, Kimura, Jikumaru, Yano, Kamiya and Nambara2009); Ca2+ influx, which regulates seed germination under salt stress by modulating Na+ accumulation through the SOS pathway (Cheng et al., Reference Cheng, Zhang, Sun, Tian and Zhang2018); and the balance between ROS (reactive oxygen species) generation and ROS scavenging in plant cells (Das et al., Reference Das, Nutan, Singla-Pareek and Pareek2015).
The molecular mechanisms of salt tolerance during early seed germination remain elusive. To investigate the transcriptional regulatory network during early seed germination under salt stress, we constructed three kinds of RNA libraries with three biological replicates from Arabidopsis seeds germinated under salt stress and then performed RNA sequencing. The differentially expressed genes were analysed. These results may contribute to increase our understanding of seed early germination under salt stress.
Materials and methods
Seed germination
Seeds were surface sterilized with a 0.5% NaClO solution and then washed three times in sterilized distilled water. The sterilized seeds were imbibed in distilled water at 4°C in the dark for 48 h and then germinated on half-strength MS medium without sugar at 25°C with a 16 h photoperiod. For salt treatments, the seeds were germinated on half-strength MS with sodium chloride. For each treatment, nine replications of 40 seeds each were used. Each value is mean ± SE. Germinated seeds (2 mm radicle penetrated through seed coat) were counted every 12 h.
RNA extraction and cDNA preparation for Illumina sequencing
After treatment, the 60-h germinated seedlings were collected, immediately frozen in liquid N2 and stored at –80°C. A total RNA kit (Invitrogen) was used to isolate total RNA from the frozen seedlings, which were then treated with RNase-free DNase (Promega) to remove genomic DNA. RNA degradation and contamination were monitored on 1% agarose gels. RNA purity was checked using the NanoPhotometer spectrophotometer (IMPLEN, CA, USA). RNA concentration was measured using a Qubit RNA Assay Kit in a Qubit 2.0 Flurometer (Life Technologies, CA, USA). RNA integrity was assessed using the RNA Nano 6000 Assay Kit of the Agilent Bioanalyzer 2100 system (Agilent Technologies, CA, USA). The cDNA for sequencing was prepared as described by Wang et al. (Reference Wang, Hu, Wu, Wang, Han, Jin, Zhou, Zhang, Jiang, Shen, Shi and Yang2017).
Identification of differentially expressed genes
Gene expression levels were estimated by fragments per kilobase of transcript per million fragments mapped, using the following formula:
 $${\rm FPKM} = \displaystyle{{\hbox{cDNA Fragments}} \over {\hbox{Mapped Fragments (Millions)} \!\times\!\hbox{Transcript Length (kb)}}}$$
Differential expression analysis of treated and untreated seedlings was performed using the DESeq R package (1.10.1). DESeq provides statistical routines for determining differential expression in digital gene expression data using a model based on a negative binomial distribution. The resulting P values were adjusted using Benjamini and Hochberg's approach for controlling false discovery rate. Genes with an adjusted P-value < 0.05 found by DESeq were assigned as differentially expressed. RT qPCR was used to confirm the expression of the differentially expressed genes (see supplemental table 3).
GO enrichment analysis
Gene ontology (GO) enrichment analysis of the differentially expressed genes (DEGs) was implemented by online AgriGO of gene ontology (http://bioinfo.cau.edu.cn/agriGO/analysis.php) as described by Wang et al. (Reference Wang, Hu, Wu, Wang, Han, Jin, Zhou, Zhang, Jiang, Shen, Shi and Yang2017).
Statistical analysis
Data were analysed using analysis of variance (ANOVA) followed by LSD post-hoc testing at P < 0.05. Statistical procedures were carried out with the software package SPSS statistics 17.0 as described by Xu et al. (Reference Xu, Hu, Yang and Jin2017b).
Hydrogen peroxide measurement
The seedlings germinated for 60 h were collected. The H2O2 concentration was measured using an Amplex red hydrogen peroxide/peroxidase assay kit (catalogue no. A22188, Thermo Fisher) as described by Wang et al. (Reference Wang, Hu, Wu, Wang, Han, Jin, Zhou, Zhang, Jiang, Shen, Shi and Yang2017). The 3,3′ Diaminobenzidine (DAB) staining was carried out as described by Wang et al. (Reference Wang, Hu, Wu, Wang, Han, Jin, Zhou, Zhang, Jiang, Shen, Shi and Yang2017).
Results
Sodium chloride inhibits seed germination
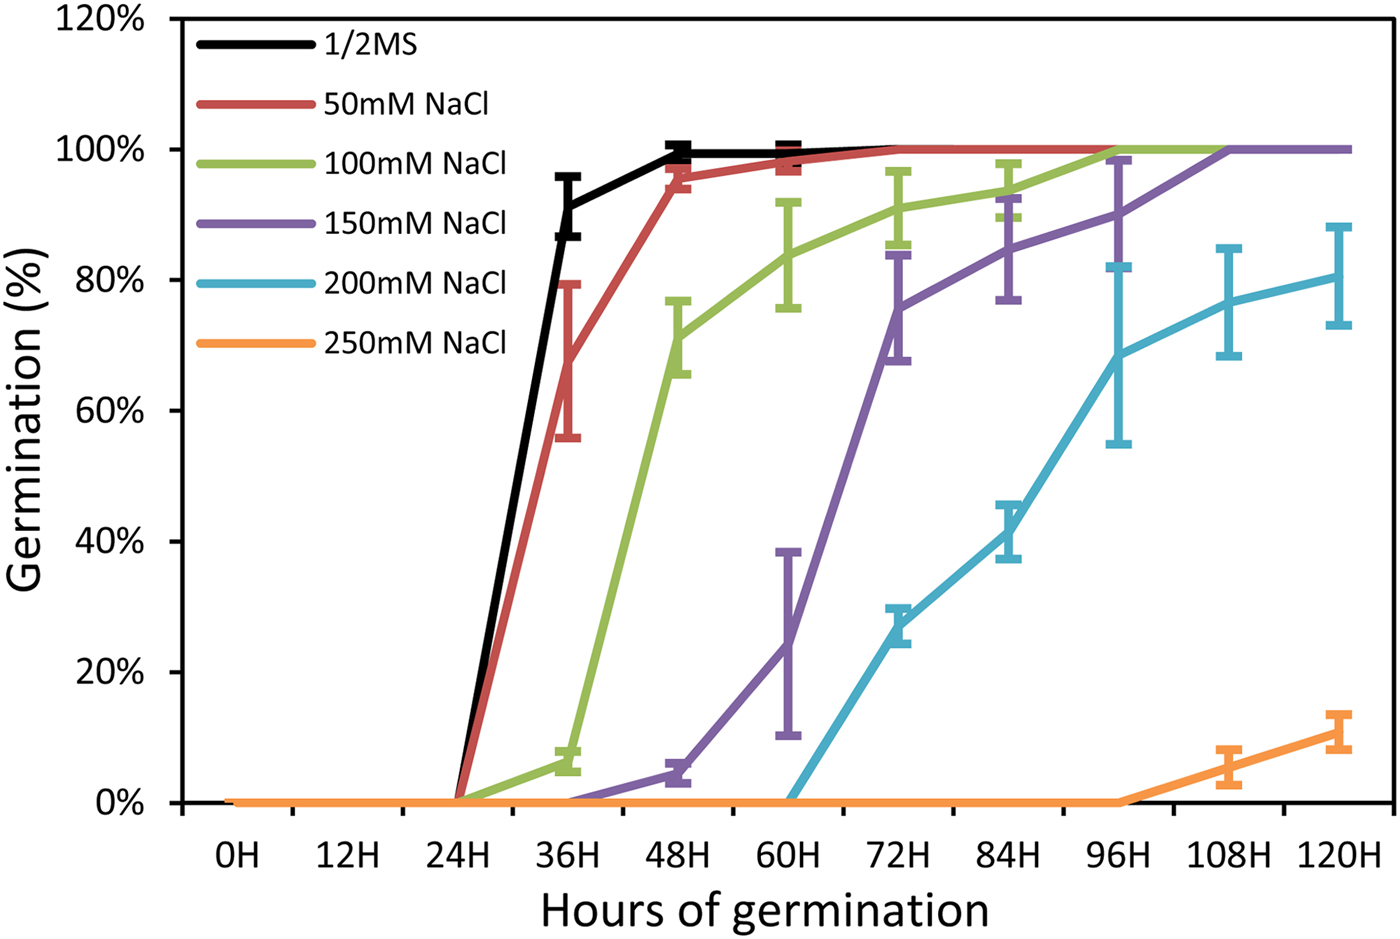
To gain more insight into the role of salt stress in seed germination, Arabidopsis (Arabidopsis thaliana) seeds were germinated in half-strength MS medium with different concentrations of sodium chloride. The results showed that NaCl treatment inhibited seed germination (Fig. 1). At 60 h after sowing, the germination percentage under 100 mM NaCl was 83.8%, and 24.3% under 150 mM NaCl, while the water control was 99.3% (Fig. 1). The 60-h seedlings treated with 100 and 150mM NaCl were selected for further analysis.

Fig. 1. Time course of seed germination in different concentrations of NaCl. Each value shown represents the mean ± SE of nine biological replicates.
mRNA sequencing data mapping and annotation
Nine cDNA libraries from the control (c01, c02, c03), seedlings treated with 100 mM sodium chloride (c1001, c1002, c1003) and seedlings treated with 150 mM sodium chloride (c1501, c1502, c1503) with three biological replicates were sequenced. After removing low-quality sequences, RNA-seq produced 45501290, 49114584, 35242436, 46077438, 60688688, 50821048, 44002906, 34683368 and 45241424 clean data for c01, c02, c03, c1001, c1002, c1003, c1501, c1502 and c1503 samples, respectively. More than 84.5% of these reads can be mapped to the Arabidopsis genome. Less than 7.46% of reads had multiple alignments (Table 1). This indicated that the sequencing quality was appropriate for further analysis.
Table 1. Summary of mRNA sequencing database

Differentially expressed genes in response to sodium chloride treatment
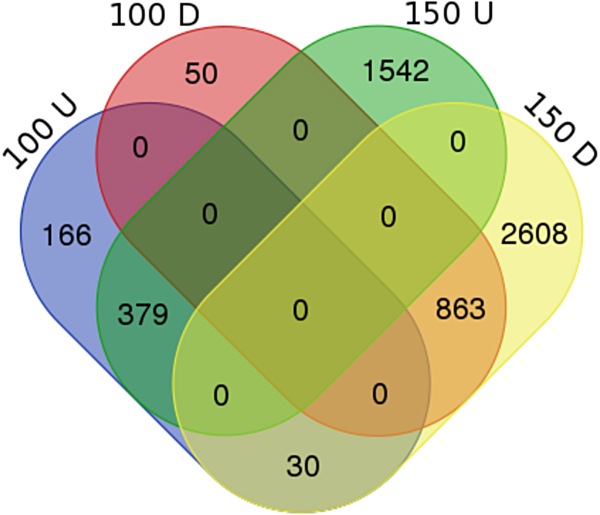
With a criterium of at least 2-fold difference and a p-value below 0.05 (|log2FC| ≥ 1, p<0.05), 1488 genes were differentially expressed in response to 100 mM NaCl, and 5422 genes in response to 150 mM NaCl (Table 2 and supplemental table 1). The Clusters of Orthologous Groups (COG) function classification of DEGs showed that the majority of the genes were related to general function prediction only, carbohydrate transport and metabolism, transcription, signal transduction mechanisms and amino acid transport and mechanism (supplemental fig. 1). There were 913 genes down-regulated, whereas 575 genes were up-regulated in 100 mM sodium chloride. In 150 mM sodium chloride 1921 genes were up-regulated and 3501 genes were down-regulated (supplemental table 1). Of these, 379 were up-regulated and 863 genes were down-regulated in both 100 and 150 mM sodium chloride. There were 30 genes up-regulated in 100 mM sodium chloride and down-regulated in 150 mM sodium chloride. No genes were detected which were down-regulated in 100 mM NaCl and up-regulated in 150 mM NaCl (Fig. 2 and supplemental table 2)

Fig. 2. Venn diagram of significantly differentially expressed genes between 100U, 100D, 150U and 150D. 100U and 150U: up-regulated genes in 100 and 150 mM NaCl, respectively; 100D and 150D: down-regulated genes in 100 and 150 mM NaCl, respectively.
Table 2. Genes differentially expressed in response to NaCl stress annotated with COG, GO, KEGG, KOG, NR and Swiss-Prot database

.
Salt stress induces the expression of genes responsive to the nutrient reservoir
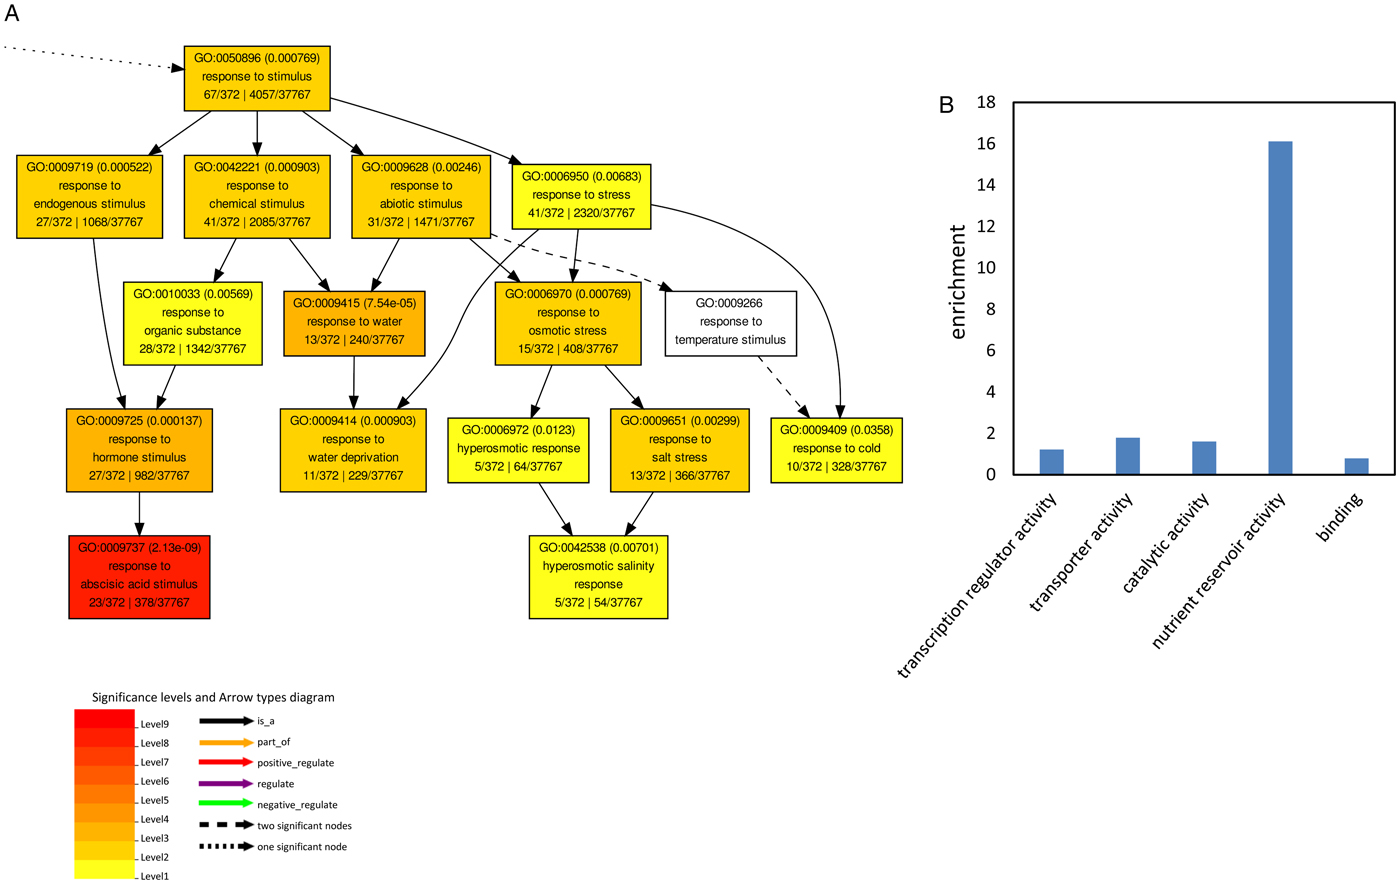
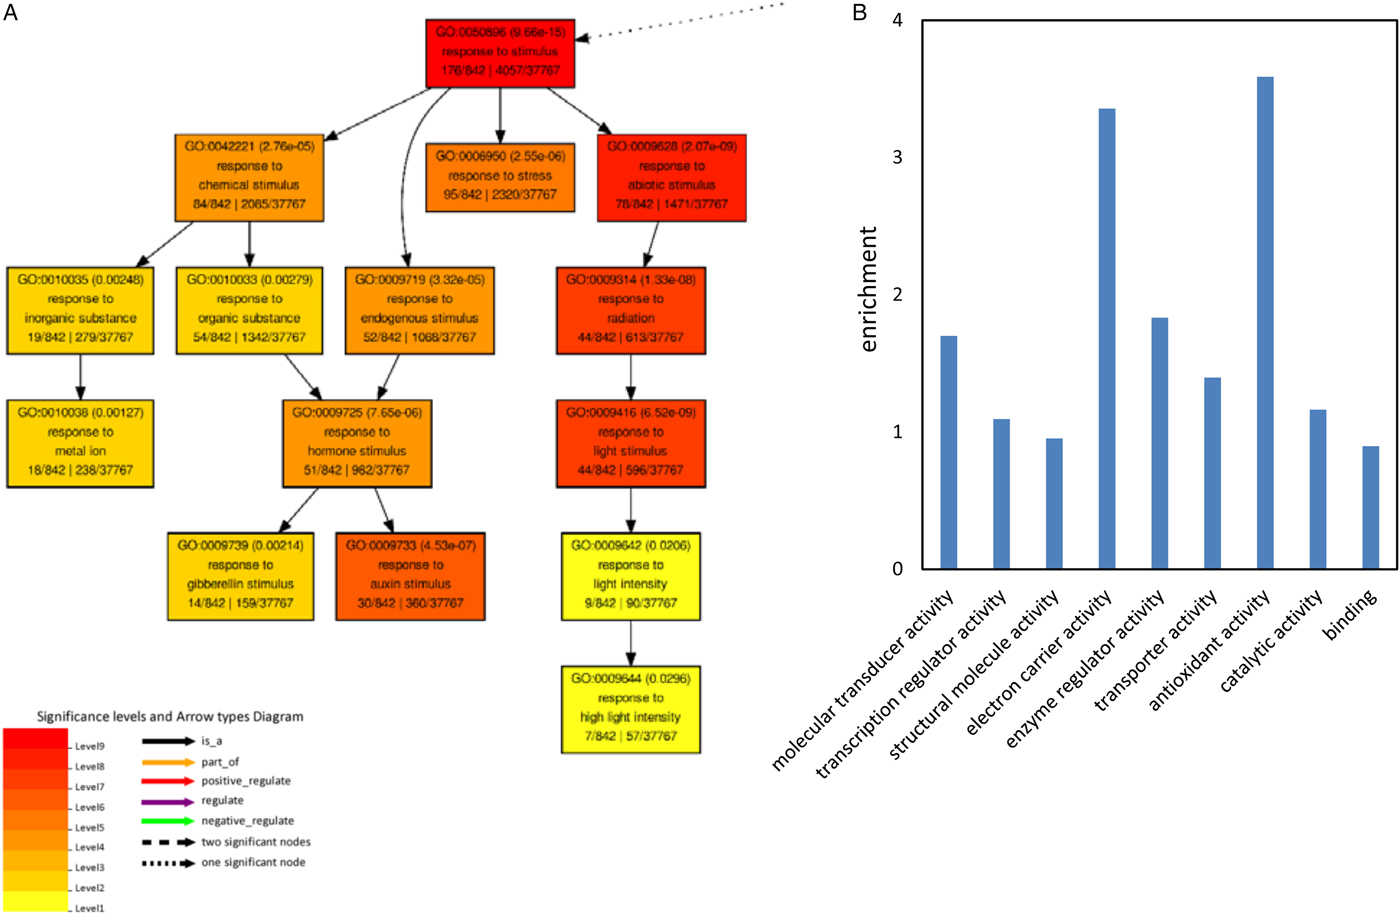
To get an overview of the physiological processes in which these commonly regulated genes were involved, GO enrichment analysis for biological process and molecular function was performed. No significant enrichment of GO terms was observed for the commonly regulated genes up-regulated in 100 mM NaCl and down-regulated in 150 mM NaCl. Biological process GO terms related to reproduction, reproductive process, developmental process, multicellular organismal, localization and response to stimulus were significantly enriched in the up-regulated genes by NaCl treatment (Fig. 3A and supplemental fig. 2).

Fig. 3. Gene ontology (GO) analysis of the up-regulated genes in 100 and 150 mM NaCl. (A) Significantly enriched biological process GO terms for the co-upregulated genes. (B) Enrichment of significant molecular function of the co-upregulated genes. Enrichment was calculated by: (annotated/total number in query list)/(annotated/total number in background or reference).
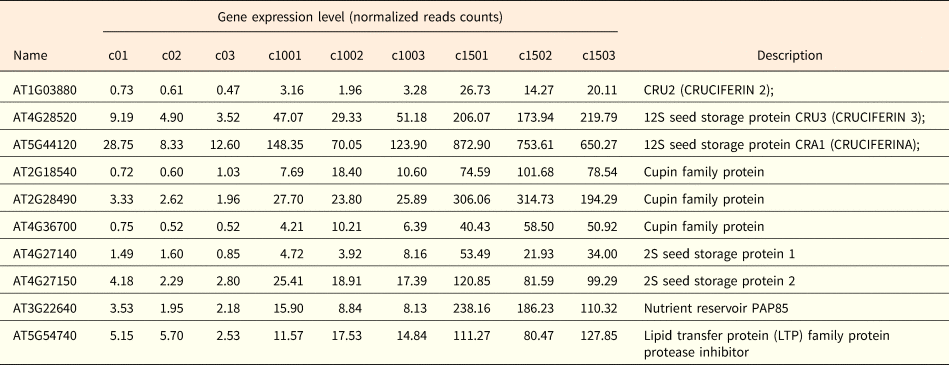
Molecular function GO terms related to transcription regulator activity, transporter activity, catalytic activity, nutrient reservoir activity and binding were significantly enriched in the up-regulated genes under NaCl treatment (Fig. 3B). Among them the GO terms associated with nutrient reservoir activity were significantly enriched in the up-regulated genes, for example the expression of AT1G03880, AT4G28520 and AT5G44120, coding for seed storage proteins of which the phosphorylation state is modulated in response to ABA (Wan et al., Reference Wan, Ross, Yang, Hegedus and Kermode2007), was induced by both 100 and 150 mM NaCl (Table 3). Salinity stress also induced the expression of Cupin family proteins (AT2G18540, AT2G28490 and AT4G36700) and 2S seed storage proteins (AT4G27140 and AT4G27150) (Table 3). Taken together this suggests that under salt stress, seedlings resort to the synthesis of storage proteins compared with non-stressed conditions.
Table 3. Summary of the up-regulated nutrient-reservoir related genes

Salt stress increases the expression of ABA-responsive genes
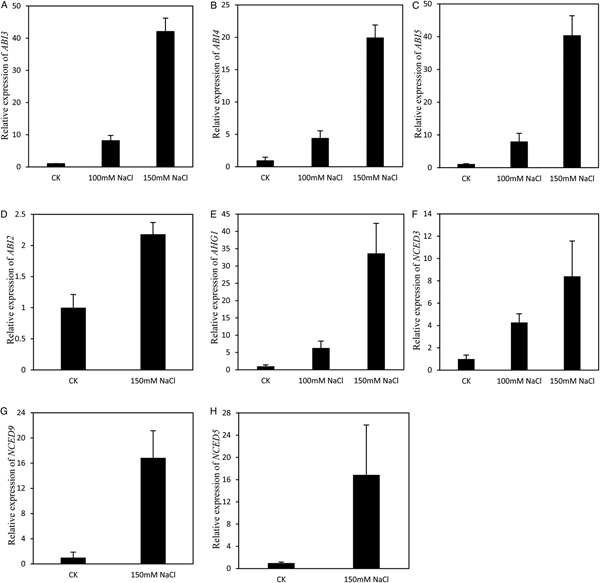
GO terms related to response to abscisic acid stimulus were especially enriched in the cluster of up-regulated genes (Fig. 3A). Several ABA-insensitive (ABI) genes were obviously induced by salt stress. For example, the expression of ABI5 was increased by almost eight times in 100 mM NaCl and more than 40 times in 150 mM NaCl (Fig. 4C). The transcriptional level of ABI3, a positive regulator of ABI5, was also induced by salt stress (Fig. 4A). In addition, salinity stress significantly increased the expression of ABI4 (Fig. 4B). The expression of ABI2 was induced by the 150 mM NaCl treatment (Fig. 4D). AHG1 (ABA-hypersensitive germination 1), one of the highest expressed PP2C phosphatases of clade A in germinating seeds (Née et al., Reference Née, Kramer, Nakabayashi, Yuan, Xiang, Miatton, Finkemeier and Soppe2017), was clearly induced by both 100 and 150 mM salt stress (Fig. 4E). Salt stress not only induced the expression of ABA signalling genes but also up-regulated ABA biosynthesis genes. The mRNA content of NCED3, coding a key enzyme 9-cis-epoxycarotenoid dioxygenase in ABA biosynthesis, increased by more than four times in 100 mM NaCl and more than eight times in 150 mM NaCl-treated samples (Fig. 4F). NaCl at 150 mM induced the expression of NCED9 and NCED5 (Fig. 4G,H). The up-regulation of ABA relative genes by NaCl treatment suggested that salt stress inhibited seed germination by increasing endogenous ABA synthesis and activating ABA signalling.

Fig. 4. Genes response to Abscisic acid stimulus were up-regulated by sodium chloride treatment. (A) Expression of ABI3 At2g40220 was up-regulated by both 100 and 150 mM NaCl treatment. (B) Expression of ABI4 At2g40220 was up-regulated by both 100 and 150 mM NaCl treatment. (C) Expression of ABI5 At2g36270 was up-regulated by both 100 and 150 mM NaCl treatment. (D) Expression of ABI2 At5g57050 was up-regulated by 150 mM NaCl treatment. (E) Expression of AHG1 At5g51760 was up-regulated by both 100 and 150 mM NaCl treatment. (F) Expression of NCED3 At3g14440 was up-regulated by both 100 and 150 mM NaCl treatment. (G) Expression of NCED9 At1g78390 was up-regulated by 150 mM NaCl treatment. (H) Expression of NCED5 At1g30100 was up-regulated by 150 mM NaCl treatment. Each value is mean ± SE of three biological replicates.
Transcription factors responsive to gibberellin and auxin are significantly down-regulated by salinity stress
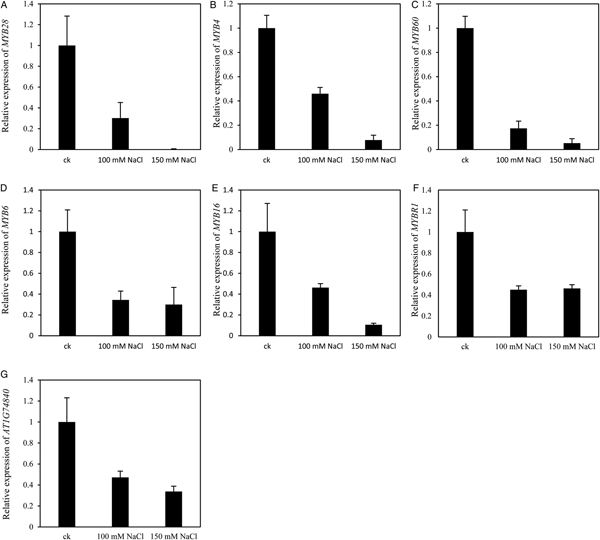
Biological process GO terms associated with response to stimulus were significantly enriched in the down-regulated genes under NaCl treatment (Fig. 5A and supplemental fig. 3). GO terms related to response to gibberellin stimulus and response to auxin stimulus were especially enriched (Fig. 5A). Fourteen gibberellin related genes were significantly down-regulated by both 100 and 150 mM NaCl, of which eight encode MYB domain transcription factors (Fig. 6). The expression of MYB28 (AT5G61420) was reduced to less than 0.5% by 150 mM NaCl (Fig. 6A). The expression of MYB4 (AT4G38620) and MYB60 (AT1G08810) were reduced to less than 1% by 150 mM NaCl treatment compared with the control (Fig. 6B,C). The mRNA content of MYB6 (AT4G09460), MYB16 (AT5G15310), MYBR1 (AT5G67300) and another MYB family gene AT1G74840 decreased to less than 50% by 100 mM salt stress (Fig. 6D–G). All these seven MYB family genes mentioned above are also involved in auxin signal transmission.

Fig. 5. GO analysis of the genes down-regulated by both 100 and 150 mM NaCl. (A) Significantly enriched biological process GO terms. (B) Enrichment of significant molecular function of the co-downregulated genes. The enrichment was calculated by: (annotated/total number in query list)/(annotated/total number in background or reference).

Fig. 6. MYB family transcriptional factor were down-regulated by both 100 and 150 mM sodium chloride treatment. (A) Expression of MYB28 At5g61420 was down-regulated by both 100 and 150 mM NaCl treatment. (B) Expression of MYB4 At4g38620 was down-regulated by both 100 and 150 mM NaCl treatment. (C) Expression of MYB60 At1g08810 was down-regulated by both 100 and 150 mM NaCl treatment. (D) Expression of MYB6 At4g09460 was down-regulated by both 100 and 150 mM NaCl treatment. (E) Expression of MYB16 At5g15310 was down-regulated by both 100 and 150 mM NaCl treatment. (F) Expression of MYBR1 At5g67300 was down-regulated by both 100 and 150 mM NaCl treatment. (G) Expression of At1g74840 was down-regulated by both 100 and 150mM NaCl treatment. Each value is mean ± SE of three biological replicates.
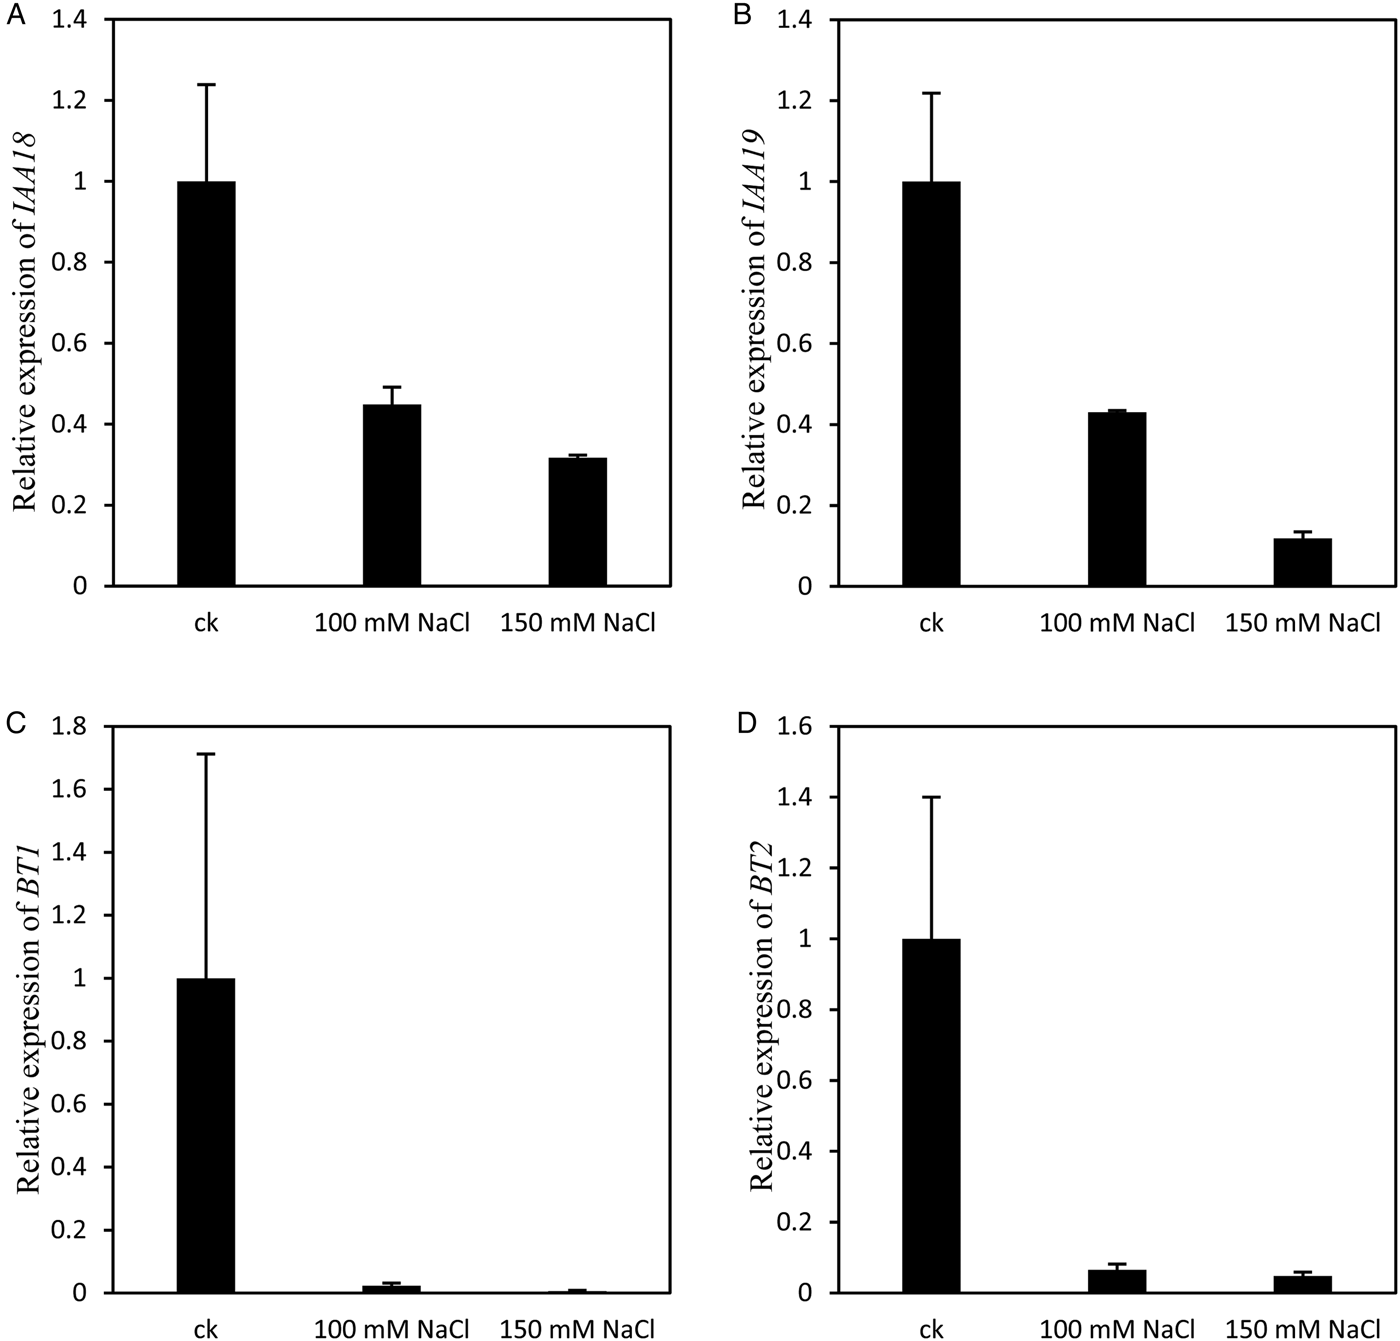
Besides these MYB family transcription factors, four other transcription factors involved in auxin signalling were also down-regulated by salt stress (Fig. 7). IAA18 (AT1G51950) and IAA19 (AT3G15540), induced by indole-3-acetic acid, were down-regulated by both 100 and 150 mM NaCl treatment (Fig. 7A,B). The expression of BTB and TAZ domain protein: BT1 (AT5G63160) and BT2 (AT3G48360), which are involved in auxin-activated signalling pathways, were repressed to less than 10% by both 100 and 150 mM salt stress (Fig. 7C,D). These results suggest that salt stress inhibited seed germination by repressing the expression of the transcription factors that are involved in gibberellin and/or auxin signalling pathways.

Fig. 7. transcriptional factor involved in auxin signaling were down-regulated by both 100 and 150 mM sodium chloride treatment. (A) Expression of IAA18 At1g51950 was down-regulated by both 100 and 150 mM NaCl treatment. (B) Expression of IAA19 At3g15540 was down-regulated by both 100 and 150 mM NaCl treatment. (C) Expression of BT1 At5g63160 was down-regulated by both 100 and 150 mM NaCl treatment. (D) Expression of BT2 At3g48360 was down-regulated by both 100 and 150 mM NaCl treatment. Each value is mean ± SE of three biological replicates.
Anti-oxidant activity related genes are significantly down-regulated by salinity stress
Molecular function GO terms related to molecular transducer activity, transcription regulator activity, structural molecule activity, electron carrier activity, enzyme regulator activity, transporter activity, antioxidant activity, catalytic activity and binding were significantly enriched in the down-regulated genes by NaCl treatment (Fig. 5B).
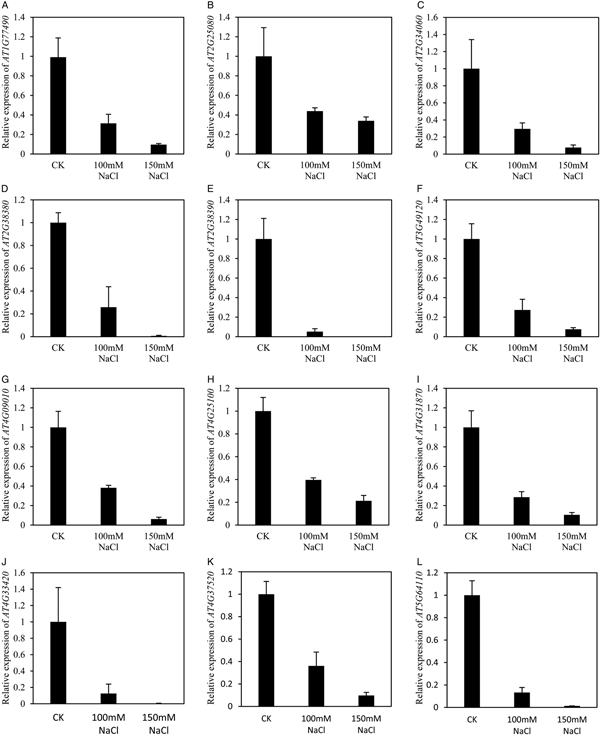
Notably genes linked with anti-oxidant activity were significantly enriched in down-regulated genes by NaCl treatment. Twelve genes were down-regulated in both 100 and 150 mM NaCl (Fig. 8). The expression of AT4G25100, coding for Fe-superoxide dismutase (FSD1), was repressed to less than 40% by both 100 and 150 mM salt stress (Fig. 8H). Another 11 genes encoding peroxidase were down-regulated by both 100 and 150 mM NaCl, among them AT2G25080 and AT4G31870 coding for glutathione peroxidase (Fig. 8B,I), AT1G77490 and AT4G09010 coding for ascorbate peroxidases (Fig. 8A,G). The expression of AT2G38390 coding for a peroxidase could not be detected in 150 mM NaCl treated samples (Fig. 8E). Compared with the control, the expression of AT2G38380, AT4G33420 and AT5G64110 was decreased to less than 1% by treatment with 150 mM NaCl (Fig. 8D,J,L). Taken together, this suggests that salt stress represses the expression of peroxidase, thereby inhibiting seed germination. Furthermore, both DAB staining and the quantitative assay showed higher H2O2 levels in seedlings treated with both 100 and 150 mM NaCl than in control seedlings (Fig. 9), which further supports the notion that salt stress induced H2O2 accumulation.

Fig. 8. Genes response to antioxidant activity were down-regulated by both 100 and 150 mM sodium chloride treatment. (A) Expression of At1g77490 was down-regulated by both 100 and 150 mM NaCl treatment. (B) Expression of At2g25080 was down-regulated by both 100 and 150 mM NaCl treatment. (C) Expression of At2g34060 was down-regulated by both 100 and 150 mM NaCl treatment. (D) Expression of At2g38380 was down-regulated by both 100 and 150 mM NaCl treatment. (E) Expression of At2g38390 was down-regulated by both 100 and 150 mM NaCl treatment. (F) Expression of At3g49120 was down-regulated by both 100 and 150 mM NaCl treatment. (G) Expression of At4g09010 was down-regulated by both 100 and 150 mM NaCl treatment. (H) Expression of At4g25100 was down-regulated by both 100 and 150 mM NaCl treatment. (I) Expression of At4g31870 was down-regulated by both 100 and 150 mM NaCl treatment. (J) Expression of At4g33420 was down-regulated by both 100 and 150 mM NaCl treatment. (K) Expression of At4g37520 was down-regulated by both 100 and 150 mM NaCl treatment. (L) Expression of At5g64110 was down-regulated by both 100 and 150 mM NaCl treatment. Each value is mean ± SE of three biological replicates.
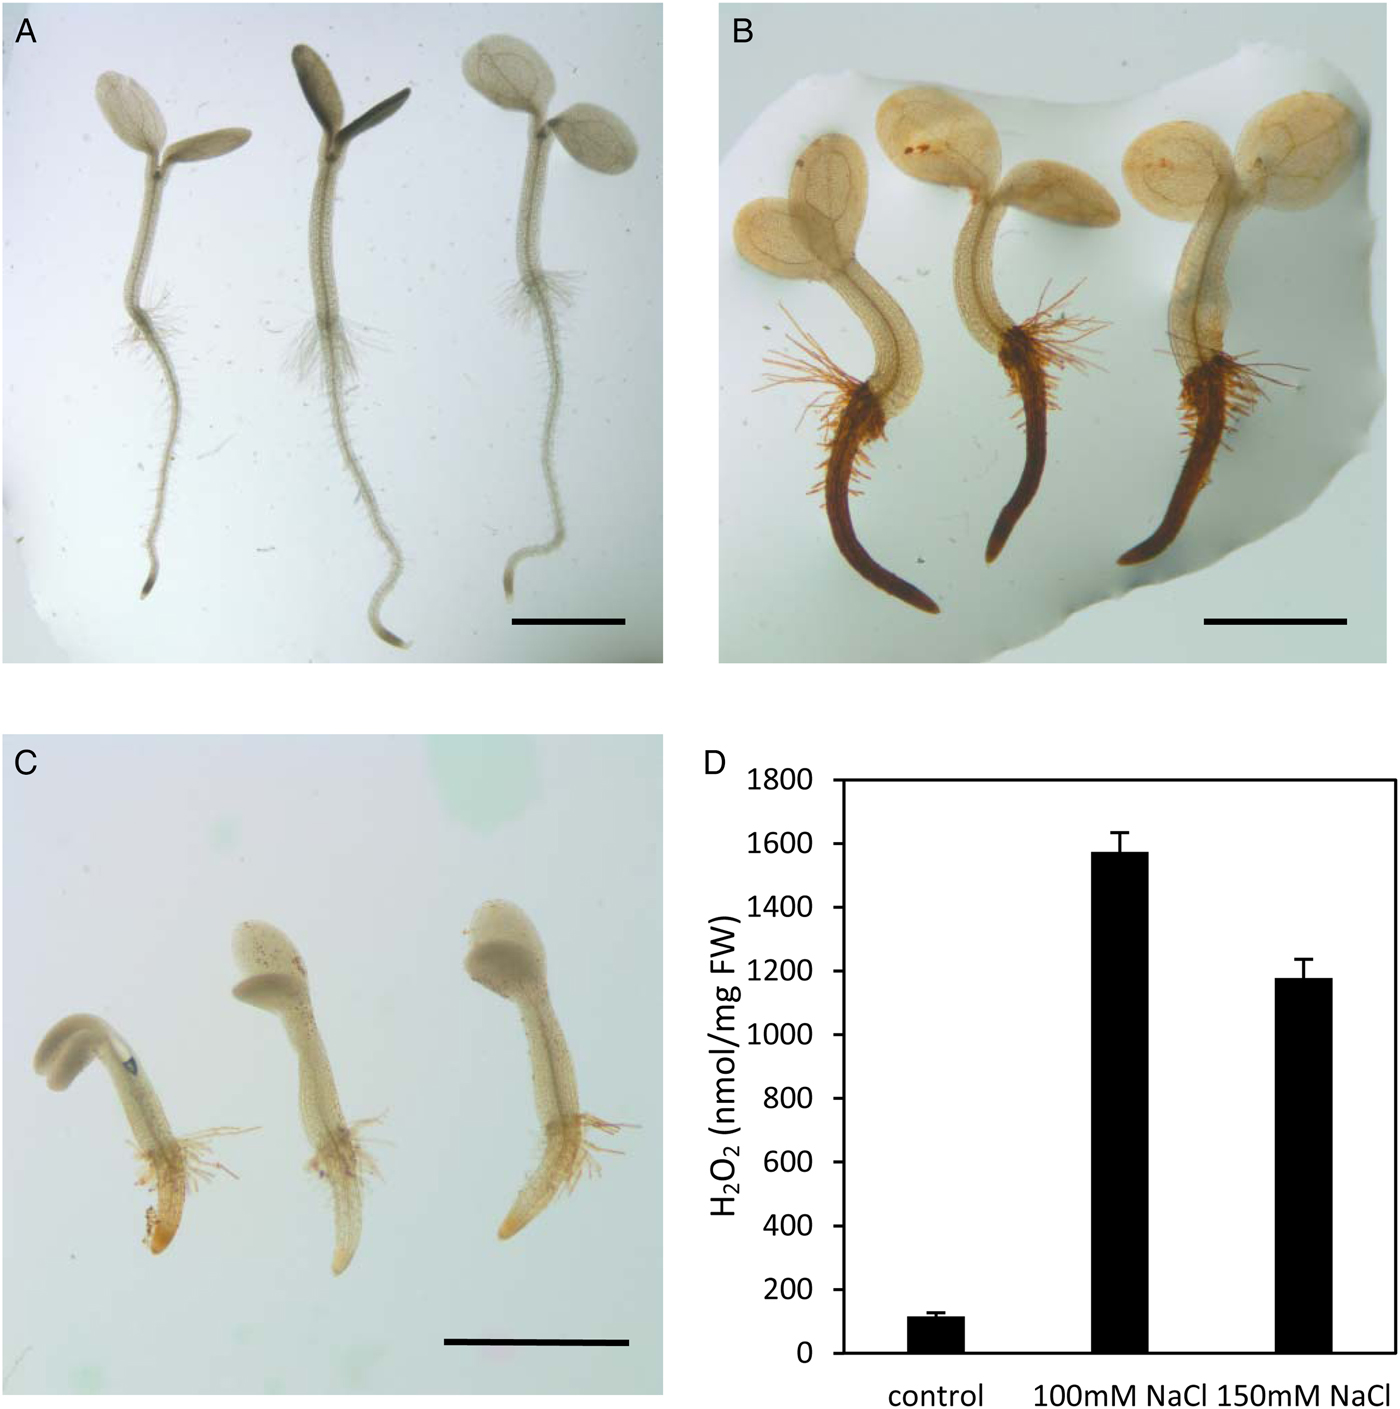
Fig. 9. Accumulated H2O2 content as detected by DAB staining in 60-hour-old seedlings under salt stress. (A) Water control; (B) 100 mM NaCl; (C) 150 mM NaCl; (D) H2O2 content quantified with or without NaCl. Each value represents the mean ± SE of six biological replicates. Scale bar, 1 mm.
Discussion
Seed germination is a key step in plant growth and development. So far, transcriptome research on salt stress regulation has focused on seedlings more than 7 days after sowing. These results showed that the salt stress responsive genes belong to the GO categories response to stimulus, hormone metabolism and accumulation of reactive oxygen species (Wang et al., Reference Wang, Yang, Zheng, Grumet, Loescher, Zhu, Yang, Hu and Chan2013; Shen et al., Reference Shen, Wang, Song, Xu, Jiang, Zhao, Ma and Zhang2014; Cheng et al., Reference Cheng, Ko, Chang, Kuo, Chen and Lin2015; Zhao et al., Reference Zhao, Wang, Zhao, Chen and Ma2017).
However, early germination is sensitive to various stresses as embryonic cells switch from quiescence to a state of high metabolic activity (Weitbrecht et al., Reference Weitbrecht, Müller and Leubner-Metzger2011). Salt stress is one of the factors affecting early seed germination (Fig. 1). Thus, investigating the molecular processes underlying early seed germination under salt stress may increase our understanding of seed germination under salt stress and help to engineer more robust species to improve yield and quality.
In the present study we identified the differentially expressed genes (DEGs) at a change of >2.0-fold and p < 0.05 in response to salt stress. Under 100 mM NaCl stress, 1488 genes were differentially expressed. Of these, 575 genes were up-regulated and 913 genes were down-regulated (supplemental table 1). Under 150 mM NaCl stress, 5422 genes were differentially expressed, of which 1921 genes were up-regulated and 3501 genes were down-regulated (supplemental table 2). As 65.9% up-regulated genes and 94.5% down-regulated genes under 100 mM NaCl stress were also up- or down-regulated under 150 mM NaCl stress (Fig. 2), we further analysed the collective up- and down-regulated genes. Biological process GO terms related to response to stimulus were significantly enriched in both.
High salinity inhibits germination by regulating ABA biosynthesis and signalling
Seed germination is usually accompanied by the increases in ABA catabolism (Vishwakarma et al., Reference Vishwakarma, Upadhyay, Kumar, Yadav, Singh, Mishra, Kumar, Verma, Upadhyay, Pandey and Sharma2017), ABA signalling protein SNF1-RELATED PROTEIN KINASE2.2 (SnRK2.2) and SnRK2.3 inhibitor seed germination (Fujii et al., Reference Fujii, Verslues and Zhu2007). ABI1 and ABI2, type 2C protein phosphatases that interact with SnRK2 family, perform negative regulation of germination of seeds (Finkelstein and Somerville, Reference Finkelstein and Somerville1990). ABI4, a key factor that regulates primary seed dormancy, mediates the balance between ABA and GA biosynthesis (Shu et al., Reference Shu, Zhang, Wang, Chen, Wu, Tang, Liu, Feng, Cao and Xie2013). The accumulation of ABI5, a bZIP transcription factor, causes the inhibition of seed germination (Lopez-Molina et al., Reference Lopez-Molina, Mongrand and Chua2001). In our study, GO terms related to response to abscisic acid stimulus were especially enriched in the up-regulated gene set upon treatment by 100 and 150 mM NaCl (Fig. 3). The expression of ABI3, ABI4 and ABI5 was significantly up-regulated by both 100 and 150 mM NaCl treatment, whereas the expression of ABI2 was induced by 150 mM NaCl treatment (Fig. 4). NCED genes encode 9-cis-epoxycarotenoid dioxygenases, which catalyse the first step of ABA biosynthesis. The expression of NCED1 decreased rapidly during seed germination in maize (Li et al., Reference Li, Xu, Gao, Wang, Guo, Luo, Huang, Hu, Sheteiwy, Guan and Hu2017). Here the expression of NCED3 was notably up-regulated by both 100 and 150 mM salt stress and the expression of NCED5 and NCED9 was increased by 150 mM NaCl (Fig. 4). These results suggest that salt stress inhibits seed germination by enhancing ABA biosynthesis and signalling.
Salt stress represses the expression of transcription factors involved in phytohormone signalling
Salt stress not only repressed the expression of transcription factors related to ABA signalling but also induced the expression of transcription factors associated with GA and auxin signalling (Figs 6 and 7). The role of transcription factors in salt stress has been demonstrated in a range of plant species. For instance, over-expression of a NAC transcription factor gene, cloned from Thellungiella halophile, especially improved salt stress tolerance in Arabidopsis by a positive regulation of ion transport (Liu et al., Reference Liu, Wang, Li, Peng and Zhang2018). The MYB family, characterized by the N-terminus conserved MYB repeats, are involved in the regulation of biotic and abiotic stresses (Roy, Reference Roy2016). In Arabidopsis, MYB4 controls production of UV-protecting sunscreens (Jin et al., Reference Jin, Cominelli, Bailey, Parr, Mehrtens, Jones, Tonelli, Weisshaar and Martin2000). MYB60 and MYB96 regulate many plant responses to drought stress through ABA signalling (Seo and Park, Reference Seo and Park2010). The MYB genes OsMYB2, OsMYB3R-2 and OsMYB4 from rice have been identified as important components of plant abiotic stress response pathways (Vannini et al., Reference Vannini, Locatelli, Bracale, Magnani, Marsoni, Osnato, Mattana, Baldoni and Coraggio2004; Ma et al., Reference Ma, Dai, Xu, Guo, Liu, Chen, Xiao, Zhang, Xu, Zhang and Chong2009a; Yang et al., Reference Yang, Xiaoyan and Zhang2012). In this context, our study shows that the MYB family of transcription factors is depressed by salt stress (Fig. 6). Besides the MYB transcription factors, the transcription factors IAA18, IAA19, BT1 and BT2 were also down-regulated by salt stress (Fig. 7). These results suggest that transcription factors involved in phytohormone signalling are important factors of the salt stress response pathway in Arabidopsis.
Salt stress represses the expression of genes related to anti-oxidant response
Reactive oxygen species (ROS), including the superoxide hydrogen peroxide and hydroxyl free radicals, are assumed to be linked to seed germination (Apel and Hirt, Reference Apel and Hirt2004). During imbibition the fast water uptake and activation of respiration may result in high ROS generation, which can lead to DNA oxidative damage (Macovei et al., Reference Macovei, Pagano, Leonetti, Carbonera, Balestrazzi and Araújo2017). In addition, ROS are also involved in seed germination as signalling molecules, mediated by phytohormones such as ABA, GA, ethylene, auxin, cytokinin, brassinosteroids, jasmonic acid or salicylic acid (Zhang et al., Reference Zhang, Zhang, Yang, Wang, Sun, Li, Cao, Weeda, Zhao, Ren and Guo2014; Bi et al., Reference Bi, Ma, Wu, Yu, Liang, Lu and Wang2017; Li et al., Reference Li, Xu, Gao, Wang, Guo, Luo, Huang, Hu, Sheteiwy, Guan and Hu2017; Ishibashi et al., Reference Ishibashi, Aoki, Kasa, Sakamoto, Kai, Tomokiyo, Watabe, Yuasa and Iwaya-Inoue2017; Macovei et al., Reference Macovei, Pagano, Leonetti, Carbonera, Balestrazzi and Araújo2017). For example, inhibition of catalase activity and H2O2 generation inhibits seed germination of Col-0, abi5 mutants and ABI5 over-expression transgenic lines in Arabidopsis (Bi et al., Reference Bi, Ma, Wu, Yu, Liang, Lu and Wang2017). In barley, the balance between ABA and ROS regulates seed dormancy and germination (Ishibashi et al., Reference Ishibashi, Aoki, Kasa, Sakamoto, Kai, Tomokiyo, Watabe, Yuasa and Iwaya-Inoue2017). Exogenously applied ABA or GA resulted in modulating ROS levels in Arabidopsis (Ye et al., Reference Ye, Zhu, Liu, Zhang, Li, Liu, Shi, Jia and Zhang2012; Lariguet et al., Reference Lariguet, Ranocha, De Meyer, Barbier, Penel and Dunand2013). The ROS balance is maintained by anti-oxidant systems. During seed germination the activities of catalase (CAT), superoxide dismutase (SOD), ascorbate peroxidase (APX) and gluthatione reductase (GR) may be regulated to modulate ROS levels (Oracz et al., Reference Oracz, El-Maarouf-Bouteau, Kranner, Bogatek, Corbineau and Bailly2009; Ye et al., Reference Ye, Zhu, Liu, Zhang, Li, Liu, Shi, Jia and Zhang2012). Here we show that molecular function GO terms such as anti-oxidant activity were particularly enriched in the down-regulated gene set upon treatment by 100 and 150 mM NaCl (Fig. 8). Twelve genes were down-regulated by both 100 and 150 mM NaCl (Fig. 6). Among these two genes code for APX, two for glutathione peroxidase and one for SOD. These results show that salt stress represses the expression of genes coding for peroxidases. The down-regulation of these genes may result in accumulation of ROS, which inhibit seed germination both as signaling and damaging molecules.
Author ORCIDs
Ye Jin, 0000-0002-5946-3267
Acknowledgements
This work was financially supported by the National Natural Science Foundation of China (no. 31200192), the self-determined research funds of CCNU from the colleges’ basic research and operation of MOE (nos CCNU14KFY003, CNU16A05010 and CCNU18KYZHSY11), and a project of the Hubei Key Laboratory of Genetic Regulation and Integrative Biology (no. GRIB201705).
Author contributions
Y.J. designed research. A.L., K.X. and Y.J. carried out most of the experiments. A.L., K.X., Y.W., W.Y. and Y.J. analysed data. Y.J. wrote the paper. Y.W. and W.Y. revised the manuscript. All authors read and approved the final manuscript.
Data availability
The datasets analysed for this study can be found in the SRA database: https://www.ncbi.nlm.nih.gov/sra/SRP150903
Supplementary material
To view supplementary material for this article, please visit https://doi.org/10.1017/S0960258519000047.
Supplemental figure 1. The COG (Cluster of Orthologous Groups of proteins) function classification of differentially expressed genes (DGEs) in response to NaCl stress. (A) The COG function classification of DGEs in response to 100 mM NaCl stress. (B) The COG function classification of DGEs in response to 150 mM NaCl stress.
Supplemental figure 2. Significantly enriched biological process Gene Ontology terms for the co-upregulated genes.
Supplemental figure 3. Significantly enriched biological process Gene Ontology terms for the co-downregulated genes.
Supplemental table 1. Differentially expressed genes (DEGs) in response to 100 and 150 mM NaCl stress.
Supplemental table 2. The commonly up- and down-regulated genes in 100 and 150 mM NaCl treated samples.
Supplemental table 3. The relative expression of the genes mentioned in our manuscript, which are regulated by 100 and 150 mM NaCl, was confirmed by RT-PCR. The ‘±’ indicates SD of four biological replicates.