Introduction
Plants respond to water stress (WS) via complex physiological and metabolic processes that lead to carbon accumulation and distribution between different organs (Lipiec et al., Reference Lipiec, Doussan, Nosalewicz and Kondracka2013). Plants primarily transiently store carbon in the form of starch and soluble sugars, and it is an important indicator of assimilate accumulation. Variations in the distribution of these carbon forms in wheat affect seed yield under WS (Xue et al., Reference Xue, McIntyre, Jenkins, Glassop, van Herwaarden and Shorter2008). A significant positive correlation between the number of fertile florets and spike carbon accumulation has been reported in wheat (González et al., Reference González, Miralles and Slafer2011; Zhang et al., Reference Zhang, Li, Hu, Li, Qin, Li, Gao, Liu, Sun, Yu, Wang and Zhang2021a). During the reproductive stage, the impact of water deficit to seed number is larger than the spike seed weight (Fischer, Reference Fischer2008, Reference Fischer2011). Previous studies have shown that WS is beneficial to grain filling, thereby increasing the seed yield (Wang et al., Reference Wang, Li, Gong, Yang, Yi, Zhang and Ye2020). Grain filling primarily transports soluble sugar from stems and leaves to spikes, followed by starch synthesis and accumulation. Therefore, the accumulation of starch in grains is very important because starch is the main component of seeds (Panigrahi et al., Reference Panigrahi, Kariali, Panda, Lafarge and Mohapatra2019).
Grain filling is significantly correlated with carbon utilization in stems and leaves under WS conditions (Wang et al., Reference Wang, Li, Gong, Yang, Yi, Zhang and Ye2020). This correlation is primarily due to an increase in carbon accumulation in spikes via the promotion of the translocation of assimilates from stems to spikes, which increases the seed yield (Kirby, Reference Kirby1988; Fischer, Reference Fischer2011). Many plant hormones and genes regulate these metabolic processes (Du et al., Reference Du, Wu, Chang, Li, Xiao and Xiong2013; Zhang et al., Reference Zhang, Huang, Gao, Liu, Li, Zhou, Yao, Wang, Sun and Zhang2020). For example, abscisic acid (ABA) regulates plant adaptive responses to various environmental stresses and affects many physiological and developmental processes (Ghanem et al., Reference Ghanem, Albacete, Smigocki, Frébort, Pospíšilová, Martínez-Andújar, Acosta, Sánchez-Bravo, Lutts, Dodd and Pérez-Alfocea2011; Mohammadi et al., Reference Mohammadi, Etemadi, Arab, Aalifar, Arab and Pessarakli2017). The expression levels of the NCED1 (9-cis-epoxycarotenoid dioxygenase 1), ABA8OX1 (ABA 8′-hydroxylase 1) and ABA8OX2 (ABA 8′-hydroxylase 2) genes may determine the ABA concentration. These genes are related to enzyme activities involved in the sugar metabolism pathway, which promotes the remobilization of carbon reserves in rice stems and the conversion of soluble sugar into starch in spikes (Wang et al., Reference Wang, Hao, Gao, Chen, Liu, Yang, Ye and Zhang2017, Reference Wang, Li, Feng, Chen, Meng, Ye and Zhang2019a,Reference Wang, Li, Wang, Yang, Duan, Zhang and Yeb). Under WS, ABA regulates the activities of sucrose synthase (SUS), ADP-glucose pyrophosphorylase (AGP), soluble starch synthase (SSS), the sucrose transporter (SUT) enzyme and starch-branching enzyme (SBE) and the expression of genes involved in the soluble sugar–starch metabolic pathway to promote starch synthesis in spikes (Wang et al., Reference Wang, Xu, Chen, Zhang, Yang and Zhang2015, Reference Wang, Li, Feng, Chen, Meng, Ye and Zhang2019a,Reference Wang, Li, Wang, Yang, Duan, Zhang and Yeb). Sucrose is the main form of transported sugar in plants, and it is distributed to seeds to support storage (Li et al., Reference Li, Sun, Ren, Song, Pei, Liu, Wang, He, Zhang, Zhou, Ma and Yang2018). SUTs and SWEETs (sugars will eventually be exported transporters) play key roles in the translocation of assimilates from sources to seeds (Eom et al., Reference Eom, Chen, Sosso, Julius, Lin, Qu, Braun and Frommer2015; Li et al., Reference Li, Sun, Ren, Song, Pei, Liu, Wang, He, Zhang, Zhou, Ma and Yang2018).
Cleistogenes songorica (Roshevitz) Ohwi is a perennial Poaceae C4 plant that is native to temperate arid, semi-arid and desert areas in central Eurasia, including northern China, Russia, Kyrgyzstan, Kazakhstan, Uzbekistan, Turkmenistan and many other countries (Zhang et al., Reference Zhang, John, Wang, Li, Gunawardana, Polotnianka, Spangenberg and Nan2011). It is suitable for use in urban greening, sand fixation, slope protection and ecological restoration in arid and semi-arid areas with annual rainfall over 100 mm (Niu and Nan, Reference Niu and Nan2017; Muvunyi et al., Reference Muvunyi, Yan, Wu, Min, Yan, Kanzana, Wang and Zhang2018; Yan et al., Reference Yan, Wu, Yan, Li, Ma, Zhang, Zhao, Wang and Zhang2019). For example, it is being used in a greening project in the northern and southern mountains of Lanzhou and mine restoration in Wuhai city, Inner Mongolia. C. songorica exhibits a dimorphic flowering mechanism in single plants that involves self-pollination (cleistogamy, CL) on spike flowers embedded in the leaf sheath at each node and open pollination (chasmogamy, CH) on the top panicle. This mechanism enables it to survive and reproduce under extreme conditions (Wu et al., Reference Wu, Zhang, Muvunyi, Yan, Zhang, Yan, Cao, Wang and Zhang2018). Therefore, the seeds of C. songorica are produced on CL spikes and CH spikes. However, the seed supply is insufficient due to the low seed yield of C. songorica, which limits its large-scale application in many fields, such as ecological restoration and grassland development (Li et al., Reference Li, Wang, Wei, Tai, Jia, Hu and Trethewey2014; Tao et al., Reference Tao, Lv, Mo, Bai, Han and Wang2018). Previous studies have shown that irrigation at the early flowering stage is an important aspect of successful seed production (Tao et al., Reference Tao, Bai, Jia, Han and Wang2021). However, the potential role of gene regulation in the WS-induced improvement of carbon reserve remobilization from source (stems, leaves and sheaths) sites, and the interaction between sources, CL spikes and CH spikes at the transcriptional level is not clear in C. songorica.
A chromosome-level genome was sequenced recently to elucidate the mechanism underlying the drought tolerance of C. songorica (Zhang et al., Reference Zhang, Wu, Yan, John, Cao, Xu, Zhang, Ma, Zong, Li, Liu, Zhang, Zhao, Kanzana, Lv, Nan, Spangenberg and Wang2021b). We analysed the transcriptome profiles of sources, CL spikes and CH spikes to examine carbon reserve remobilization from sources to CL spikes and CH spikes under WS conditions. The present study determined how the responses and interactions of sources, CL spikes and CH spikes under WS at the phenotypic, metabolic and transcriptional levels ultimately affect seed yield in C. songorica. Our results provide insight into interorgan coordination during WS in this important grass.
Materials and methods
Plant growth and water conditions
The field experiment was performed at the Minqing Experimental Station of the College of Pastoral Agriculture Science and Technology, Lanzhou University, Gansu, China (38.75°N, 103.02°E; 1307 m above sea level). The ‘Tenggeri’ cultivar of C. songorica (variety registration number: 499) was selected for this work (Fig. 1a). The study site is located in a typical arid environment with a frost-free period of approximately 160 d. The average annual temperature is 8.8°C, and the annual mean precipitation is 110 mm, with 90% of the total precipitation occurring during the C. songorica growing season (April to September). The soil of the study site is a sandy loam with an average dry bulk density of 1.39 g cm−3. Before planting, the upper 30 cm of the soil had a pH value of 7.68, total N content of 6.89 g kg−1, organic matter content of 12.16 g kg−1, available N content of 28.72 mg kg−1, available P content of 17.53 mg kg−1 and available K content of 113.95 mg kg−1. The experiment was performed in a randomized block design, and planting was performed on 14 June 2018. The plot area was 8.75 m2 (2.5 m × 3.5 m), the plant spacing and row spacing were 50 cm and the plot spacing was 1 m. Two watering treatment gradients [the well-watered (WW) and WS treatments] were established up with four replicates. Artificial supplementary winter irrigation, turning green stage irrigation and initial flowering stage irrigation were performed as the WW treatment of the drip irrigation system, and the WS treatment was established with the same irrigation conditions as WW except that no supplementary initial flowering irrigation was performed (Fig. 1b). The soil water content at a depth of 30 cm from the winter irrigation to the maturation stage was determined daily using a LoggerNet (Campbell Scientific Inc., Logan, UT, USA).

Fig. 1. Phenotypic characteristics and WS of C. songorica. (a) Phenotype photo during the filling stage under the WW condition. (b) Soil water content was monitored from before the treatment to the mature stage. (c) Plant height at the filling stage. Data are the mean (±SD), n = 12. (d) Branch number at the filling stage. The values represent the average of four biological replicates, and the error bars represent the standard deviation. * indicates a significant difference at P < 0.05 between the two water treatments as determined by Student's t-test.
Sampling procedure and determination of seed yield traits
Source material (stems, leaves and sheaths), CL spike and CH spike samples from each treatment were collected at the seed filling stage, milk stage and dough stage for soluble sugar, starch and ABA content determinations and RNA-seq. The fresh tissues were immediately frozen in liquid nitrogen and then stored in a −80°C freezer. The structure of whole spikes in C. songorica includes CL spikes (lower spikes, generally including nine spike nodes) and CH spikes (top spike). Therefore, we divided the spikes along the individual internodes into four sections: CL_B nodes (bottom nodes, from 1 to 3), CL_M nodes (middle nodes, from 4 to 6) and CL_U nodes (upper nodes, from 7 to 9) (Wu et al., Reference Wu, Zhang, Muvunyi, Yan, Zhang, Yan, Cao, Wang and Zhang2018). At the seed mature stage, the seeds of the CL_B spike, CL_M spike, CL_U spike and CH spike were collected for the determination of the seed yield per spike, seed number per spike and 1000-seed weight.
Measurement of plant soluble sugar, starch and ABA contents
To extract soluble sugar, 200 mg of tissue samples were directly extracted in 10 ml of boiling water for 1 h, the supernatant was collected and the residues were extracted a second time in 7 ml of boiling water for 1 h. The extract was then passed through a 0.45 μm filter membrane, and a 20 μl aliquot was used for measurements with a plant soluble sugar content kit (Mlbio, Shanghai, China). Tissue samples of 200 mg were also used for starch measurements with a plant starch content kit (Mlbio). The determination of endogenous ABA contents in plant samples was performed with an enzyme-linked immunosorbent assay (ELISA) kit (Mlbio). Three biological replicates and three technical replicates were performed for each sample.
RNA extraction and sequencing
Pooled samples of sources, CL spikes and CH spikes were collected at the filling stage. Total RNA was extracted using an UNlQ-10 Column TRIzol Total RNA Isolation Kit (Sangon Biotech, Shanghai, China). RNA purity and integrity were assessed using an Agilent 2100 system. Sequencing libraries were sequenced on the Illumina NovaSeq 6000 platform (Novogene, Tianjin, China). Clean data were obtained by removing reads containing low-quality reads, adapters and poly-N sequences from the raw data. The clean reads were mapped back onto the reference genome sequences (Zhang et al., Reference Zhang, Wu, Yan, John, Cao, Xu, Zhang, Ma, Zong, Li, Liu, Zhang, Zhao, Kanzana, Lv, Nan, Spangenberg and Wang2021b) using Bowtie2 (http://bowtie-bio.sourceforge.net/bowtie2/manual.shtml) and HISAT2 (https://daehwankimlab.github.io/hisat2/) in the research team server. Fold change ≥2 and q-value <0.05 were employed as the filter criteria of DEGs. Transcriptome sequencing generated a total of 401,841,926 raw reads and 383,199,207 clean reads from 18 samples, ranging from 18,901,105 to 23,832,291 reads per sample (Supplementary Table S2). The original data were uploaded to the NCBI database under project number PRJNA734039.
WGCNA and gene function annotation
After discarding undetectable or relatively low expression genes (TPM < 10), the identified differentially expressed genes (DEGs) (CV > 0.5) were used to generate co-expression network modules with the weighted gene co-expression network analysis (WGCNA) package in R (Version 3.6.0). The co-expression modules were obtained using the automatic network construction function with the default parameters. The eigengene value was calculated for each module and used to search for associations with different samples. For the functional annotation of genes, the annotations of the C. songorica genome were used as a reference (Zhang et al., Reference Zhang, Wu, Yan, John, Cao, Xu, Zhang, Ma, Zong, Li, Liu, Zhang, Zhao, Kanzana, Lv, Nan, Spangenberg and Wang2021b). For the genes in the modules, Gene Ontology (GO) and Kyoto Encyclopedia of Genes and Genomes (KEGG) annotation and enrichment analyses were performed using GOSeq (v.1.22) and the KO-Based Annotation System (KOBAS) (v.2.0), respectively (Mao et al., Reference Mao, Cai, Olyarchuk and Wei2005).
Quantitative real-time PCR
RNA was extracted from the samples collected at the filling stage for qRT-PCR. The specific primer sequences are shown in Supplementary Table S1. Total RNA was reverse-transcribed into cDNA using a TIANScript II RT Kit (Tiangen Biotech, Beijing, China). qRT-PCR results were visualized with Hieff® qPCR SYBR Green Master Mix (Yeasen Biotech, Shanghai, China) on a CFX96 system (Bio-Rad, China). The 2−ΔΔCT method was used to quantify the relative expression of the target gene mRNAs. The expression level of the CsGADPH gene was used as an internal control (Zong et al., Reference Zong, Yan, Wu, Ma and Zhang2020).
Statistical analysis
All data were subjected to analysis of variance (ANOVA) using Statistical Package for Social Scientists (SPSS) software (v. 25.0). One-way ANOVA with Student's t-test as post hoc analysis was used to compare the means. Graphics were generated using Origin 2021b (https://www.originlab.com/).
Results
Phenotypic analysis of seed yield traits under WS
The WW treatment included supplemental irrigation at the initial flowering stage, and the soil water content reached 27%. At the filling stage, the soil water contents of WW and WS were largely consistent, and the soil water content was maintained at approximately 10% until the maturation stage (Fig. 1b). At the filling stage, the plant height under WS was greater than that under WW, but the difference was not significant. However, the branch number under WW was significantly greater than that under WS (P < 0.05) (Fig. 1c, d).
The seed number per spike, 1000-seed weight and seed yield per spike were measured when the seed water content was 8–10% at maturity. The seed numbers per CL_B spike, CL_U spike (P < 0.05) and CL_M spike (P < 0.01) under WS were significantly higher than those under WW. The seed number per CH spike was also higher than that under the WW, but the difference was not significant. The average 1000-seed weight of CL spikes and CH spikes under WW was significantly higher than that under WS (P < 0.01). The average seed yield per CL spike and CH spike under WS was significantly higher than that under WW (P < 0.05) (Fig. 2a).

Fig. 2. The seed phenotype and soluble sugar and starch contents of stems, leaves, CL spikes and CH spikes during seed development stages under WS conditions. (a) The phenotype of seeds at the mature stage. (b) Soluble sugar and starch contents at the filling stage, milk stage and dough stage. The values represent the average of four biological replicates and error bars represent the standard deviation. * indicates a significant difference at P < 0.05, and ** indicates a significant difference at P < 0.01 between the two water treatments as determined by Student's t-test.
Sugar and starch accumulate in the sources, CL spikes and CH spikes under WS
We measured the soluble sugar and starch contents of the sources, CL spikes and CH spikes at the filling stage, milk stage and dough stage under both WW and WS conditions. At the milk stage, the soluble sugar contents of the sources and CL spikes were significantly higher than those under WW (P < 0.01). However, the soluble sugar contents of the CH spikes increased gradually from the filling stage to the milk stage, which were 17.88 ± 0.61 and 21.58 ± 0.41 mg/g, respectively, and these values were significantly higher than those under WW. The starch contents of the sources initially increased, then decreased from the filling stage to the dough stage, and the content was the highest in the milk stage. The starch content under WS was 13.28 ± 1.85 mg g−1, which was significantly higher than that under WW (P < 0.01). In contrast, the starch contents in the CL spikes and CH spikes increased gradually from the filling stage to the dough stage, and the content was highest in the dough stage. Under WS, the starch contents in the CL spikes and CH spikes in the dough stage were 91.02 ± 7.35 and 27.81 ± 0.6 mg g−1, respectively, which were significantly higher than those under WW (P < 0.01). Notably, the starch content of the CL spikes at the dough stage was 3.3 and 2 times under WS and WW, respectively, compared to that of the CH spikes. The starch contents of the CL spikes were significantly higher than those of the CH spikes at the dough stage (P < 0.01) (Fig. 2b).
More DEGs were identified under WS than WW
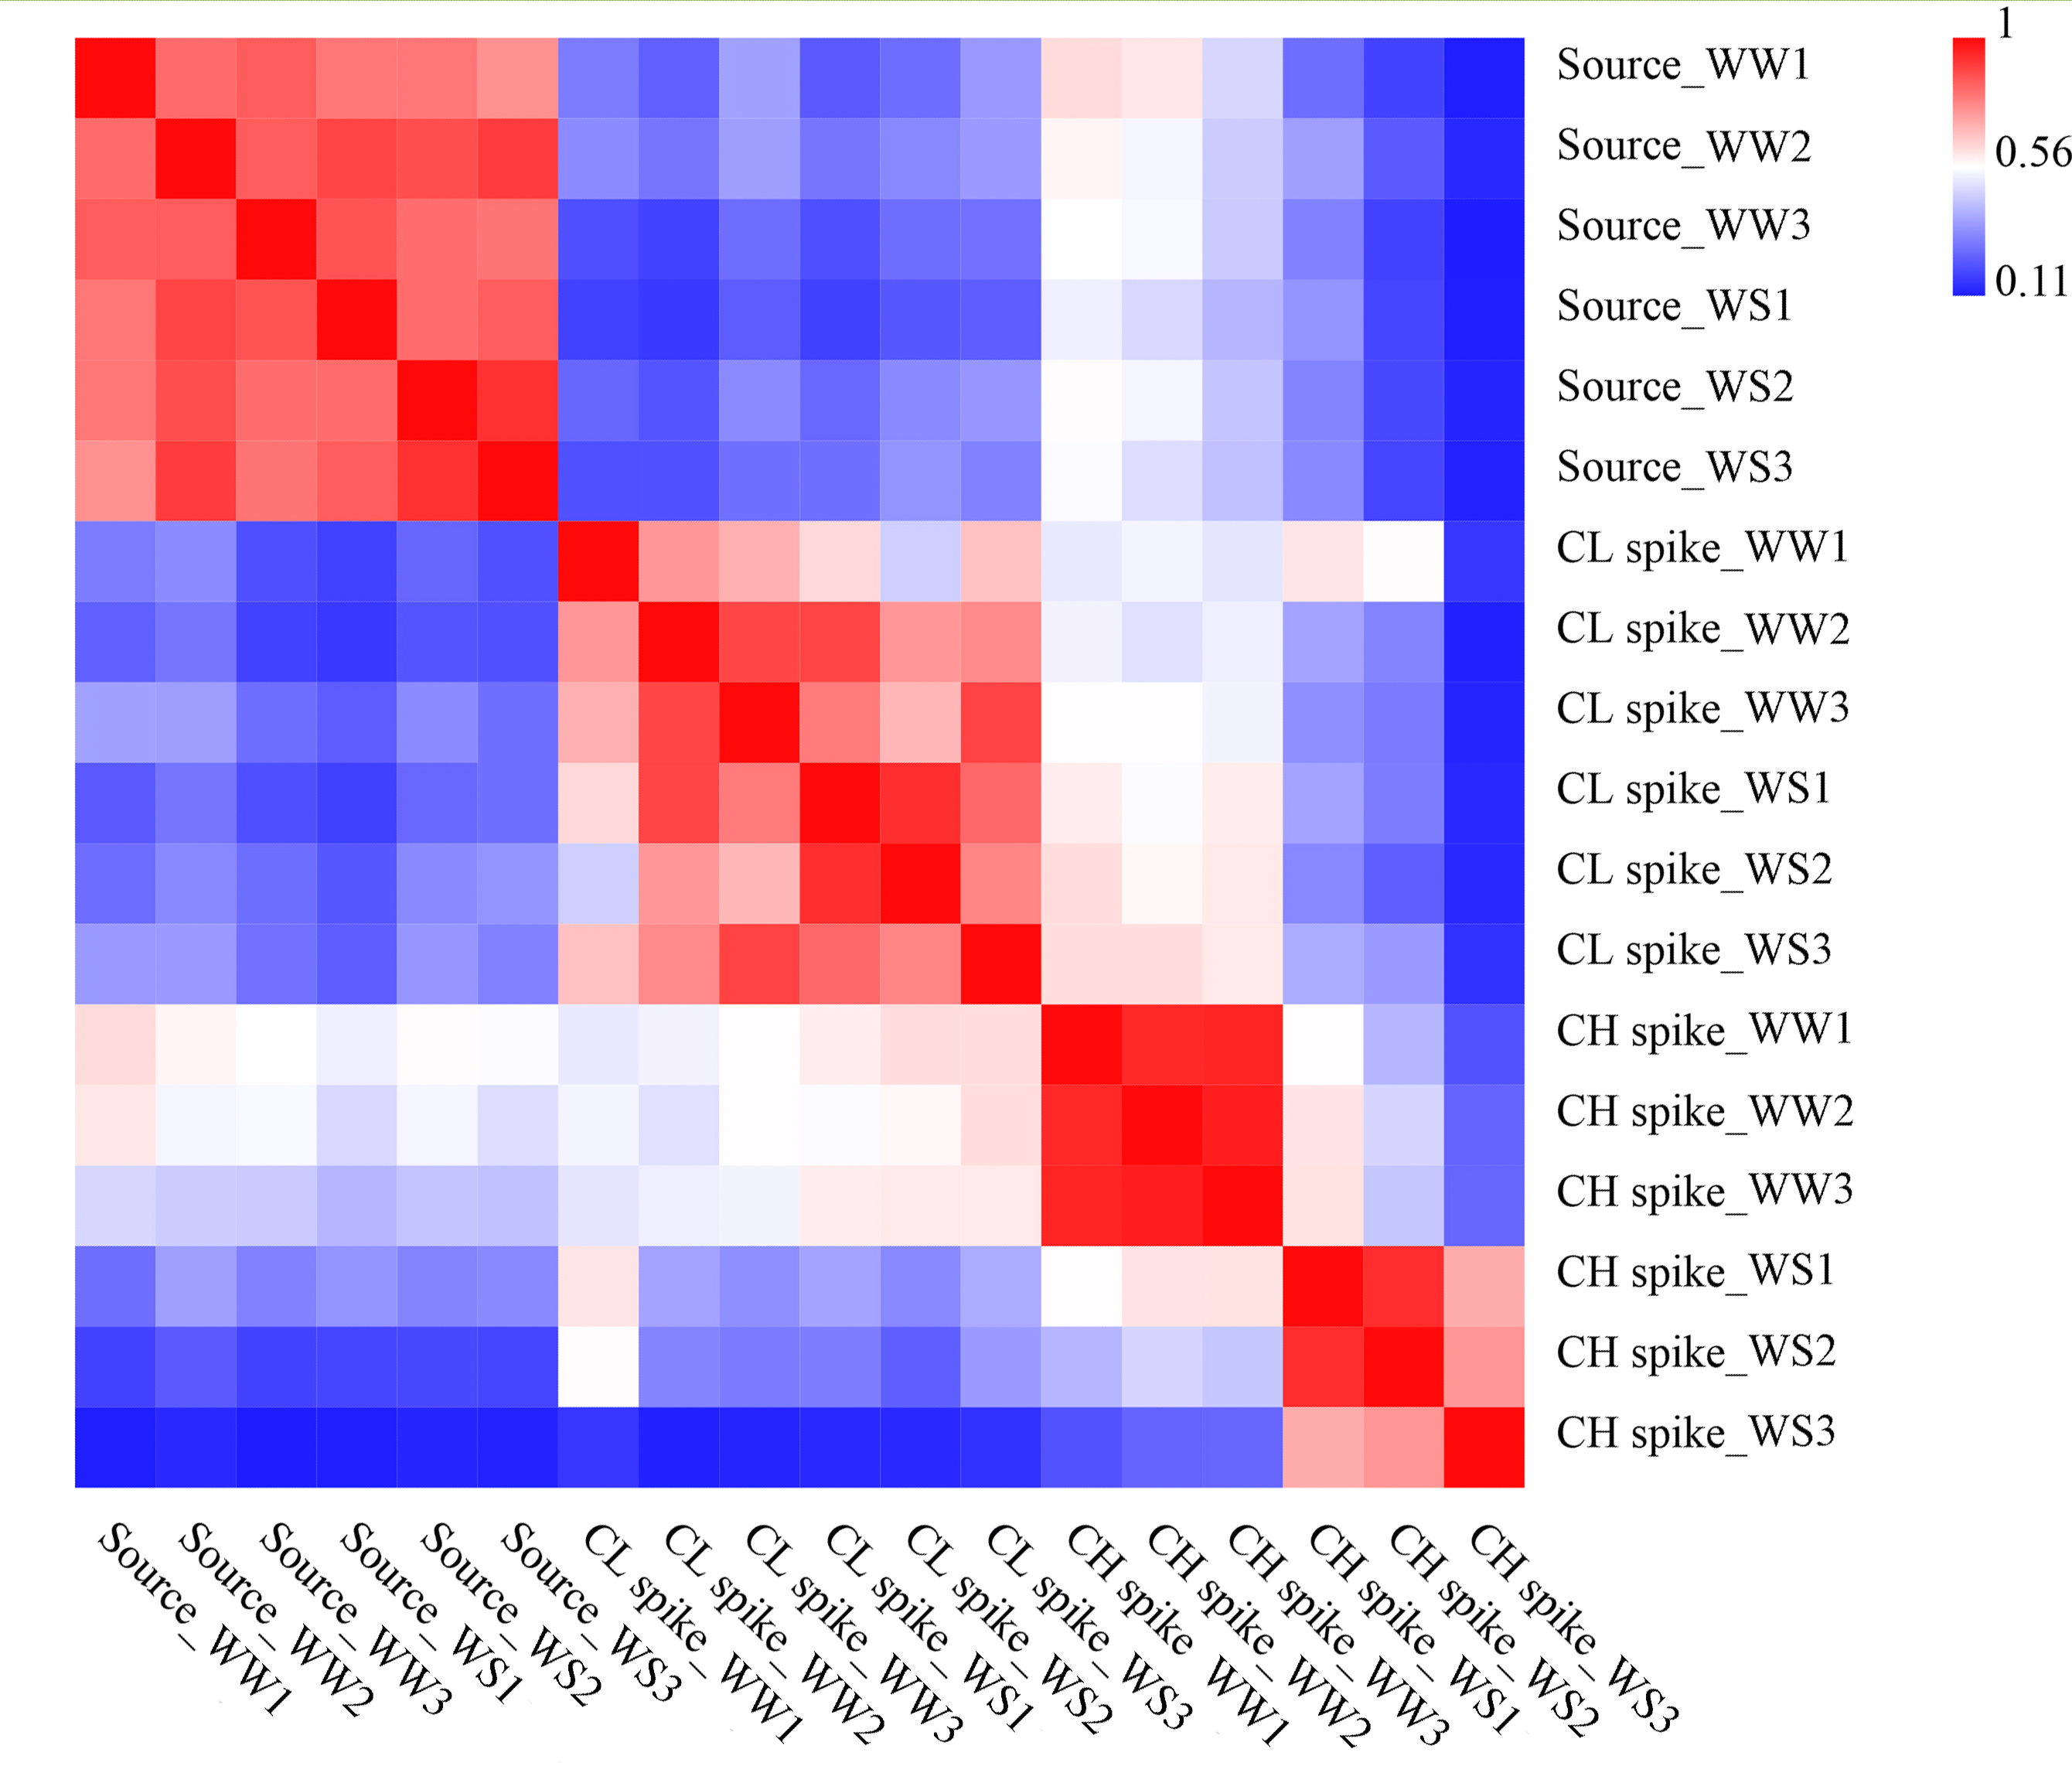
We used the reference genome sequence of C. songorica for alignment and gene expression calculation (Zhang et al., Reference Zhang, Wu, Yan, John, Cao, Xu, Zhang, Ma, Zong, Li, Liu, Zhang, Zhao, Kanzana, Lv, Nan, Spangenberg and Wang2021b). Pearson's correlation coefficients of different samples showed that the three biological replicates of each sample were strongly correlated (P < 0.01) (Supplementary Fig. S1). To understand gene expression changes in the sources, CL spikes and CH spikes under WW and WS conditions, we divided the three comparison groups into two DEG categories (Fig. 3a). A total of 54,525 DEGs were identified under WS conditions, 3,744 of which were shared among all comparison groups. A total of 43,263 DEGs were identified under WW conditions, 2,675 of which were shared among all comparison groups (Fig. 3b). Notably, there were more upregulated genes than downregulated genes in the source versus CH spike comparison group under WS and WW conditions. Similarly, all other comparison groups had more upregulated genes than downregulated genes except for the CL spike_WS versus CH spike_WS group. We also found that the number of DEGs identified under the WS condition was greater than that under the WW condition (Fig. 3b). We compared the differential gene expression between the sources, CL spikes and CH spikes under WS and WW conditions and found 27,496 DEGs in the CL spike_WW versus CH spike_WW and CL spike_WS versus CH spike_WS groups, and the number of CL spike_WS versus CH spike_WS group of downregulated genes was greater than the number of upregulated genes (Fig. 3).

Fig. 3. Summary of DEGs (fold change ≥2; q < 0.05) in the six comparison groups (a) and overlapping DEGs in different comparison groups. Red bar upregulated genes and blue bar downregulated genes. (b) Number of DEGs under the WW treatment, (c) number of DEGs under the WS treatment.
Regulation mechanism of spike development under WS
To better identify the DEGs related to the sources, CL spikes and CH spikes and their expression trends under WS and WW conditions, the 21,854 DEGs were analysed via gene co-expression network analysis. Ten modules (clusters of highly related genes) were generated, and each module is represented by a different colour (Fig. 4a, b). We found four modules associated with specific watering conditions or sample expression: the dark red, salmon, light cyan and brown modules (Fig. 4c). To better understand the biological functions of these four modules, we performed KEGG enrichment analysis of the genes in these four modules (Fig. 4d).

Fig. 4. WGCNA results of DEGs. (a) Cluster dendrogram, (b) module-trait relationships, (c) expression heatmap and expression levels of genes in the modules and (d) KEGG enrichment of genes in the modules.
The dark red and salmon modules contain genes with obviously higher expression in the source, as induced by WS and WW at the filling stage. The genes in the dark red module were significantly enriched in photosynthesis (ko00195) and photosynthesis-antenna proteins (ko00196). The genes in the salmon module were significantly enriched in 13 pathways, including starch and sucrose metabolism (ko00500), carbon metabolism (ko01200) and photosynthesis-antenna proteins (ko00196) (Fig. 4d and Supplementary Table S3). Genes only in the CH spike showed obviously high expression in the brown module at the filling stage under WS. The genes were significantly enriched in 17 pathways, including starch and sucrose metabolism (ko00500), carbon metabolism (ko01200) and mitogen-activated protein kinase (MAPK) signalling pathway-plant (ko04016) (Fig. 4d and Supplementary Table S3). Genes in the light cyan module were enriched in 11 pathways, such as cutin, suberine and wax biosynthesis (ko00073), glycolysis/gluconeogenesis (ko00010) and other types of O-glycan biosynthesis (ko00514). It showed higher expression when WW was applied at the filling stage for CL spike and CH spike and WS was applied at the filling stage for CL spike.
Notably, there were few pathways shared by genes in the four modules (Supplementary Table S3). The dark red and salmon modules shared one pathway, photosynthesis-antenna proteins (ko00196). Similarly, the salmon and brown modules shared six pathways: metabolic pathways (ko01100), biosynthesis of secondary metabolites (ko01110), glyoxylate and dicarboxylate metabolism (ko00630), MAPK signalling pathway – plant (ko04016), starch and sucrose metabolism (ko00500) and carbon metabolism (ko01200). The light cyan module did not share pathways with any module.
Expression pattern of genes involved in starch and sucrose metabolism
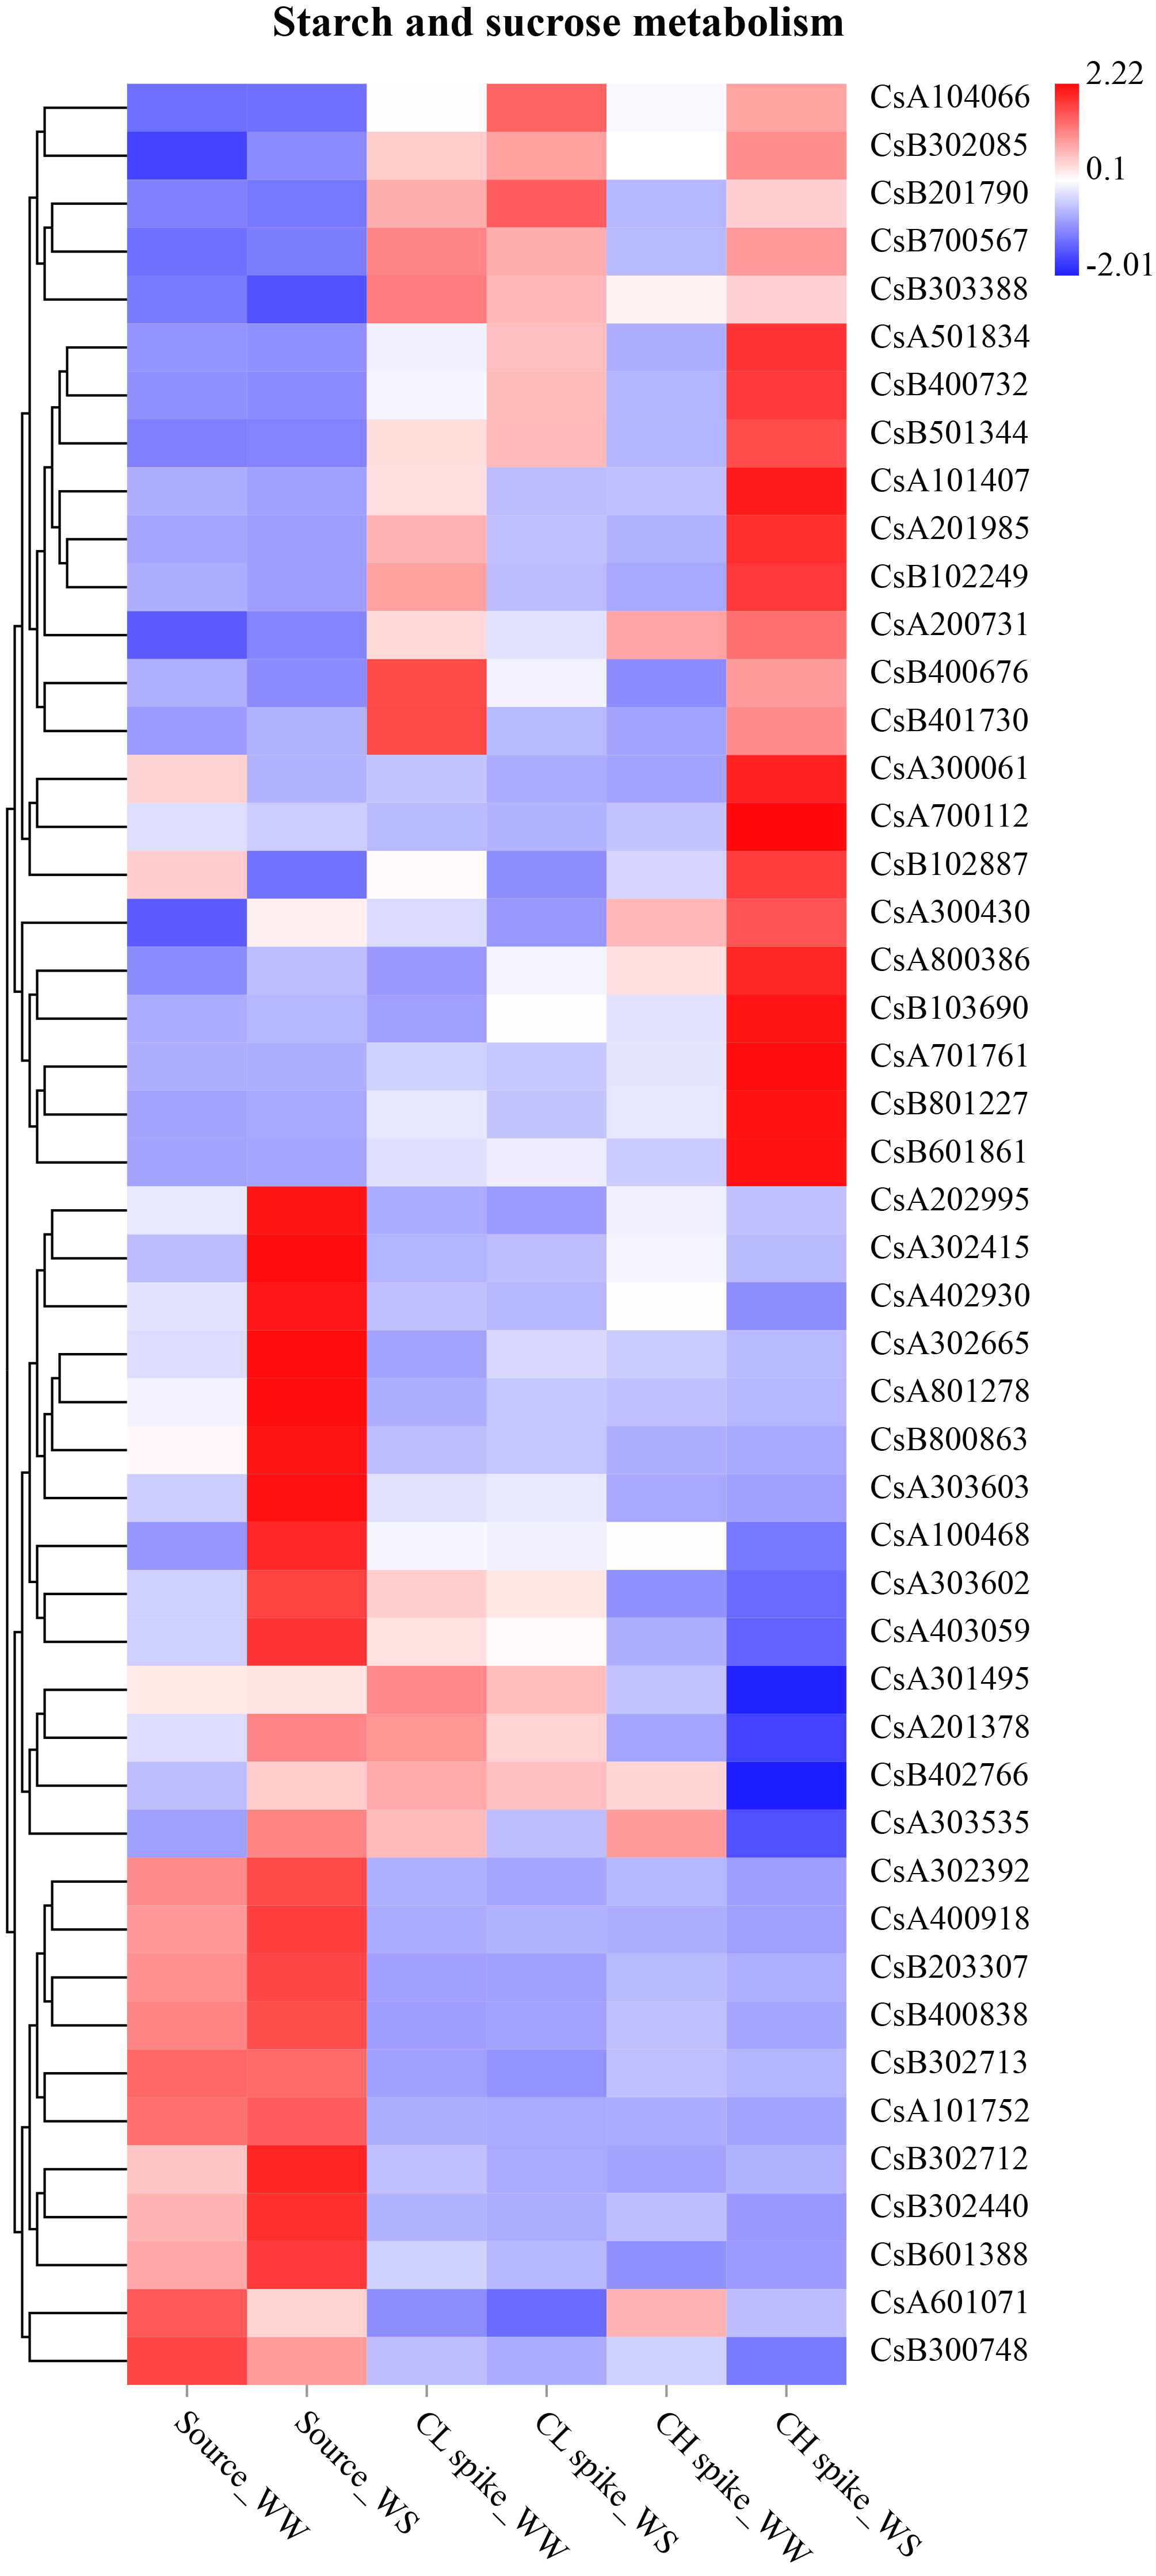
The DEGs involved in the starch and sucrose metabolism pathways were collected from the sources, CL spikes and CH spikes under different water treatments. For example, genes encoding glucose-6-phosphate isomerase (CsA302392, CsB302440) and phosphoglucomutase (CsA101752, CsB800863) were defined as DEGs only in the sources under WS. Genes encoding trehalose-6-phosphatase (CsA101407, CsB102887 and CsB801227) were defined as DEGs only in the CH spikes under WS (Supplementary Fig. S2). Among these different metabolic pathways, carbohydrate transport and metabolism included the most DEGs, and these pathways are the major factors regulating seed set (Ruan et al., Reference Ruan, Patrick, Bouzayen, Osorio and Fernie2012). According to the expression profile, genes involved in starch and sucrose metabolism were significantly altered under WS during the flowering stage. Genes that were significantly upregulated under WS included glucose-6-phosphate isomerase genes and phosphoglucomutase genes in sources and trehalose-6-phosphatase genes in CH spikes (Supplementary Fig. S2).
Genes involved in carbon remobilization from sources to seeds
Carbohydrates are stored primarily as starch in stems and leaves before flowering. Starch is first degraded to glucose, and sucrose is resynthesized when stored carbon is remobilized from stems to seeds. Starch degradation is primarily catalysed by α-amylase and β-amylase. The genes encoding α-amylase (CsA102200) and β-amylase (CsB100929) were highly expressed in the sources, and WS enhanced the expression of the α-amylase gene, which might result in the increased enzyme activity of α-amylase to promote starch degradation during grain filling (Fig. 5a). Photosynthetic assimilates are transported in the form of sucrose from sources (stems, leaves and sheaths) to sinks (CL spikes and CH spikes) then transformed into starch via enzymatic processes. The following five enzymes play vital roles in sucrose-to-starch conversion: SUS, AGP, SSS, SUT and SBE. The spikes exhibited enhanced expression levels of genes encoding CsSUS1 (CsB300532), CsSUS2 (CsB401730), CsSUS3 (CsA300430), CsAGP1 (CsA201985), CsAGP4 (CsB301913), CsAGP5 (CsA301864), CsSSS1 (CsA300235) and CsSBE5 (CsB102249), which are responsible for starch synthesis and starch accumulation (Fig. 5b). Therefore, the integration of upregulated amylase genes in sources and enhanced CsSUS, CsAGP, CsSSS and CsSBE genes in CL spikes and CH spikes promoted the conversion of starch and sucrose to increase seed yields under the WS treatment.

Fig. 5. The FPKM and relative transcript levels of key sucrose transporter and starch synthesis genes in sources, CL spikes and CH spikes in plants under the WS conditions. The values represent the average of three biological replicates and the error bars represent the standard deviation.
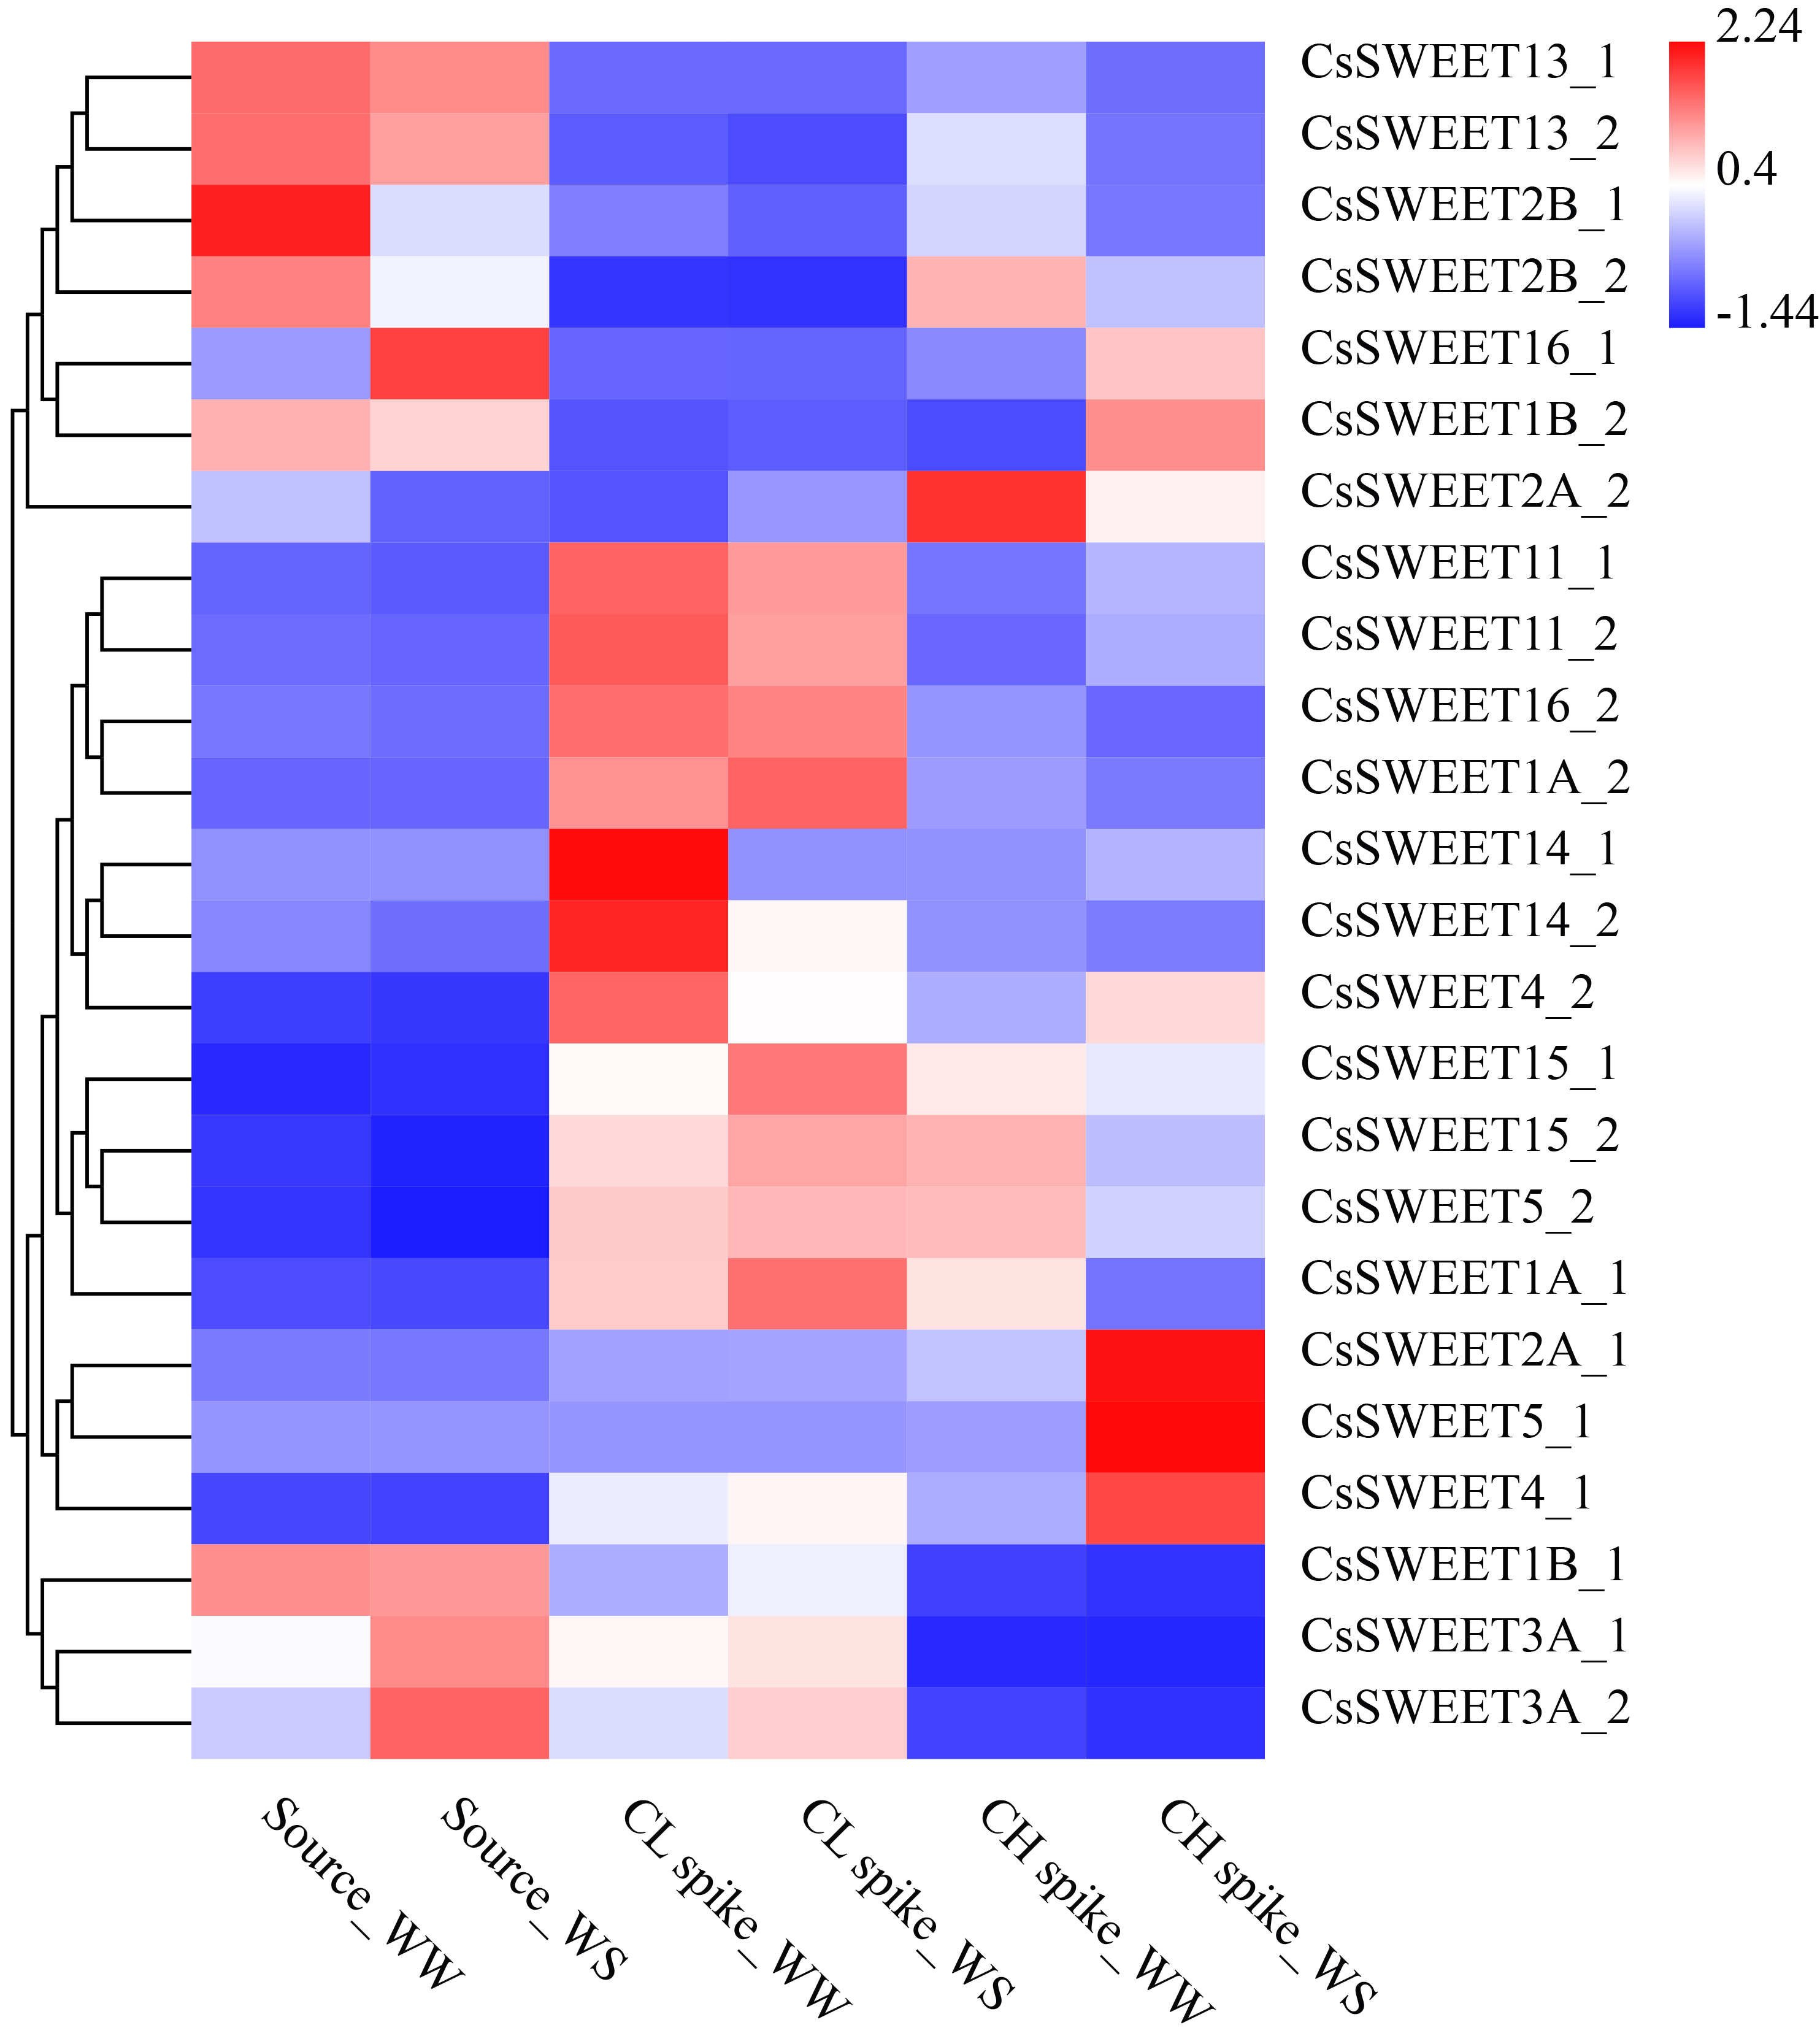
CsSUT1_1 (CsA403323), CsSUT1_2 (CsB403117) and CsSUT2_2 (CsB1000001) were highly expressed in the sources (Fig. 5b). The WS treatment slightly reduced the expression levels of CsSUT1_1, CsSUT1_2 and CsSUT2_2. A total of 24 CsSWEET genes were detected in the source, CL spike and CH spike samples. The expression profiles of the identified CsSWEET genes are shown in Supplementary Fig. S3. Six CsSWEET genes, including CsSWEET1B_2 (CsB701359), CsSWEET2A_1 (CsA202391), CsSWEET4_1 (CsA100972), CsSWEET4_2 (CsB801643), CsSWEET5_1 (CsA700063) and CsSWEET16_1 (CsA402197), were upregulated in the CH spikes across grain filling stages under WS, and CsSWEET1A_1 (CsA200557), CsSWEET2A_2 (CsB202200), CsSWEET2B_2 (CsB501159), CsSWEET5_2 (CsB201923), CsSWEET15_1 (CsA102540) and CsSWEET15_2 (CsB102190) were downregulated during grain filling stages under WS. Most of the CsSWEET genes in the CL spikes were downregulated during grain filling under WS (Supplementary Fig. S3).
Expression of genes related to ABA biosynthesis and catabolism under WS
The WS treatment significantly (P < 0.01) increased the ABA contents of the CL spikes and CH spikes during the grain filling stage (Fig. 6a). We found that the ABA catabolism genes such as CsABA8OX1_1, CsABA8OX1_2, CsABA8OX2_1 and CsABA8OX2_2 were expressed in the CL spikes, CH spikes and sources during grain filling. The WS treatment decreased the expression levels of these genes, despite their relatively low expression levels (Fig. 6b). For example, the WS treatment reduced the expression levels of CsABA8OXs in the sources (Fig. 6b), which was negatively associated with the enhanced ABA contents of the sources (Fig. 6a). There are six NCEDs involved in ABA biosynthesis, including CsNCED1_1, CsNCED1_2, CsNCED3, CsNCED4_1, CsNCED4_2 and CsNCED5 (Fig. 6b). The WS treatment decreased the expression levels of CsNCED1_1, CsNCED1_2, CsNCED3 and CsNCED4_1 in the sources. The WS treatment decreased the expression level of CsNCED5 in the CL spikes. The WS treatment enhanced the expression level of CsNCED4_2 in the CH spikes. These results indicate the pivotal roles of these genes in controlling the ABA contents of the CL spikes, CH spikes and sources.

Fig. 6. Differentially expressed the ABA synthesis and catabolism genes in sources, CL spikes and CH spikes under WS and ABA contents of different tissues. (a) ABA contents of sources, CL spikes and CH spikes, (b) RPKM values of ABA catabolism and synthesis genes. The values represent the average of four biological replicates and the error bars represent the standard deviation. ** indicates a significant difference at P < 0.01.
Discussion
Effects of WS on seed yield per spike
Under WS conditions, the rice grain weight was increased by regulating the transport of carbon from straws to spikelets, which increased the seed yield (Wang et al., Reference Wang, Li, Gong, Yang, Yi, Zhang and Ye2020). Similarly, the WS treatment applied in C. songorica enhanced carbon remobilization in the sources and increased the seed yield per spike by increasing the seed number per spike (CL spikes and CH spikes), especially in CL_B spikes and CL_M spikes, where it increased 2.25 and 1.6 times, respectively. The seed number was one of the components of seed yield, and seed yield per plant was improved when the seed number per spike was increased (Li et al., Reference Li, Wang, Wei, Tai, Jia, Hu and Trethewey2014; Tao et al., Reference Tao, Bai, Jia, Han and Wang2021). Therefore, a well-controlled balance between source and sink at the initial flowering stage was pivotal for C. songorica production under the WS treatment.
To compare differences in the growth patterns of C. songorica under the WS and WW treatments, plant height and branch number were recorded at the filling stage. Plant height was not significantly different between WS and WW, but WW significantly increased the branch number. Similarly, we explored and identified the specific variations in grain number per spike when WS occurred at the initial flowering stage. Compared to WW, WS significantly increased the average seed yield per spike. However, the average 1000-seed weight increased significantly under WW conditions. Therefore, the effect on the seed yield per spike was attributed to the increase in the number of seeds per spike. The WS at the initial flowering stage seemed to be more effective in increasing the seed number per spike. Studies in wheat have shown that an increase in seed number had greater potential to improve yield, especially under WS (Fischer, Reference Fischer2008, Reference Fischer2011; Zhang et al., Reference Zhang, Huang, Gao, Liu, Li, Zhou, Yao, Wang, Sun and Zhang2020).
Regulation of genes involved in sugar synthesis and transport
An effective carbon flow from sources enhanced the seed filling of C. songorica under the WS treatment, which was transported to seeds to increase sink activity and increase the number of seeds per spike. The main carbon storage component in sources is starch. When starch is hydrolysed to soluble sugar (the main component of carbohydrates), which then flows from sources to spikes, the process of starch resynthesis from the soluble sugar in spikes for starch storage results in filling (Li et al., Reference Li, Pan, Cui, Yuan, Hu, Wang, Mohapatra, Nie, Huang and Peng2017). Therefore, the conversion of starch into soluble sugar in sources is essential for the remobilization of carbon reserves. First, starch is hydrolysed by α-amylase and β-amylase (Wang and Zhang, Reference Wang and Zhang2020). The WS treatment enhanced the expression of the genes encoding α-amylase and β-amylase in the sources, which might increase the enzyme activities of α-amylase and β-amylase to promote the conversion of starch into soluble sugars (Wang et al., Reference Wang, Li, Gong, Yang, Yi, Zhang and Ye2020). Compared to WS conditions, the soluble sugar and starch contents of the CL spikes were significantly increased at the filling stage under WW conditions, and opposite results were obtained at the milk stage and the dough stage. The starch contents of the CL spikes and CH spikes continuously increased from the filling stage to the dough stage, and the increase under the WS treatment was significantly faster than that under the WW treatment. Similarly, rice grain filling under the WS treatment was enhanced by effective carbon flow from straw to grain to improve sink activity and grain yield (Wang et al., Reference Wang, Li, Feng, Chen, Meng, Ye and Zhang2019a,Reference Wang, Li, Wang, Yang, Duan, Zhang and Yeb, Reference Wang, Li, Gong, Yang, Yi, Zhang and Ye2020). The WS treatment promoted the flow of carbon reserves from the sources to the spikes in C. songorica. However, the soluble sugar content fluctuated during carbon reserve remobilization. The starch contents of the CL spikes were significantly higher than those of the CH spikes at the dough stage (P < 0.01). This result indicates that sources allocate more carbohydrates to CL spikes, especially under WS. The seed yield of C. songorica was primarily contributed by the CL spikes. This result is consistent with previous reports that CL spikes contributed 85% to seed yield. (Li, Reference Li2015).
Although the application of the WS treatment at the initial flowering stage enhanced prestored carbon reserve remobilization from sources to spikes and increased the seed yield per spike, very little is known about the potential role of gene regulation in the WS-induced improvement of carbon reserve remobilization in sources and the interaction between sources, CL spikes and CH spikes at the transcriptional level. The expression levels of SUS, AGP, SSS, SUT and SBE were increased in spikes, and these genes were responsible for starch synthesis and accumulation in spikes (Wang et al., Reference Wang, Li, Feng, Chen, Meng, Ye and Zhang2019a,Reference Wang, Li, Wang, Yang, Duan, Zhang and Yeb). Therefore, the upregulated expression of the amylase genes CsA102200 and CsB100929 in sources, and the upregulated expression of CsSUS1, CsSUS2, CsSUS3, CsAGP1, CsAGP4, CsAGP5, CsSSS1 and CsSBE5 in spikes under WS jointly promoted carbon flow from sources to spikes, which increased the seed yield per spike of C. songorica.
The sugar transporters found in plants primarily included SUTs and SWEETs, which exhibit seven transmembrane domains (Chen et al., Reference Chen, Hou, Lalonde, Takanaga, Hartung, Qu, Guo, Kim, Underwood, Chaudhuri, Chermak, Antony, White, Somerville, Mudgett and Frommer2010). Twenty-one SWEET transporters and five SUTs are found in rice (Aoki et al., Reference Aoki, Hirose, Scofield, Whitfeld and Furbank2003; Chen et al., Reference Chen, Hou, Lalonde, Takanaga, Hartung, Qu, Guo, Kim, Underwood, Chaudhuri, Chermak, Antony, White, Somerville, Mudgett and Frommer2010; Durand et al., Reference Durand, Mainson, Porcheron, Maurousset, Lemoine and Pourtau2018). The antisense inhibition of OsSUT1 expression leads to seed filling defects (Scofield et al., Reference Scofield, Hirose, Gaudron, Furbank, Upadhyaya and Ohsugi2002). Several sucrose-transporting SWEETs contributed to seed filling in Arabidopsis (Chen et al., Reference Chen, Lin, Qu, Sosso, McFarlane, Londoño, Samuels and Frommer2015). SWEET11 and SWEET15 play key roles in seed filling in rice (Yang et al., Reference Yang, Luo, Yang, Frommer and Eom2018). The gene expression levels of various transporters were altered during grain filling in the present study. The expression levels of CsSUT1_1, CsSUT1_2 and CsSUT2_2 were significantly upregulated by WS versus WW in CH spikes, which indicated that the WS treatment enhanced SUT-mediated sucrose transportation at the transcriptional level. The WS treatment upregulated SUT2 in rice (Wang et al., Reference Wang, Li, Feng, Chen, Meng, Ye and Zhang2019a,Reference Wang, Li, Wang, Yang, Duan, Zhang and Yeb). Therefore, the WS treatment may also enhance the expression of SUTs in C. songorica at the protein level to promote carbon reserve remobilization from sources to CH spikes. The three CsSUT genes were also detected in stems and leaves (sources), which is consistent with previous results (Chen and Wang, Reference Chen and Wang2008; Wang et al., Reference Wang, Hao, Gao, Chen, Liu, Yang, Ye and Zhang2017). Many SWEET genes were also upregulated under WS conditions. For example, CsSWEET16_1 showed high expression levels in sources, and CsSWEET2A_1, CsSWEET4_1 and CsSWEET5_1 showed high expression levels in CH spikes, which may contribute to the remobilization of carbon reserves during grain filling. These results suggest that CsSWEET2A_1, CsSWEET4_1, CsSWEET5_1 and CsWEET16_1 play key roles in grain filling.
Regulation of genes related to ABA metabolism
Plant hormones, especially ABA, are responsible for nutrient remobilization and grain filling (Fan et al., Reference Fan, Jia, Li, Smith, Miller and Shen2007; Wang et al., Reference Wang, Li, Feng, Chen, Meng, Ye and Zhang2019a, Reference Wang, Li, Wang, Yang, Duan, Zhang and Yeb). ABA inhibited starch biosynthesis and improved starch degradation in the leaf sheaths of rice (Chen and Wang, Reference Chen and Wang2012). ABA is one of the most important stress hormones in fruit development and responses to abiotic stress (Dong et al., Reference Dong, Park and Hwang2015). Previous studies have shown that WS during grain filling can increase the endogenous ABA concentration, enhance the enzyme activities of SUS and SBE, and promote the transport of carbon assimilates from source to seeds (Wang et al., Reference Wang, Li, Gong, Yang, Yi, Zhang and Ye2020; Wang and Zhang, Reference Wang and Zhang2020). These results showed that promoting the activities of these enzymes under WS enhanced starch synthesis in seeds. The expression of genes involved in sugar metabolism, such as amylase, SUS and SBE, was closely related to ABA content and the expression levels of genes related to ABA synthesis and catabolism. ABA8OX is a key enzyme in the regulation of ABA levels in many physiological processes (Vallabhaneni and Wurtzel, Reference Vallabhaneni and Wurtzel2010).
NCEDs are the rate-limiting enzymes in the de novo ABA biosynthesis (Dong et al., Reference Dong, Park and Hwang2015). A high ABA content may be due to high expression levels of NCED1 and ABA8OX1, which are related to genes involved in sugar metabolism and promote the remobilization of carbon storage in rice stems (Wang et al., Reference Wang, Hao, Gao, Chen, Liu, Yang, Ye and Zhang2017, Reference Wang, Li, Feng, Chen, Meng, Ye and Zhang2019a,b). CsABA8OX1_1, CsABA8OX1_2, CsABA8OX2_1, CsABA8OX2_2, CsNCED3, CsNCED1_1, CsNCED1_2 and CsNCED4_1 were downregulated in sources under WS conditions in the present study. The downregulated expression of these genes was negatively associated with the increase in ABA content in the source. In contrast, the upregulation of CsNCED4_2 positively correlated with the increased ABA content in CH spikes under WS. The increase in ABA content in spikes under WS was caused by the downregulation of ABA8OX2 (Wang et al., Reference Wang, Li, Feng, Chen, Meng, Ye and Zhang2019a,Reference Wang, Li, Wang, Yang, Duan, Zhang and Yeb). The results showed that the ABA content was regulated by CsABA8OX and CsNCED gene expression in sources and spikes under WS conditions, which further regulated grain filling to increase the seed yield per spike and improve the remobilization of carbon stored in sources (Fig. 7).

Fig. 7. Schematic representation of key starch metabolism-related enzyme translocators in sucrose flows from sources (stems and leaves) to sinks (CL spikes and CH spikes) under WS. (a) Distribution of CL spikes and CH spikes in C. songorica. (b) Sucrose metabolic pathway from sources to sinks. (c) Types of C. songorica spikes. The pale green background represents the sources part, and the white background represents the sinks part. The blue font indicates key genes in the metabolic pathway. The filled colours correspond to their degree of regulation in response to WS, in which the left side of the filling colour represents the expression level of CL spike, and the right side represents the expression level of CH spike. MOS, malto-oligosaccharides; Mal, maltose; Glc, glucose; F6P, fructose 6-phosphate; E4P, erythrose 4-phosphate; CB cycle, Calvin-Benson cycle; FBP, fructose 1,6-bisphosphate; G6P, glucose 6-phosphate; G1P, glucose 1-phosphate; PPi, inorganic pyrophosphate; UDPG, UDP-glucose; S6P, sucrose 6-phosphate; ADPG, ADP-glucose; Fru, fructose.
In conclusion, the CsABA8OX and CsNCED genes, which regulate ABA content, were increased under WS conditions, which regulated the distribution of carbohydrates in sources to spikes. The WS treatment enhanced the expression level of amylase genes in sources, and genes involved in starch synthesis were upregulated in spikes. Therefore, the genes involved in ABA, starch and sucrose metabolism cooperate to promote the remobilization of carbon reserves in sources and spikes in response to WS.
Supplementary material
To view supplementary material for this article, please visit: https://doi.org/10.1017/S0960258522000058.
Acknowledgements
This work was supported by the Project funded by the China Postdoctoral Science Foundation (2020M673536) and the Gansu Provincial Science and Technology Major Projects (19ZD2NA002).
Conflicts of interest
The authors declare that they have no known competing financial interests or personal relationships that could have appeared to influence the work reported in this paper.
Data availability
The datasets generated during the current study are publicly available in the Sequence Read Archive (SRA) at the NCBI (SRR14695587-SRR14695604) repository. The C. songorica whole-genome sequence was submitted to the National Genomics Data Center (NGDC), accession number: GWHANUQ00000000.