


1. INTRODUCTION
In December 1940, the Portuguese government approved a national plan for the construction of primary schools called the Centenários plan (Plano dos Centenários in Portuguese). The original plan aimed at building 6,082 schools across the mainland—corresponding to 9,314 classrooms—over a 10-year period. The endeavour would mean approximately one new school for every 90 children aged 7-10 years and a 60 per cent increase in the number of primary schools, providing a remarkable example of schooling expansion. The plan was updated in 1955 and 1961, extending the construction of new primary schools until the late 1960s.
The objective of this paper is threefold. First, we describe the state of literacy in Portugal at the time of the beginning of the Centenários plan at the county level. Second, we estimate the factors behind the geographic distribution of primary schools in the plan. Third, we use geographical variation in the number of schools built (and planned) to estimate the causal effects of the increase in the supply of primary schools between 1940 and 1962. We first show this increase can be well instrumented by the number of planned schools, and then use an IV regression to estimate its effects on the enrolment of children and on the literacy rate of the cohort affected by the plan.
Prior to the Centenários plan, Portugal had a poorly educated population: In 1940, only 40 per cent of the population knew how to read (see Figure 1A); the average years of schooling for people aged 25-64 was only 1.6, compared to close to 4 years in Spain, Italy, or France (see Figure 1B).

FIGURE 1 Evolution of education indicators in Portugal
In this context, the government assumed an educational policy of mass literacy, using a single and simplified educational program that sought the acquisition of a «minimal» level of knowledge (Magalhães Reference Magalhães2010). This new policy began with the creation of the Ministry of National Education in 1936 and the educational reform of 1938 (see Palma and Reis Reference Palma and Reis2018, for a description of the more immediate measures), and it was followed by a centralised plan for the construction of school infrastructures throughout the country—the Centenários plan. The initial guidelines of the plan were approved in December 1940 and the original layout of schools in July 1941. In the five decades after the plan, Portugal's literacy rate grew by 50 percentage points and the average years of schooling jumped to seven.
For a perspective on the scale of the Centenários plan, we can compare it with other school expansions. For example, the Rosenwald schools initiative in the southern United States in the first third of the XX century increased the number of existing schools by almost 5,000 in 16 years (Aaronson and Mazumder Reference Aaronson and Mazumder2011). Other examples, described in Aghion et al. (Reference Aghion, Jaravel, Persson and Rouzet2019) for the last quarter of the XIX century, include France where 17,320 new schools were built and Japan where 12,500 primary schools were established in the space of 1 year. More recently, there is a school construction plan in Indonesia in the 1970s, which aimed to build 61,000 primary schools (Duflo Reference Duflo2001). The Centenários plan can be directly compared to the latter example. In Portugal, more than four schools were planned per 1,000 children aged 5-14, compared to two schools per 1,000 children of the same age group in the Indonesian case.
Regarding the execution of the plan, we do not have information about which and when schools were built. Some evidence shows the government was slow to implement the plan, and only a small fraction of it was carried out before 1950 (Beja et al. Reference Beja, Serra, Machás and Saldanha1996), most likely due to the plan's requirement of matching funds from local authorities to build the schools.Footnote 1 However, in 1962, mainland Portugal had 7,417 more operating schools than it had in 1940—equivalent to 120 per cent of the number of schools projected in the plan. Some of this increase was due to an increase in private schools, mainly in Lisbon and Porto.Footnote 2
We use three main sources to construct our county level dataset. The first source is the Education Statistics Yearbook for 1940-41 and 1962-63 (from the Portuguese Estatísticas da Educação, Ano Lectivo 1940-41 and Ano Lectivo 1962-63), which we use to characterise the schooling situation at the beginning of the period under review and the change in enrolment rates between school years 1940-41 and 1962-63. The second source is the Portuguese Census for 1940 and 1960, from which we draw demographic and literacy data for 1940, and literacy outcomes for different cohorts in 1960. The third source has information about schools and classrooms planned by the Centenários plan in 1941; it is drawn directly from the document Mapa Definitivo das Obras De Escolas Primárias (1943), which consists of the list of parishes affected and the number of schools and classrooms set to be built in each. More details about the construction of the dataset and the institutional setting are given in section 2.
Section 3 describes the state of schooling in Portugal in 1940. At that time, the country had a deficit of primary schools, with only one primary educational establishment per 700 inhabitants. The literacy rate of the population aged 7-19 varied between 22 and 79 per cent across counties.Footnote 3 We show these differences were mainly related to the number of schools per resident, the quality of education measured by attendance and exam pass rates and the population density, as well as other demographic factors.
Section 4 analyses the Centenários plan. We conclude that the plan envisaged the construction of more schools in counties with lower literacy rates. At the county level, a 10-percentage-point difference in the percentage of the population aged 7-19 who knew how to read translated into 0.2 fewer schools planned per 1,000 residents. Given the close to 60-percentage-point difference in this group's literacy rates between the least and the most literate counties at the time, our estimate implies a difference of 1.2 schools planned per 1,000 residents between these counties.
In section 5, we analyse the effects of the plan on student enrolment and the literacy rate of the affected cohort in the early 1960s. We start by showing the number of planned schools by county is a strong predictor of the subsequent variation in the number of schools from 1940 to 1962, even after controlling for several county characteristics in 1940. Therefore, the Centenários plan can be used to empirically identify the causal effects of school construction on education, similar to Duflo (Reference Duflo2001, Reference Duflo2004), Breierova and Duflo (Reference Breierova and Duflo2004), Martinez-Bravo (Reference Martinez-Bravo2017) or Somanathan (Reference Somanathan2008), using the Indonesia case. More precisely, we estimate the causal effect of the change in the number of schools per resident, instrumented by the number of schools planned per resident, in the change in student enrolment from 1940 to 1962 and the literacy rate of the relevant cohorts in 1960, respectively. We find that an additional school per 1,000 residents increased enrolment by 20 students per 1,000 residents older than 7 and increased 5 percentage points the literacy rate of the population aged 7 to 39 in 1960, relative to that of the population older than 40 in 1960.
Our paper contributes to a multidisciplinary literature studying Portuguese education during the 20th century, including Beja et al. (Reference Beja, Serra, Machás and Saldanha1996), de Carvalho (Reference de Carvalho1986), Nóvoa (Reference Nóvoa and Rosas1992) or Mónica (Reference Mónica1978) and Ramos (Reference Ramos1988) in history; Mendonça (Reference Mendonça2009) in sociology; Cordeiro et al. (Reference Cordeiro, Santos and Caridade2013) or Santos et al. (Reference Santos, Cordeiro and Alcoforado2013) in geography; Candeias (Reference Candeias1998), Candeias et al. (Reference Candeias, Paz and Rocha2004), Magalhães (Reference Magalhães2010, Reference Magalhães2018) and Martins (Reference Martins2009) in educational sciences or Amaral (Reference Amaral2002), Reis (Reference Reis1993) and Palma and Reis (Reference Palma and Reis2018) in economics. The latter paper is particularly relevant to our analysis, although it refers to a period that just precedes ours. Using the sample of military records of 20-year-old individuals in 1924, 1931, 1941 and 1950, its authors compare individuals' literacy rates between the republic and the dictatorship prior to the Centenários plan. They argue the increase in literacy can be attributed to the education reform early in the dictatorship that included a more simplified national program imprinted with a Catholic identity and gender separation in schools.Footnote 4 Their results support the belief among historians (e.g. Ramos Reference Ramos1988; Reis Reference Reis1993) that the increase in the literacy prior to the Centenários plan was mostly due to demand-side factors just as others have alluded to in other contexts (e.g. Cinnirella and Hornung Reference Cinnirella and Hornung2016). Amaral (Reference Amaral2002) hints at the joint role of supply and demand factors in the increase in enrolment during Estado Novo. His empirical analysis with macro data on the number of students supports the view that supply factors preceded demand factors. Our paper complements these authors' analysis by showing the causal impact of the increase in the supply of schools in explaining the subsequent increase in enrolment and literacy.
The nation-building literature describes several historical examples where public funds were used to strengthen the support for incumbent governments. Cinnirella and Schueler (Reference Cinnirella and Schueler2018), for example, show how an increase in the share of centralised funding of schools, particularly the one used to pay for teachers' wages, increased the share of votes in nationalist parties in Prussia at the turn of the 20th century. Aghion et al. (Reference Aghion, Jaravel, Persson and Rouzet2019) show, and illustrate with several historical examples (France, Japan and China), how military threats have encouraged investment in education since the 19th century. In another example, Bandiera et al. (Reference Bandiera, Mohnen, Rasul and Viarengo2019) describe how mandatory education was used in the US to transmit and reinforce the national identity to migrant children. Moreover, the received literature maintains that authoritarian regimes are more prone to use education policy with the purpose of indoctrination or to strengthen the support for the regime (see, e.g. Ramirez and Boli Reference Ramirez and Boli1987; Lott Reference Lott1999; Alesina and Bryony Reference Alesina and Bryony2019, and the references therein). In the Portuguese context, Mónica (Reference Mónica1977) describes how the dominant conservative elite realised the convenience of disciplining the masses through education—which proved crucial in the transmission of patriotic values to the young generations—thus abandoning the belief that education was useless and unwanted by the people. The regime's identity building was further reinforced, particularly during the first years, with the help of state-sponsored propaganda (e.g. Corkill and Pina Reference Corkill and Pina Almeida2009; Ribeiro Reference Ribeiro2005). The embarrassment associated with an international image of backwardness portrayed by the staggering number of illiterates may have also played a role in the inception of the Centenários plan. As some claim, the literacy results from the 1940 census were purposely put on hold not to darken the image of the country the regime wished to transmit during the international exposition of 1940 (as cited in Candeias et al. Reference Candeias, Paz and Rocha2004, p. 162).
Our paper, however, cannot provide an answer to whether the Centenários plan was part of a long-term strategy to ensure the continuation of Salazar's regime, or whether its purpose was simply to replicate the mass education policies that had proved successful in other countries during the 19th and early 20th centuries (e.g. Aghion et al. Reference Aghion, Jaravel, Persson and Rouzet2019). Instead, we focus on the actual effects of the plan on school enrolment and literacy rates. As such, this paper is also related to a literature on the supply determinants of human-capital accumulation to which many of the previously cited papers belong.
2. CONSTRUCTION OF THE DATABASE AND INSTITUTIONAL SETTING
We build a database for mainland Portugal with data aggregated at the county level.Footnote 5 Mainland Portugal has 18 districts, 272 counties and 3,791 parishes (the equivalent to Distrito, Concelho and Freguesia in Portuguese). Table 1 lists the sources of the datasets we used, the variables of interest and the year to which they refer. Table 2 gives the basic statistics of the main variables, used in the regressions. Figure 2 maps the Portuguese districts for the unfamiliar reader.
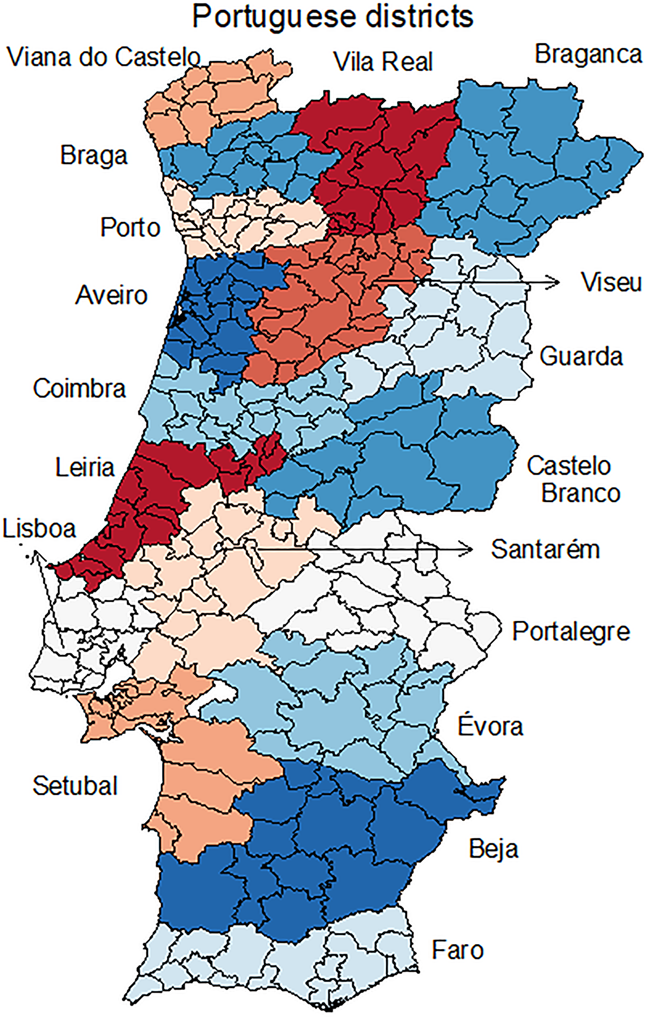
FIGURE 2 Portuguese districts and county borders
TABLE 1 DATASETS AND VARIABLES

TABLE 2 VARIABLES CONSTRUCTED AND SUMMARY STATISTICS

The first dataset was extracted from the Education Statistics Yearbook for 1940-1941, which gives a snapshot of the formal education system. In 1940-1941, mainland Portugal had 9,661 primary schools, 12,726 teachers and regents and 506,086 students. Out of the 9,661 primary schools, 7,264 were regular schools and 2,397 were school outposts («postos escolares»). School outposts were created in 1931 as an «additional instrument to deal with the so called problem of illiteracy» (Decreto Lei 20604). Primary education was provided by teachers in schools and by regents («regentes») in school outposts. The academic requirements needed to be a regent were less demanding than those required to be a primary teacher; therefore, academics view teaching at school outposts to be of lower quality (Magalhães Reference Magalhães2010, Reference Magalhães2018). These numbers include both public and private schools. Private schools were scarce in primary education in 1940: The number of private schools with any primary teaching, 474, represented less than 5 per cent of the total number of schools and schools outposts in the country, and their students represented only 9.3 per cent of the total number of primary students (according to Estatisticas da Educação, Ano lectivo 1940-41). Private schools were mostly concentrated in Lisbon—with 30 per cent of the primary students in private education—Évora (11.5 per cent), Porto (8.6 per cent), Setúbal (8.4 per cent) and Coimbra (8.2 per cent). To ensure the results are not influenced by the presence of private schools, in our regressions, we include specifications with a dummy for the capital of the district, where most private schools were located, and one specification excluding the cities of Lisbon and Porto.
In 1930, the 4 years of primary education were divided into two groups: the first 3 years of school (mandatory) and a fourth year that was optional (Decreto Lei 18140). By the end of the third and fourth grades, students took an exam and upon passing were granted a certificate.
Concurrently with the Centenários plan, the government created special tertiary schools to qualify teachers who were needed for the school expansion. As described in the introduction to the 1952 Law (Decreto Lei 38968), 14 such schools were either created or reopened between 1942 and 1948 throughout the country, mainly in district capitals: Lisboa, Porto, Coimbra, Braga, Viseu, Évora, Faro, Guarda, Bragança and Vila Real (as well as in the islands: Funchal, Ponta Delgada, Horta, and Angra do Heroísmo).
Our second dataset is taken from the 1940 census. The statistics are contained in books—one for each Portuguese district—that have been digitised by the Portuguese National Institute of Statistics. The books include data on the total population in each Portuguese county by gender, civil status and religion. They also include other information such as surface area, a detailed age decomposition of the population and, for different age groups, a self-reported account on primary school attendance and completion and whether they knew how to read. Aggregate literacy rates, as calculated by the official statistics, include everyone who knows how to read, divided by total population, including children younger than 7 that have not yet attended school. As such, we prefer to have two alternative measures of literacy for a young cohort aged 7-19 and an older cohort aged 20 or older.
We draw information on schools and classrooms planned in 1941 directly from the document Mapa Definitivo das Obras De Escolas Primárias, 1943, which consists of the listing of the parishes affected by the plan and the corresponding number of schools and classrooms to be built.Footnote 6 The document also includes the principles that guided the plan: (i) children should not have to travel more than 3 km to attend school; (ii) boys and girls should attend separate schools (exceptions allowed in areas of very low population density); (iii) class size should be limited to 40 students; (iv) schools should have a maximum of four classrooms and (v) the national government would finance up to 50 per cent of the construction costs, and local administration should cover the remaining costs. The plan included all 18 districts, 269 counties and 2,831 parishes in mainland Portugal. Only three counties—Constância and the cities of Lisbon and Porto—and 960 (of the 3791) parishes were unaffected by the plan.
Although the natural end point of our analysis would be just prior to the end of the dictatorship, that is, the early 1970s, we chose to measure the effects of the plan by the early 1960s for several reasons. First, the 1970 census contains only preliminary results for a subset of the population, and no comprehensive questions of literacy by county. Second, using the 1960s seemed to us more appropriate considering that the major jump in literacy among children had occurred by 1960 as reported by Candeias et al. (Reference Candeias, Paz and Rocha2004). Third, to avoid confounding effects from large population movements (due to the colonial war and emigration), as well as the increase to 6 years of mandatory education, approved in 1964 (Decreto Lei, 45810, July 1964), that could have diverted funds from primary education as well as teachers from some schools.
The information on the number of schools and school outposts, as well as student enrolment by county in 1962-63 is taken from the Education Statistics Yearbook for 1962-63. Finally, we use the 1960 census for the literacy rates of different cohorts. Our definition of the literacy rate is taken from the available information in the census. In 1940 and 1950, the census asked about the «ability to read». As Candeias et al. (Reference Candeias, Paz and Rocha2004) point out, many of those who were able to read (and write) had never received a formal education. In 1960, the census question changed such that all those who did not attend school were assumed to be illiterate. Therefore, the literacy rates in 1960 are biased downwards, compared to the 1940 census.Footnote 7
3. LITERACY IN PORTUGAL IN 1940
The literacy numbers for Portugal in 1940 are staggering. Candeias et al. (Reference Candeias, Paz and Rocha2004) argue that Portugal at the time was one century behind other European countries in terms of literacy rates. Earlier education policy had limited effects on literacy rates, which led historians to point out as the main causes, not so much the lack of schools, but the high opportunity costs of education and the absence of clear benefits of learning how to read or write, particularly among the rural poor (e.g. Mónica Reference Mónica1977; Ramos Reference Ramos1988; Reis Reference Reis1993). Without detailed individual data, we cannot quantify which of these factors are more important. For this reason, in this section, we only aim to identify the main aggregate factors associated with cross-county differences in the literacy rate of the population aged 7-19 in 1940.
The literacy rate varied between 22 and 79 per cent across counties, and its geographical distribution, together with the literacy rates of the older cohort, can be seen in the maps of Figure 3. The literacy rates of the younger cohort are, on average, 14 percentage points higher than the literacy rates of the older cohort, which might reflect the effects of the education reform early in the dictatorship, discussed in Palma and Reis (Reference Palma and Reis2018).

FIGURE 3 LITERACY RATES, 1940.
We present results from a linear regression of the literacy rate of the population aged 7-19 by county, on a series of explanatory variables. These results, although not causal, identify the variables that are more associated with the literacy rate.
The main variable of interest is the total number of school establishments per 1,000 residents, which reflects the quantity aspect of the supply side. Ideally, we would distinguish between schools and school outposts, but this information is not available at the county level. The map on the left in Figure 4 shows the geographical distribution of the school establishments (i.e. schools and school outposts) per 1,000 residents. On average, we find 1.5 schools per 1,000 residents, with a large range across counties, from 0.18 to 2.8.

FIGURE 4 EXISTING AND PLANNED SCHOOLS, 1940-1941.
We then include a group of variables related to school attendance and achievement, proxies for the quality of school supply. The first of these variables is the ratio between the number of children aged 7-13 who attended primary school, according to census data, and those who were enrolled, according to Education Statistics, which gives a measure of effective attendance. Although this measure is an imperfect measure of real attendance, it has the advantage of being measured at similar time periods across the country—because both the enrolment period and the census surveys were common to all regions in the country. This variable may also reflect the capacity of the state to enforce compulsory schooling at different counties, and/or other variables, such as the prevalence of child labour or the (opportunity) cost of attending school. The second variable reflecting school quality is the number of students who passed the third-grade exam, relative to the total number of students.
The third and fourth groups of variables are composed of geographic and sociodemographic variables, respectively. We include dummy variables of district and district capitals, the surface area of the county (in logarithm) and the number of parishes in the county as geographical variables. These variables should account for differences across counties for which we do not have a direct control, for example, land inequality and political influence of regional governments (Go and Lindert Reference Go and Lindert2010). For sociodemographic variables, we use the resident population (in logarithm), the age structure as measured by the percentage of children aged 0-13 on the total population, the ratio of men to women, the percentage of people who were married and the percentage of residents who were not Catholic.
Table 3 shows the results of linear regressions for the literacy rate of the population aged 7-19. In column (1), we consider only the number of educational establishments per 1,000 residents. One additional school per 1,000 residents in the county is associated with a 4.2-percentage-point increase in the literacy rate of the population aged 7-19 years in 1940, that is, an 8.1 per cent increase in the literacy rate.
TABLE 3 DETERMINANTS OF LITERACY RATES OF POPULATION AGED 7-19, BY COUNTY
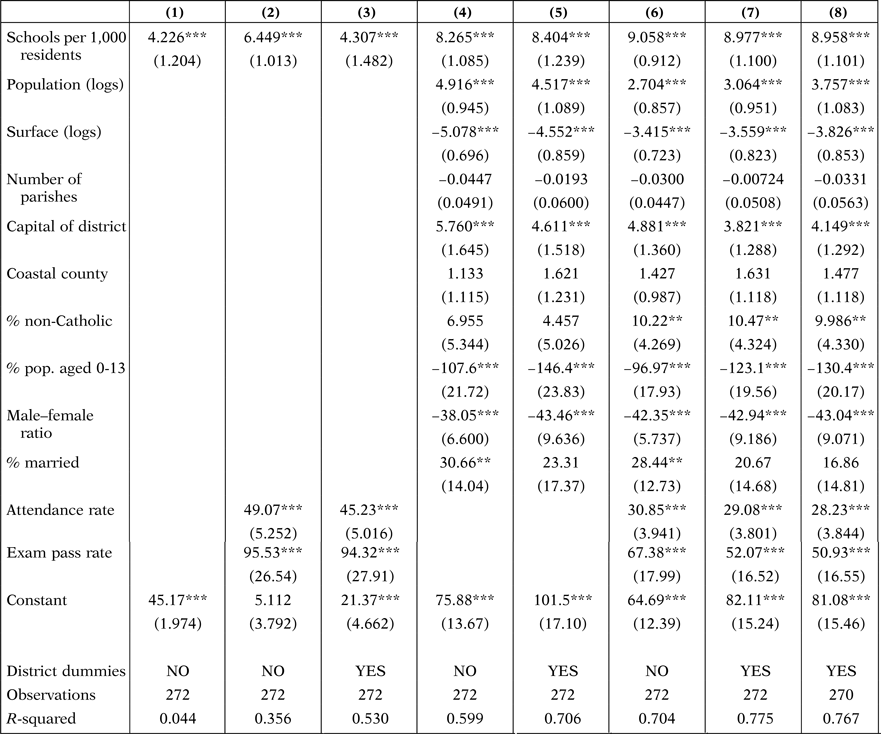
Note: Standard deviation in parentheses. The dependent variable is the literacy rate for the population aged 7-19, taken from the 1940 Census. See Table 2 for description of the construction of the variables. Column (8) excludes the cities of Lisbon and Porto. Statistical significance: ***P < 0.01, **P < 0.05, *P < 0.1. Robust standard errors used.
In columns (2) and (3), we added the measures of attendance and exam pass rates, without and with district dummies, which prove to be important in explaining the literacy rate. With the inclusion of these variables, the R-squared increases from 0.044 to 0.36 and 0.53, respectively. Higher attendance and pass rates are both statistically significantly related to higher literacy rates.
In columns (4) and (5), we include the geographic and demographic variables, and in columns (6) and (7), we include all the controls. Note the coefficients of the logarithm of the surface area and the logarithm of the population have opposite signs although they are virtually of the same magnitude, which means the ratio of the resident population per unit area, that is, the population density, is what matters for the literacy rate. A 1 per cent increase in the population density, either by a larger population or by a smaller area, is associated with increases of the literacy rate of around 0.03 to 0.05 percentage points. The capitals of districts had, on average, literacy rates that were 5 percentage points higher than the rates in other counties. Regarding demographic variables, counties with a higher share of children aged 0-13 or a higher male–female ratio had, on average, lower literacy rates.
In columns (3), (5) and (7), we include district dummies, which capture permanent differences between counties in different districts, and in column (8), we excluded the cities of Lisbon and Porto. When we include all variables, the model explains 78 per cent of the variation in the dependent variable, and the coefficient of schools per 1,000 residents doubles in size, corresponding to 8.9 percentage points or 17 per cent.
4. THE CENTENÁRIOS PLAN: DETERMINANTS OF SCHOOLS BY COUNTY
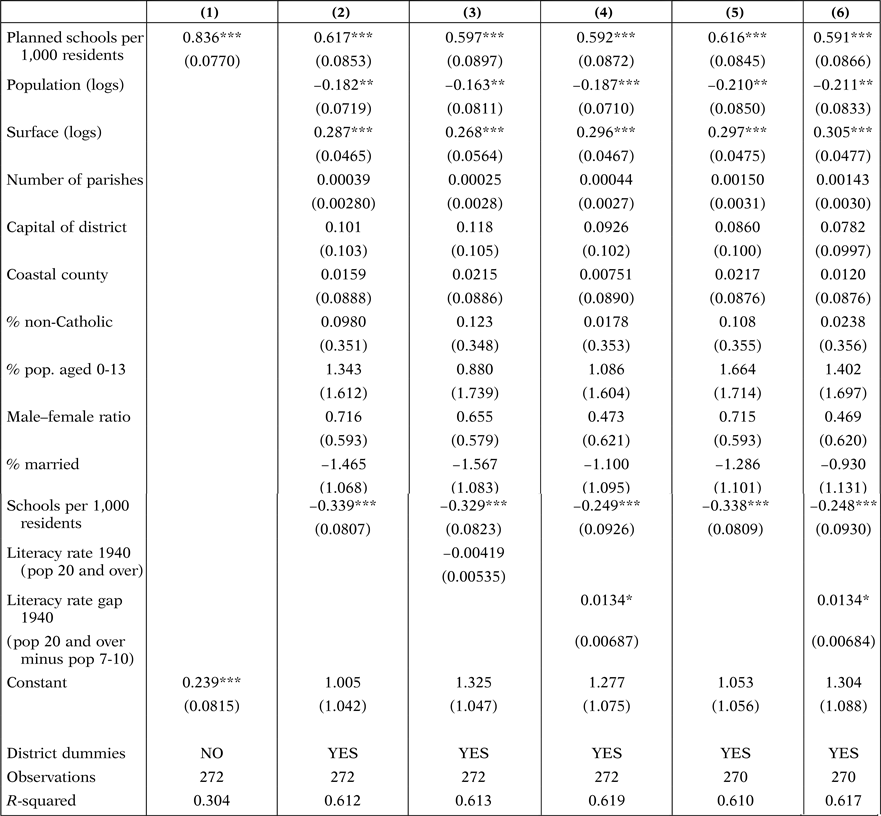
In this section, we estimate a linear regression of the number of schools planned per 1,000 residents at the county level over a series of explanatory variables. The map on the right in Figure 3 shows the distribution of schools planned per 1,000 residents in 1940 by county. On average, close to one school was planned for every 1,000 residents, varying from 0 to 2.3. Two large regions stand out with a high concentration of new schools per county, namely, the south spanning Setubal, Évora, Beja and Faro, and the central northern region of Vila Real and Viseu.
In addition to the variables used in section 3, we also include the literacy rate of the population aged 7-19 to assess whether the plan aimed to provide more schools in areas where the percentage of illiterates was higher. Table 4 shows the linear regression results for the number of schools planned per 1,000 residents. In column (1), we consider as explanatory variables only the literacy rate, and in (2), we add the number of existing schools. In column (3), we include the geographic and demographic controls, and in column (4), we add the attendance and exam pass rate. In columns (5), (6) and (7), we add different sets of variables together with district dummies. In column (8), we drop Lisbon and Porto to check the robustness.
TABLE 4 DETERMINANTS OF PLANNED SCHOOLS, PER COUNTY

Note: Standard deviation in parentheses. The dependent variable is the number of schools planned per 1,000 residents per county, according to the Plano dos Centenários. See Table 2 for description of the construction of the variables. Column (8) excludes the cities of Lisbon and Porto. Statistical significance: ***P < 0.01, **P < 0.05, *P < 0.1. Robust standard errors used.
The number of planned schools is negatively associated with the literacy rate of the population aged 7-19, and this association is not only statistically significantly, but also persists and even becomes stronger as we increase the number of controls.Footnote 8 A 10-percentage-point increase in the percentage of people aged 7-19 who knew how to read in the county reduces by roughly 0.2 the number of schools planned per 1,000 residents. Given the close to 60-percentage-point difference in literacy rates between the least and the most literate counties at the time, our estimate implies a difference of 1.2 schools planned per 1,000 residents between them. This difference is economically significant, representing 120 per cent of the average number of schools planned per 1,000 residents (see Table 2). Additionally, we find that, conditional on the literacy rate, the greater the number of existing schools per 1,000 residents in the county, the greater the number of schools planned. For each additional existing school per 1,000 residents, the plan projected an increase of 0.3 schools. These two effects are statistically significant in all specifications and explain 37 per cent of the variability of the planned schools.
The percentage of students enrolled who actually attended primary school (i.e. the «attendance rate») is associated with a larger number of schools planned. This variable likely reflects the pressure or congestion of existing schools. With regard to the sociodemographic variables, we find that fewer schools were planned in regions with a higher percentage of non-Catholics, traditionally the interior of the Alentejo region in south-central Portugal, and fewer schools were planned in counties with a larger proportion of married residents; both variables are likely indicators of wealth.
5. THE EFFECT OF THE NUMBER OF SCHOOLS ON SCHOOL ENROLMENT AND LITERACY
5.1 The School Landscape 20 Years After the Plan
We start by analysing whether the actual change in the number of schools at the county level between 1940 and 1962 can be predicted by the plan. The geographic distribution of the variation in schools between 1940 and 1962 is shown in the right-hand side map in Figure 5. In 1962, mainland Portugal had 7,417 more operating schools than it had in 1940—120 per cent of the number of schools projected in the plan. The average variation of schools per county was 1.06, compared to the 0.98 predicted by the plan.
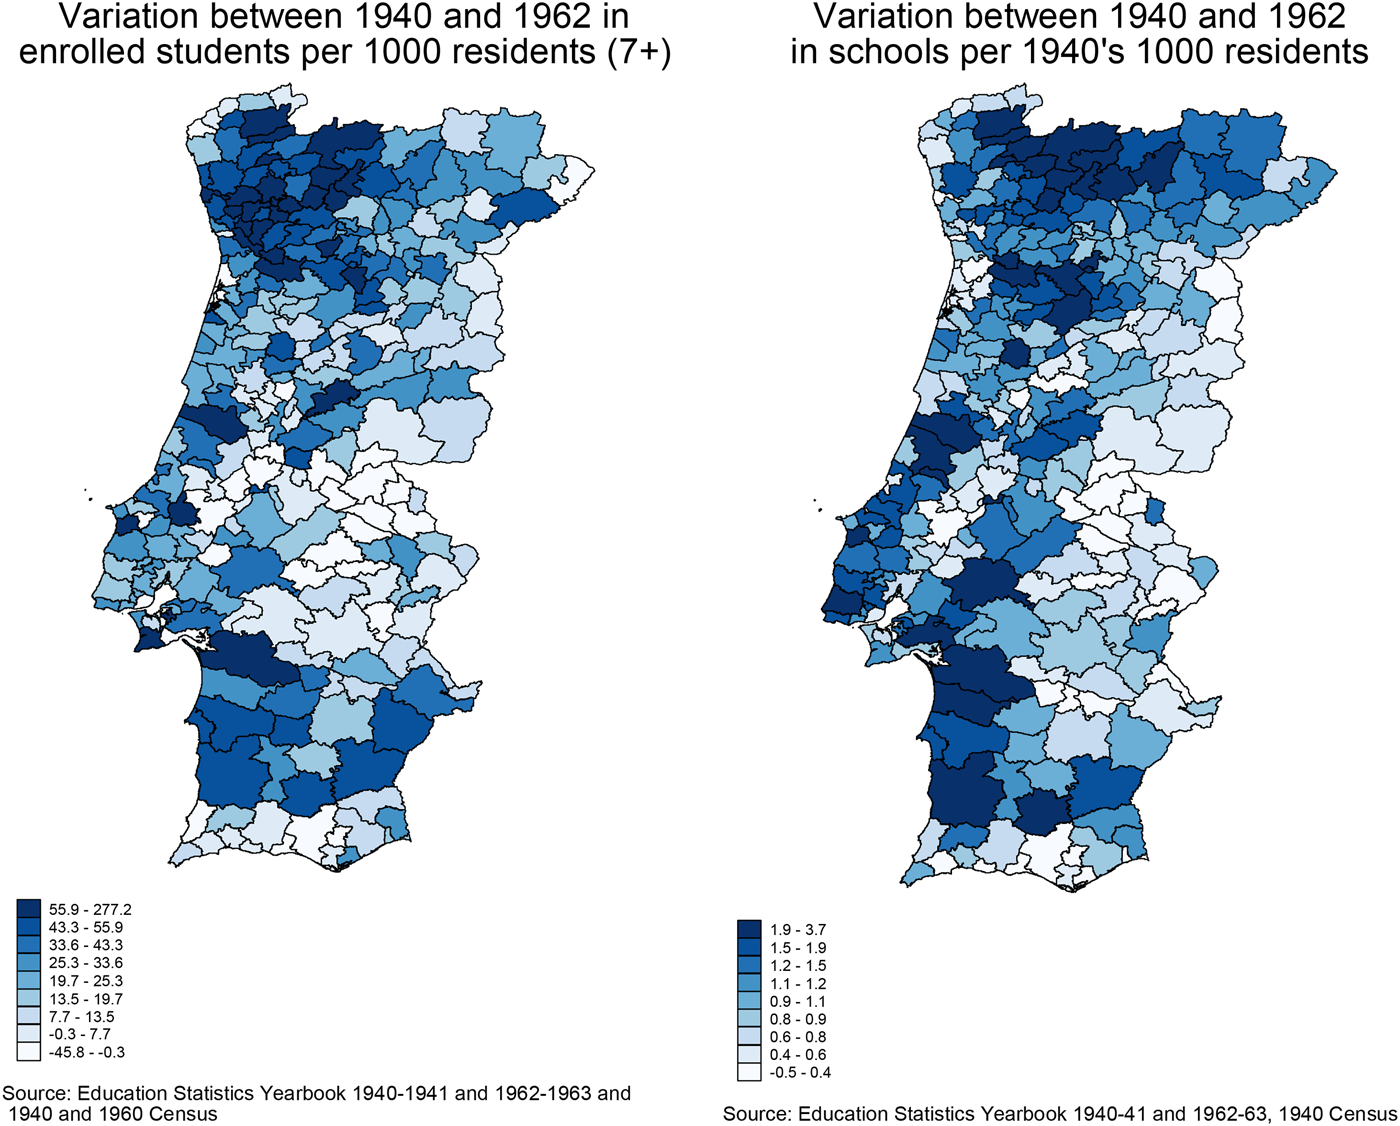
FIGURE 5 VARIATION OF SCHOOLS AND ENROLMENT BETWEEN 1940 AND 1962.
We run a linear regression where the dependent variable is the variation in the number of schools between 1940 and 1962 per 1,000 residents in 1940, against the number of planned schools, also normalised by 1,000 residents in 1940 (see column (1) of Table 5). This regression is shown graphically in the scatter plot in Figure 6. We find that one additional planned school predicts an increase of 0.8 schools. This variable alone explains 30 per cent of the cross-county variation in our dependent variable. The reason the coefficient is statistically different from 1 may be due to changes in the demographic characteristics that led to the updates to the plan in 1955 or to the inability to fulfil the plan.

FIGURE 6 PROJECTED AND ACTUAL INCREASE IN SCHOOLS.
TABLE 5 DETERMINANTS OF THE VARIATION IN THE NUMBER OF SCHOOLS BETWEEN 1940 AND 1962, BY COUNTY (FIRST STAGE)
Note: Standard deviation in parentheses. The dependent variable is the variation of schools between 1940 and 1962 divided by 1,000 1940 residents. All dependent variables are from 1940. See Table 2 for description of the construction of the variables. Columns (5) and (6) exclude the cities of Lisbon and Porto. Results represent first stage regressions of IV estimates presented in the next Section (Tables 8-10). Statistical significance: ***P < 0.01, **P < 0.05, *P < 0.1. Robust standard errors used.
The inclusion of other variables in the regression decreases the coefficient of the planned schools, but it remains statistically significant and relatively high at around 0.6. In subsequent columns, we add different controls, so that the regressions reflect the first stage of the IV regressions in the following subsection. Only a few other variables are statistically significant: the surface area of the county, which is positively associated with the increase in the number of schools; the population, which is negatively associated with the increase in the number of schools; and, perhaps more interesting, the existing number of schools per 1,000 residents, which has a negative coefficient of around −0.3. Notice that although the literacy rate in 1940 of the population aged 20 and above is not significant, we find a statistically positive effect of the literacy gap between this cohort and the younger cohort (aged 7-19).
The number of planned schools by county is strongly correlated with the number of schools built. Nonetheless, to be a good instrument for the latter, we need to make sure the number of planned schools is not correlated with underlying characteristics that affect our dependent variables: enrolment and literacy. For example, if more schools were planned in counties where individuals would do better even without the school construction, our IV estimates could be biased upwards. In fact, we show the opposite is true; that is, more schools were planned where literacy was lowest, and thus we should not expect a positive bias. Moreover, notice that although the number of schools built is endogenous because it depended on the availability of matching local funds, this is not the case for the number of planned schools, which were exogenous to the availability of these funds.Footnote 9 In the regressions below, we include specifications where we control for existing literacy rates and the number of existing schools in order to control for variables that show some correlation with our instrument.
5.2 The Effect of More Schools on Enrolment and Literacy
We proceed to estimate the causal effect of the change in the supply of schools between 1940 and 1962 on two variables: the change in students enrolled in primary education divided by the population aged 7 or above, between 1940 and 1962, and the difference between literacy rates of the young and old cohorts in 1960. Figure 7 shows the literacy rates in 1960 of the population aged 7-39 and the population older than 40.Footnote 10 The average literacy rate of the younger cohort is 80 per cent (see Table 2), which is double the literacy rate of the older cohort. This difference between the literacy rates of the two cohorts varied from 15 to 53 percentage points across counties. Enrolment increased by 26 students per 1,000 residents older than 7, varying from −46 to 277.
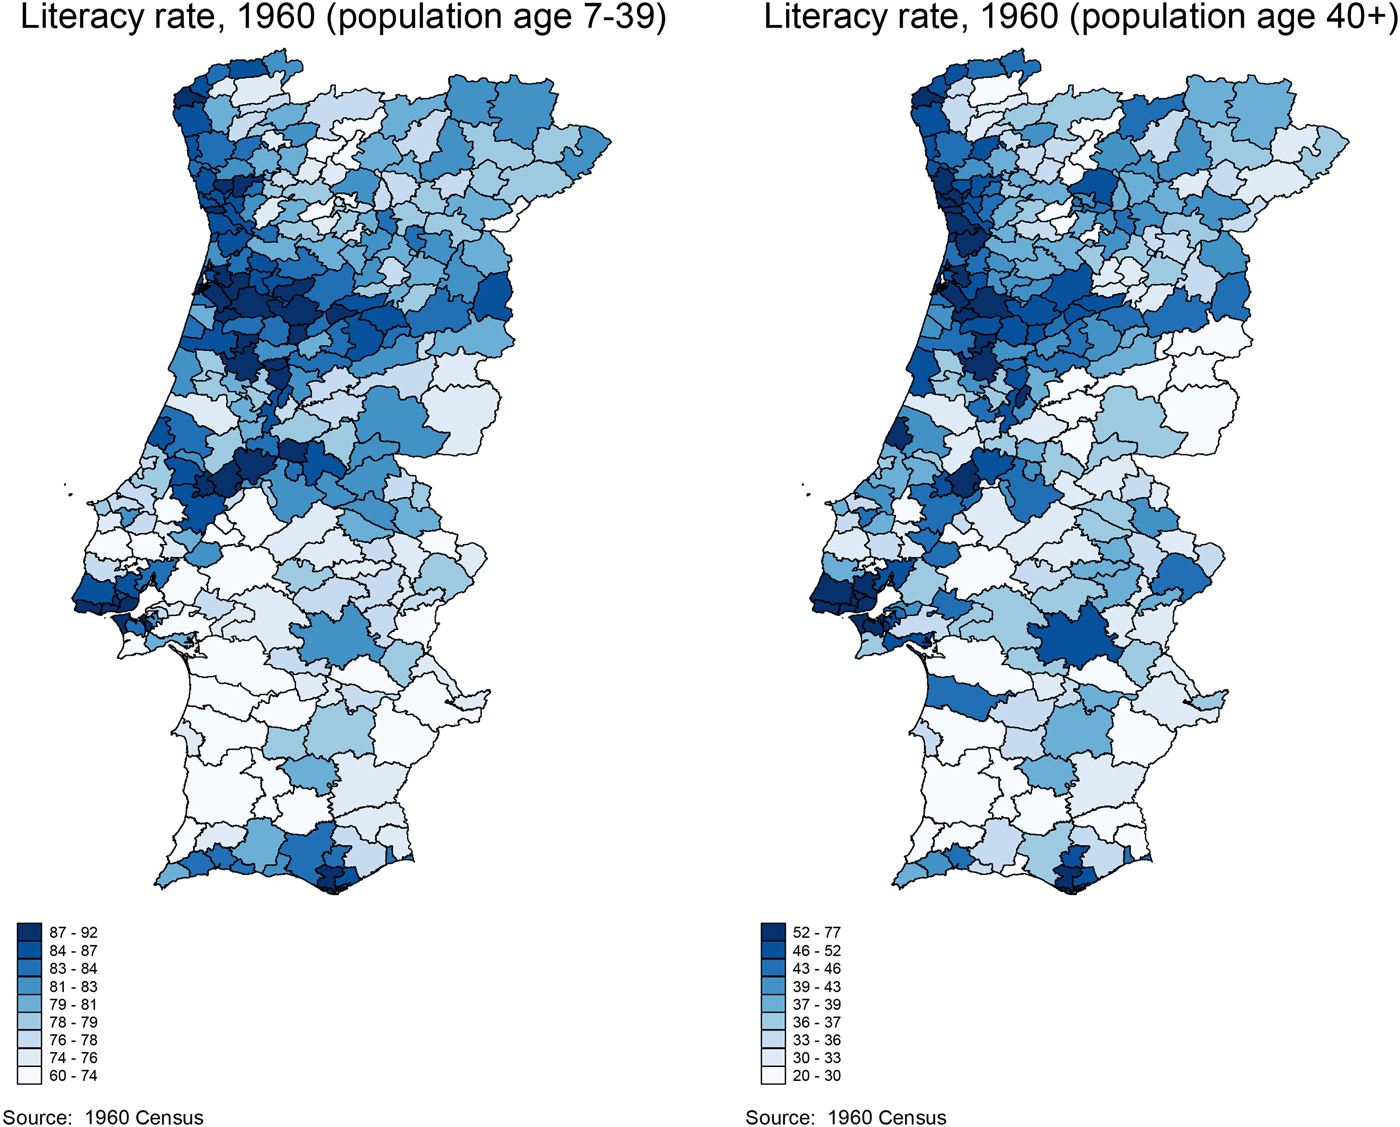
FIGURE 7 LITERACY RATES, 1960.
We point out some notes on these outcome variables. First, the variation in the number of students enrolled could have been influenced by legislation passed in 1952 (Decreto lei 39698) that recognised the inoperability and inefficacy of the existing measures aimed at fostering enrolment and school attendance. The new legislation not only increased sanctions to parents whose children did not attend school but, more importantly, modified the way they were put into practice. Together with the reinforcement of fines and penalties, the collection of social benefits such as family allowance was made conditional on the children's school attendance. Second, in 1960, the census definition regarding literacy changed relative to previous years such that all those who did not attend school were assumed to be illiterate. The new definition amplifies the differences in literacy across cohorts, because a higher share of the older cohort knew how to read but had not attended school. On the other hand, the 1952 legislation introduced strong incentives for the education of adults, which could have had the opposite effect that is the reduction of differences across cohorts.Footnote 11 Third, although the Centenários plan clearly did not affect the 40-and-older cohort in 1960, because those individuals were 20 or above when the plan was approved, it did affect some individuals of the younger cohort, namely, children aged 7-13 when the plan was approved. We loosely denote the younger cohort aged 7-39 in 1960 as the «affected cohort». Despite these limitations, we believe using information exclusively collected in 1960 is preferable in order to ensure the same definition of literacy is applied to both cohorts. A more precise interpretation of our second outcome variable is the change in the fraction of people who attended school.
Because the change in the number of schools between 1940 and 1962 by county is endogenous, we instrument it using the number of planned schools by county in 1940. The identifying assumption is that the number of planned schools in 1940 affects the change in literacy between cohorts in 1960 only through its effect on the real change in the number of schools, conditional on characteristics of the population and the county in 1940, as well as district fixed effects. Table 5 shows the first stage regressions, and Tables 6 and 7 show the results of the second stage, both IV and OLS. In all regressions, we reject the under identification and the weak instrument tests, which validate our approach (see tests at the bottom of columns 4-8).
TABLE 6 DETERMINANTS OF THE CHANGE IN GROSS ENROLMENT BETWEEN 1940 AND 1962, BY COUNTY

Note: Robust standard deviation in parentheses. The dependent variable is the variation in the number of students enrolled in primary schools between school years 1940-41 and 1962-63 per 1000 residents aged 7 and above. «Variation of schools between 1940 and 1962 per 1,000 residents» is the endogenous variable of change in the number of schools per thousand of 1940 residents between school year 1962-63 and school year 1940-41, instrumented by the number of planned schools per 1000 residents in 1940. The remaining variables are from 1940 (Table 2). Columns (4) and (8) exclude the cities of Lisbon and Porto. Statistical significance: ***P < 0.01, **P < 0.05, *P < 0.1. Robust standard errors used. Montiel–Pflueger critical values for τ = 10% and α = 5%.
TABLE 7 DETERMINANTS OF THE VARIATION IN LITERACY BETWEEN 7-39 AND 40+ COHORTS IN 1962, BY COUNTY

Note: Robust standard deviation in parentheses. The dependent variable is the difference in the literacy rate of cohorts aged 7-39 in 1960 and cohorts aged 40+ in 1960. «Variation of schools between 1940 and 1962 per 1,000 residents» is the endogenous variable of change in the number of schools per thousand of 1940 residents between school year 1962-63 and school year 1940-41, instrumented by the number of planned schools per 1000 residents in 1940. The remaining variables are from 1940 (Table 2). Columns (4) and (8) exclude the cities of Lisbon and Porto. Statistical significance: ***P < 0.01, **P < 0.05, *P < 0.1. Robust standard errors used. Montiel–Pflueger critical values for τ = 10% and α = 5%.
The effect of the change in the number of schools per resident on the change in student enrolment is always positive and statistically significant both for OLS and IV regressions. The OLS results are systematically smaller than the IV. Our IV estimates imply one additional school per 1,000 residents—the average increase was 1.06—increases enrolment by around 20 students per 1,000 residents older than 7 (see column (5) results in Table 6), which corresponds to close to 80 per cent of the average increase in enrolment.
The effect of the change in the number of schools per resident on the variation of literacy rates between cohorts is positive and statistically significant both for OLS and IV regressions. Because more schools were built in less favoured counties, the OLS results are systematically smaller than the IV. Our estimates imply one additional school per 1,000 residents increases the difference in the literacy rate by around 4.3 percentage points, which corresponds to 10.7 per cent of the average difference in the literacy rates.
To further address endogeneity concerns about our instrument, we control for the difference in literacy rates of the same cohorts in 1940. Results are even larger, around 5.3 percentage points, that is, around 13 per cent of the average difference. Results show that the difference in literacy rates across cohorts is larger in smaller counties, counties with a larger proportion of children and married people, and with a larger fraction of Catholics. The latter result, statistically significant in all but the last two specifications, is consistent with the theory which attributes a role to the curriculum's catholic imprint in persuading parents to send their children to school (Palma and Reis Reference Palma and Reis2018).
6. CONCLUSION
In 1940, the Portuguese population was mostly illiterate, due in part to a scarce and unequal network of primary schools. With this background, the government launched the Centenários plan, with the objective of increasing the number of primary schools in the country by 60 per cent over a 10-year period.
We collect data from three main sources to characterise the state of formal education in Portugal at the time of the beginning of the Centenários plan, the strategy the plan followed regarding the distribution of new schools, and, finally, the effects of the increase in the number of schools 20 years after the plan. The quality and detail of the data used allow a rigorous statistical analysis at the county levels.
From our analysis, we conclude that the variation in literacy rates among counties in 1940 was mainly related to the number of schools, the quality of education, measured both by the percentage of enrolled students attending class and by the passing rate in the third-grade exam and the population density, as well as other demographic factors.
As for the strategy followed by the Centenários plan, we conclude the construction of schools privileged counties with low literacy rates. For example, a 10-percentage-point difference in the number of children aged 7-19 years who knew how to read translated into a difference of approximately 0.2 schools per 1,000 residents, that is, close to 20 per cent of the average number of schools planned per county.
The variation in the number of schools 20 years after the approval of the Centenários plan is highly positively correlated with the initial number of schools planned, conditional on other county characteristics.
This strong correlation allows us to use the Centenários plan as a policy experiment to help identify the effects of schooling. Hence, in the last part of the paper, we estimate the causal impact of the variation in the supply of schools per resident and conclude it was responsible for 80 per cent of the increase in enrolment and 13 per cent of the increase in the literacy rate of the affected cohorts at the beginning of the 60s.
Our results contribute to the debate regarding the causes of the slow growth in Portuguese literacy. We establish that supply-side factors, in particular, the massive school construction during part of the Estado Novo, proved relevant for the increase in literacy during the 1950s and early 1960s.
The analysis carried out in this paper is the start of a more ambitious project in which we will study the long-term effects of the expansion of access to primary education on the Portuguese society.
ACKNOWLEDGEMENTS
We thank Nuno Palma and Jaime Reis for comments on a previous version of the paper, Agustin Casas, Julio Cáceres, Luigi Minale and Jaime Millán, as well as three anonymous referees. We would also like to extend our thanks to Françoise Le Cunff, from the archive of the Ministry of Education, for supporting us in the collection of some of the data.
SOURCES AND OFFICIAL PUBLICATIONS
Diário do Governo I Série (1930), Número 72, 20 Março: Decreto Lei 18141.
Diário do Governo I Série (1931). Número 283, 9 de Dezembro: Decreto Lei 20604.
Estatísticas da Educação, Ano Lectivo 1940-1941. Instituto Nacional de Estatística, Portugal. Lisboa: Bertrand (irmãos).
Mapa Definitivo das Obras de Escolas Primárias: Plano dos Centenários (1943), Imprensa Nacional, 1943, Arquivo Ministério da Educação.
Diário do Governo I Série (1952). Número 241, 27, Outubro: Decreto Lei 38968.
Programa de Construções Escolares do Ano de 1955. Arquivo Ministério da Educação.
Plano de Construções para o ensino primário (actualização do Plano dos Centenários), Lei 2107 de 5 de abril de 1961. Diário do Governo I Série, N° 107, Decreto n° 43674.


