


1. INTRODUCTION
In the past 30 years, South America has emerged as the dominant world producer of soybeans, a crop of no significance in the region before the middle of the 20th century. Brazil has now emerged as the world's leading producer, having replaced the United States in the past several crop years (see Figure 1). As of the crop year 2020/2021, it is estimated that the South American region will produce 195 million tons of soybeans, or 51 per cent of world output of this important oilseed. Of this total, Brazil and Argentina will produce 184.5 million tons or 93 per cent of the South American production. These two nations also account for 55 per cent of all soybeans exported in international trade. Brazil alone has recently surpassed the United States in most years as both the world's largest producer of soybeans and it has also been its largest single exporter in the past half-decade (USDA, Uruguay Oilseeds, March 2019, p. 1; USDA, Bolivia Soybeans, June 2019, p. 1; USDA, Oilseeds, October 2019, Table 7; USDA, Oilseeds, March 2019, p. 1). How this new agricultural product evolved in the two principal South American regional producers is the fundamental issue explored in this essay. Here we examine the historical evolution of soybean production in Brazil and Argentina and show the unique patterns of production in each of these two nations and how the move to soybeans fit into their larger agricultural development in the recent period.
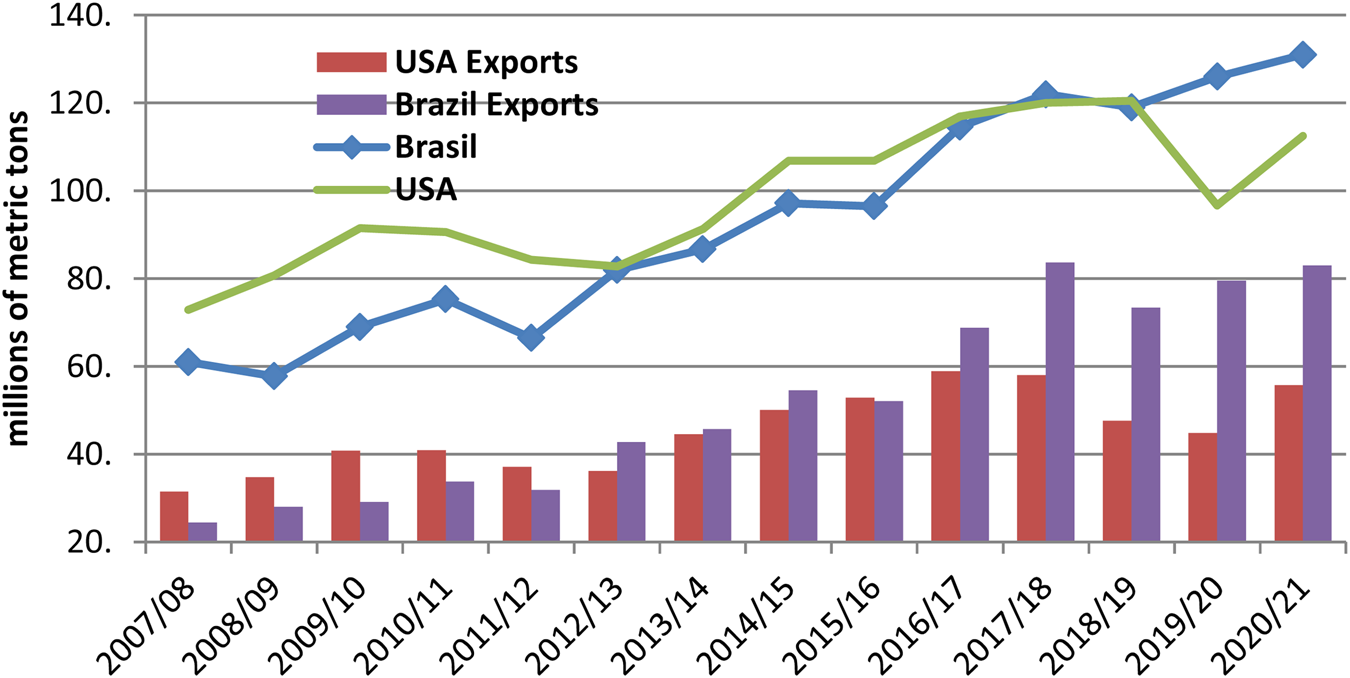
FIGURE 1 Soybean Production and Exports of Brazil and the USA, 2007/08 to 2020/21.
Source: USDA Oilseeds (July 2020), Tables 17–19.
2. LATIN AMERICA IN THE WORLD SOYBEAN MARKET
Soybeans represent one of humanity's oldest staples, being domesticated by the Chinese probably 5,000 years ago. Although it was a staple food for Asian civilisations, its large-scale cultivation in the West occurred only in the 20th century (Masuda and Goldsmith Reference Masuda and Goldsmith2009, pp. 143–162; Lee et al. Reference Lee, Gary W., Li, Yuka and Xuexiang2011). In this century, soybeans has emerged as the fourth largest grain or oilseed in the world, behind corn, wheat and rice (FAOSTAT). In the last 20 years, the countries of the southern cone of Latin America (Brazil, Argentina, Uruguay, Paraguay and Bolivia) have become one of the main soybean and oilseed supply centres in the international market. During this period, these five South American producers increased their share from 31 to 57 per cent of world production (see Table 1). This region would also dominate international exports of soybeans by an even larger ratio. Of the 149,000 soybeans exported to the international market in the crop year of 2019/20, Brazil, Argentina and Paraguay alone accounted for 61 per cent of the total (USDA, Oilseeds, December 2019, p. 14, Table 7).
TABLE 1 Total world production of soybeans and Southern Cone countries soybeans production 1996 and 2019 (1,000 tons).

Whereas the United States dominated production until the 21st century, the South American producers have emerged as the primary region of production. Brazil at the end of the 2010s equalled or surpassed the U.S. production in most years with Argentina in third place. The three other leading South American producers were Paraguay, Bolivia and Uruguay all being among the world's largest producers (see Table 2).
TABLE 2 Soybeans: world supply and distribution 2020/2021 (1,000 metric tons).
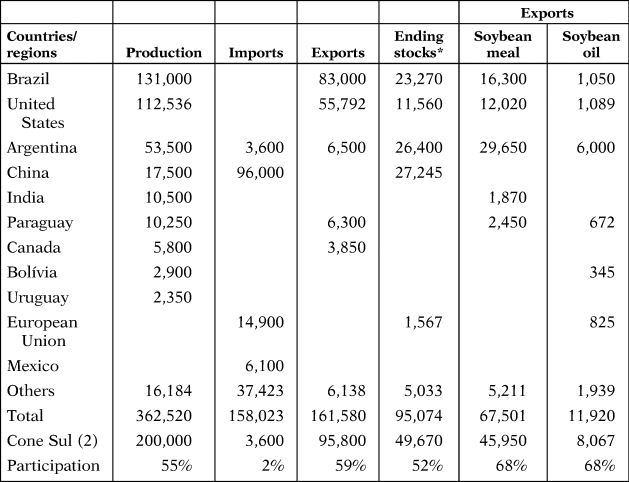
Source: USDA, Oilseeds: World Market and Trade, July 2020, Tables 7-9; and USDA, World Agriculture Production, May 2020, Table 11 for Bolivia & Uruguay.
Notes: *Stocks are unsold soybeans remaining after domestic consumption and exports.
The South American also exported over half of all soybean oil and soybean cake processed from the raw bean. Brazil, Argentina, Paraguay, Bolivia and Uruguay accounted almost two-thirds of soybean meal and of soybean oil sold into the international market (see Table 3).
TABLE 3 Soybean complex exports (cake, oils and grain)—1961–2018—in tons Cake, soybeans.
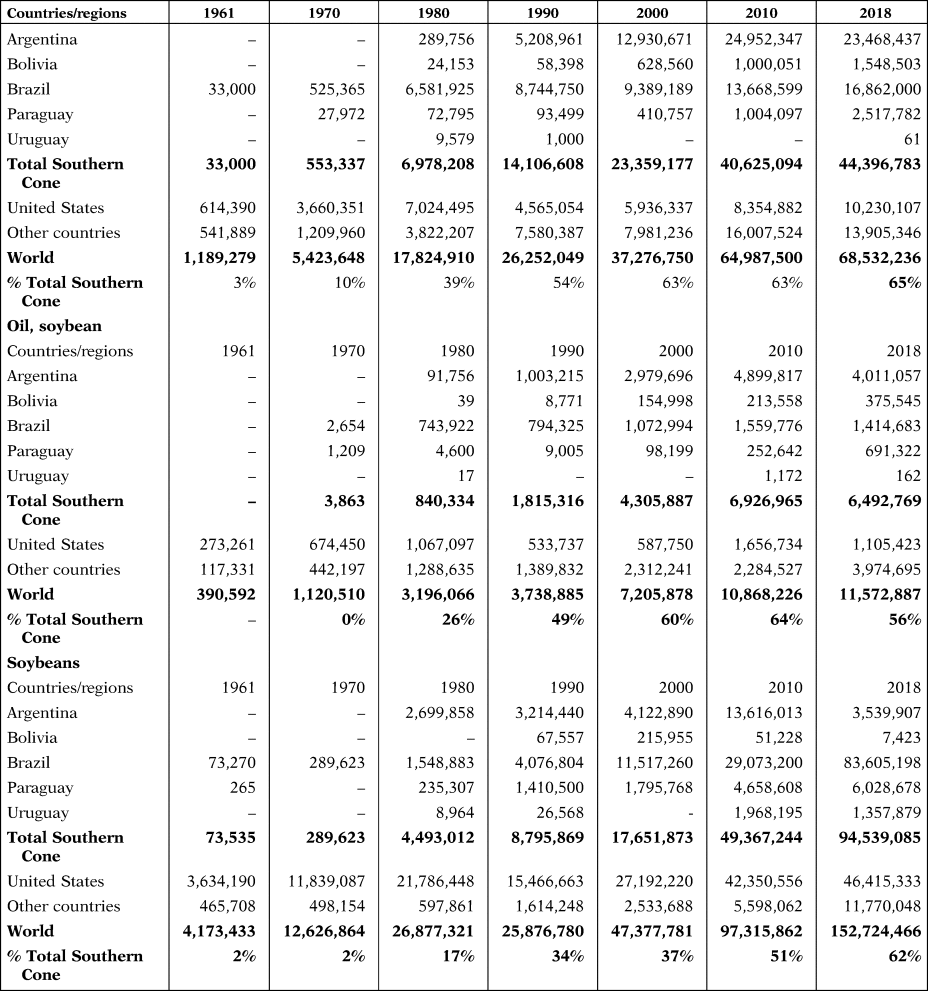
Source: FAOSTAT.
Note (1): Southern Cone: Argentina, Bolivia, Brazil, Paraguay and Uruguay.
Brazil's share of the processed soybean market is relatively small compared to the country's position in bean production and export. This difference is also due to Brazil's need of soybean meal for animal feed for its large national production of pigs and chickens. Thus Brazil consumes over half of its production, while Argentina consumes only a tenth of its output. In the case of soybean oil, Brazil in the crop year 2019/2020 was only the fourth largest producer, practically equal to the output of Argentina. But Brazil exported only 1 million tons, against 6 million tons of meal exported from Argentina (USDA, Oilseeds, July 2020, p. 12, Table 4). The difference can be explained by the high consumption of soybean oil in Brazil, which reached 7 million tons in this crop year. Oil consumption in Brazil is essentially based on soybean oil, which represents over 90 per cent of the national consumption of edible oils. In Argentina, the consumption of soybean oil is minimal, as it traditionally consumes nationally produced sunflower oil (see Table 4).
TABLE 4 Soybean oil: production, imports, exports and consumption (2019/2020) – thousands metric tones.

Source: USDA, Oilseeds: World Markets and Trade, December 2019, Tables 8 and 9.
Notes: *In this crop year, Paraguay is expected to export 2.5 million tons of meal and Bolivia 1.7 million tons of soy meal.
3. EVOLUTION OF SOYBEAN PRODUCTION IN SOUTH AMERICA—BRAZIL
In Brazil, soybeans were first grown in the South of the country at the beginning of the 20th century. It was produced on small farms and was intended for animal feed and also used as a rotation crop with wheat. With the expansion of wheat cultivation in this temperate area in the 1960s, there was intensification of soybean production. It was also stimulated by the rapid growth of poultry and pig farming in this region which in turn became a major zone for world chicken exports in the coming decadesFootnote 1. It was at this point that the investments in the research of the Brazilian national agricultural research centre Embrapa [Empresa Brasileira de Pesquisa Agropecuária] led to the «tropicalisation» of soybeans which would open up the Centre-West region to large-scale soybean farming. This was a new variety of soybean cultivar designed for tropical climates. For the first time in history, the beans could now be successfully planted in the low latitude regions between Capricorn and the equator. This achievement began to be noticed by the market by the 1990s (Embrapa Soja).
The evolution of soybean production in Brazil is part of the history of the modernisation of Brazilian agriculture in general in the past half century (Klein and Luna Reference Klein and Luna2019). Initially, soybeans proved to be an ideal product for wheat rotation (CONAB, Série Histórica das Safras, Trigo). But in 1987, government wheat support was eliminated, and the result led to declining wheat production. Soybean production, however, was not affected due to exceptional rise in prices for this product that occurred in the 1970s. The average price of soybeans in the 1970s was more than twice the average price from the previous decade and by the 2010s increased again (see Figure 2).
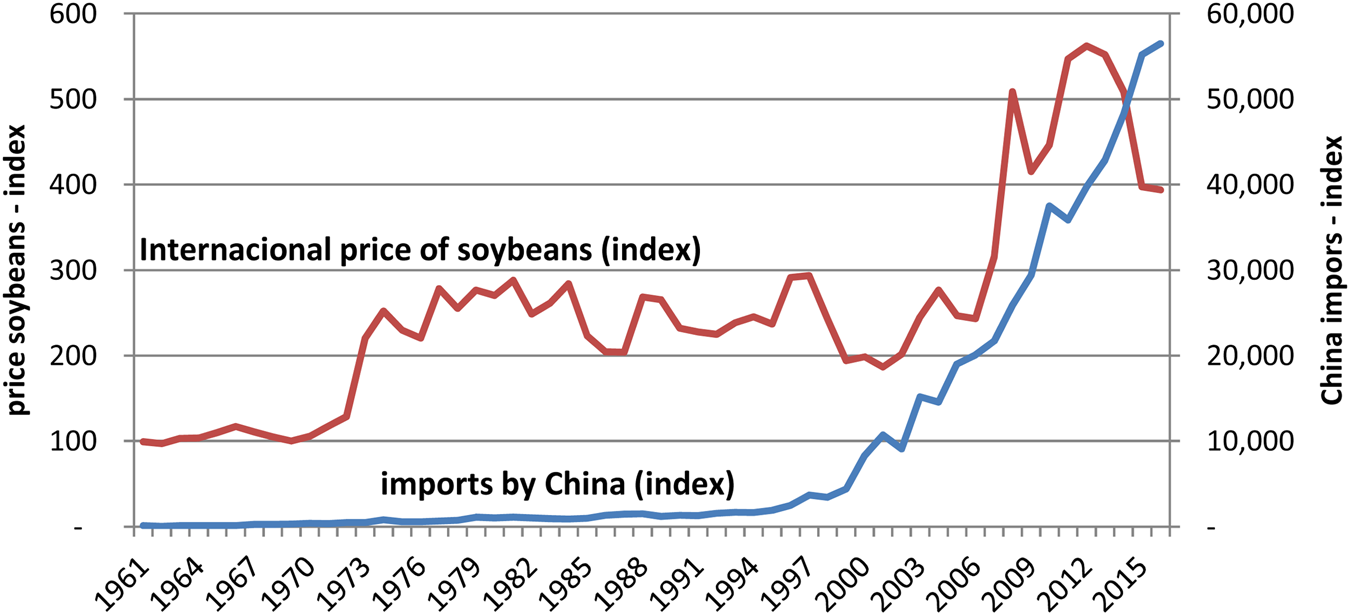
FIGURE 2 International Price of Soybeans and Imports by China (index 1961–63 = 100).
Source: FAOSTAT.
In this first phase of soybean expansion in the south of the country, cultivars developed in the United States were used. But the high price of land in the Southern states restricted its potential expansion. Thus, local farmers (known as gauchos) began to look for cheaper land in agricultural frontier areas such as the cerrado region in the Centre-West region of the country. But North American cultivars did not adapt well to the more tropical latitudes of the Centre-West region and no cultivars adapted to such conditions existed in the world. Brazilian researchers at EMBRAPA, noting the potential of the region, were able to create soybean cultivars adapted to the local conditions (Dall’ Agnol Reference Dall’ Agnol2016, p. 26; Klein and Vidal Luna Reference Klein and Vidal Luna2018, Ch. 6).
The exploration of the Centre-West also required innovative soil management given the quality of local soils. Embrapa helped to resolve the problem of low fertility and high natural acidity of the Centre-West soils, which made the use of the region commercially viable. The conquest of the so-called Cerrado biome is one of the most important achievements of the Brazilian agrarian sciences. In the Cerrado area, new technologies such as crop «tropicalisation», soil correction, nitrogen fixation in legumes, fertilisation and crop management allowed Brazil to transform this very acidic and nutrient-poor lands into 139 million hectares of arable land which has become one of the largest grain production regions in the world (Alves and Da Silva e Souza Reference Alves and Da Silva E Souza2007, pp. 56–67; Faleiro, F. G., and Farias Neto, A. L. de Reference Faleiro and Farias Neto2008; Embrapa Comunicações. 2016; Klein and Vidal Luna Reference Klein and Vidal Luna2018, Ch.4).
In 1972, Brazil exports of soybeans showed a sudden expansion. From then on, growth was explosive (see Figure 3). In the 1976/77 harvest, 6.9 million hectares of soybean were planted, and production reached 12 million tons. By 2019, it was planted on 38.9 million hectares and yielded 121 million tons (CONAB, «SOJA», CONAB, Décimo levantamento).

FIGURE 3 Evolution of Soybean Production in Brazil, 1976/77–2019/20.
Source: Conab (Companhia Nacional de Abastecimento), Safras & «Soja-Brasil Série Histórica…».
Productivity has increased systematically during the past two decades, and output increased at a faster rate than new land usage. Soybeans were cultivated in a few key states, the two biggest being Mato Grosso in the Centre-West region which produced 29 per cent of the grain in the harvest of 2019/2020 and Paraná in the South Region which accounted for 17 per cent of total production. The next two most important were also split into these two regions: Goiás in the Centre-West with 10 per cent and Rio Grande do Sul with 9 per cent in the South region. There is also the increasing importance of a series of North and Northeastern states in what is called the «Matopiba» region which shares the Cerrado biome and is emerging as a new centre of production (see Table 5).
TABLE 5 Brazilian soybean production by region and principal producing states—1990/91 to 2019/20.
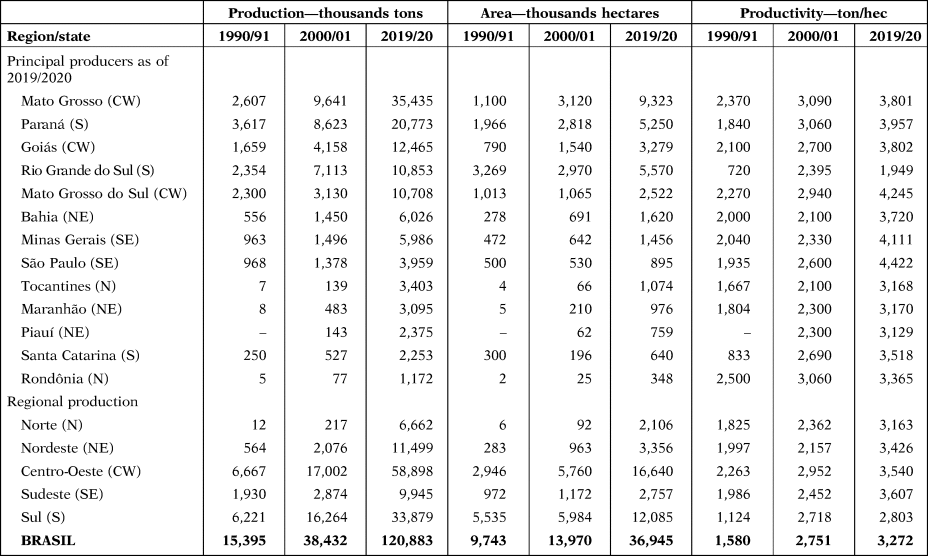
Source: CONAB «SOJA—BRASIL….1976/77–2018/19»; and CONAB «Tabela de Levantamento» Julho 2020 found at https://www.conab.gov.br/info-agor/safras/graos.
In the first decades of Brazilian exportation, soybean meal was often more important than the unprocessed grain. By 2000, the volume of soybeans exported finally exceeded that of soybean meal, and thereafter expanded at an even faster rate, reaching 89 million tons of grain by 2019, while exports of soybean meal have remained relatively stable, now averaging around 17 million tons (USDA, Oilseed, July 2020, p. 6). In this year, 68 per cent of the soybeans grown were exported but only half of the 4 million tons of cake and only 12 per cent of the 8.5 million tons of crushed soybean oil left the country (USDA, Oilseeds, July 2020, pp. 15–17). In terms of the value of these exports in that year, grains represented 80 per cent of all exports from the soybean complex, cake 20 per cent and oils only 2 per cent of the total (CONAB, Séries Históricas, «Grupos de Produtos»). This is a pattern of long-term secular change as the value of cake and oil has systematically declined in the value of the total of soybean complex exports since the turn of the century (see Figure 4). In addition, countries such as China, which consumed 75 per cent of the soybeans exported by Brazil in 2015, tend to prefer to buy raw agricultural products to process them in their own territory. In addition, there are non-producing countries that purchase soybeans for processing and re-export. This is the case of the Netherlands, which in 2018 was the fifth largest exporter of soybean oil and the world's fourth largest soybean cake exporterFootnote 2.

FIGURE 4 Relative Share of Soybean Cake, Oil and Beans in the Value of Soybean Exports, 1970–2018.
Source: FAOSTAT, accessed 8/4/2020 at http://www.fao.org/faostat/en/#data/TP.
In the 1980s, Brazil exported approximately the same amount as Argentina. In the first decade of the 21st century, Brazil passed Argentina and became a major competitor to the United States. In the first decade of the new century, average production was almost 50 million tons, and exports reached 20 million tons (FAOSTAT). By the 2000/2001 harvest, Brazil accounted for 22 per cent of world production, but they produced just under half of U.S. production. Five years later, Brazilian production was only 37 per cent lower than U.S. production, and its exports now equalled those of the United States. By 2016/17, Brazil had definitely past the United States as the world's leading exporter of soybeans, and in the next crop year, it surpassed the United States in total production and has continued to be the world's leading producer and exporter of this grain to the present day (USDA, Oilseeds, February 2019, Table 7).
Despite the extraordinary expansion of soybean production in Brazil, actual volume of land needed to produce soybeans has grown more slowly as productivity has increased at a very fast pace. Moreover, the majority of soybean farms in the Centre-West have occupied abandoned lands which were often denigrated pastures used for cattle production. While some of these lands may have been inside the legal Amazon, they were already cleared by others. There is also the question that the expansion of soybean cultivation may have pushed cattle ranchers further north into the forested area of the Amazon. In July 2006, under pressure from international organisations, ABIOVE (The Brazilian Vegetable Oil Industries Association) and ANEC (The National Grain Exporters Association) agreed to the so-called Soy Moratorium, which guaranteed that its members would not purchase any soybeans produced on deforested Amazonian lands after July 2008. Almost all the satellite monitoring of this agreement finds a high level of compliance and relatively little expansion into the Amazon itself, though major expansion has occurred in the Cerrado region of low scrub plainsFootnote 3. One recent satellite survey estimated that 13 per cent of the soybean crop may have come from the legal Amazon area (Soterroni et al. Reference Soterroni, Fernando M., Aline, Joseph, Pedro R., Leandro and Johannes2019). Illegal loggers, ranchers and miners are the main groups destroying the Amazon.
Aside from soybeans, the country ranks among the world's top five producers of 36 agricultural products and is the world's leading exporter of soybeans, orange juice, sugar, boiler chickens, beef, coffee, tobacco and ethanol. In addition, it is the second largest exporter of corn and cotton. All of these products were produced on essentially the same total arable lands, so that almost all this growth was due to rapidly increasing productivity and a stable farm size, with a declining work force. This can be clearly seen in the total production of all grains and oilseeds, their productivity and land usage from the 1970s until today (see Figure 5).

FIGURE 5 Brazil: Changes in Area (ha), Production and Yield (kg/ha) of all Grains, 1976–2019.
Source: CONAD.
Part of this exceptional growth in soybean production, also seen in other crops, is due to the arrival of biotechnology in agriculture through transgenic cultivars. During the so-called genetically modified organisms (GMOs) penetration movement, some of the largest agrochemical companies have also begun to work with biotechnology and seeds, which has led to an unprecedented move towards convergence between major producers (ABRASEM 2015, p. 11). At the end of 2016, there were 74 transgenic plants approved for sale in Brazil of which 13 were for soybeansFootnote 4. Brazil is among the countries that most use transgenic plants, along with the United States, Argentina, India and Canada. According to estimates, in the 2015/2016 harvest, 44.2 million hectares were planted with transgenic seeds. This total includes 91 per cent of the cultivated area with soybean, corn and cotton (ABRASEM 2015, p. 13).
Although production of soybeans has been dominated by the countries of the Western hemisphere, there has been a change in processing the beans. In the 1980s, there was still some proportionality between countries' participation in soybean production and their crushing capacity, with the country producing the oilseed also industrialised it. Currently, production and crushing have lost their geographical link. Some countries in Europe (mainly the Netherlands, Spain and Germany) and China have increasing installed capacity for soybean processing.
Moreover, there has evolved a complex Value Chains which distribute soybeans and their products throughout the world. There is currently an international division of labour, where nations specialise in one or a few stages, depending on their natural, human and technological resources endowments and their geopolitical relations with other countries. Geographic flexibility and the ability to relocate its resources and operations on a global scale are critical to minimizing total costs and taking advantage of different factors of production across countries. For the model of globally distributed production chains to work, in addition to the processes of economic liberalisation and deregulation, the presence of transnational corporations, which constitute links between geographically dispersed spaces, is fundamentalFootnote 5.
The inputs of these global products, including genetically modified seeds and fertilisers and insecticides, are the main focus of attention of the large multinationals in the sector, which control the supply of these inputs in virtually every major agricultural country in the world, including the Southern Cone countries. The use of GMOs and the patenting laws on products provided by these large multinationals has been fundamental in the cultivation of soybeans. Such penetration has taken place under heated debate and permanent questioning from entities that defend biodiversity and sustainability.
Another problem in the evolving soybean system and the modernisation process of Brazilian agriculture is the lack of change in landownership. The GINI index of inequality in ownership has remained unchanged since the earliest agricultural censuses in Brazil. Soybeans, like all the other major commercial crops, was concentrated on large farms. In the agricultural census of 2017, farms of over 500 hectares produced 65 per cent of the soybeans, but constituted only 5 per cent of the producers. But there was room for smaller properties. Producers of up to 100 hectares accounted for 13 per cent of production and brought together 83 per cent of the producers. What is impressive about this distribution of soybean farms is that the average productivity of the largest and the smallest producers was almost identical suggesting a common use of seeds and modern technology from the largest to the smallest producer (see Table 6). Thus, the pattern of most food crops of high productivity in large farms and lower productivity in smaller units is not evident in soybean cultivationFootnote 6.
TABLE 6 Brazil: production of soybeans, number of producers, production and area, agricultural census 2017 (area in hectares and production in tons).
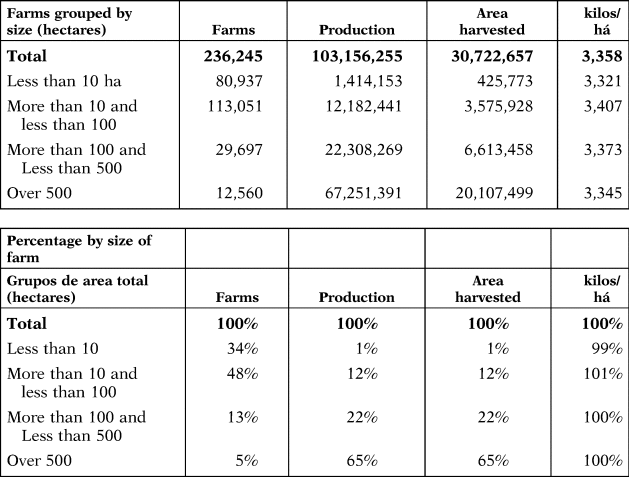
Source: IBGE, SIDRA, Table 6, 958.
The crushing industry, however, has not grown as dynamically as farm production. Because of Brazilian taxes, soybean processing is much smaller and more fragmented than one would expect in such a dynamic industry. In a survey of 2018, it was estimated that there were 121 soybean oil processing units, of which 96 were active. There were also 58 refining and packaging units, of which 45 were active. In the case of processing units, a quarter of production was done in units of up to 1,500 ton/day; half in units between 1,500 and 3,000 tons/day and a quarter in units above 3,000 tons/day (Sediyama et al. Reference Sediyama, Luiz Gonzaga, Cristina Lelis and Paulo Henrique2013, pp. 162–182; ABIOVE 2018). As it is fiscally inefficient to move goods across state lines in Brazil, the implantation of large concentrating units of the production is not viable.
The export of soybeans is also affected by the logistic limitations in Brazil and the failure in recent decades of improving the transport infrastructure. Thus, the extraordinary growth in soybean exports has occurred despite the logistical disadvantages that the country presents, as the main productive centres, particularly those in the Centre-West, are located far from the main ports and local transport is both inefficient and expensive. When comparing Brazil, the United States and Argentina, the disadvantage of Brazil is clear. Thus, for the 2015 harvest, it was estimated that the transportation of soybeans from important production centres in the three countries had costs of US$113 per ton from Sorriso (MT/Brazil), US$79 from Cordoba Argentina and US$51 per ton from Illinois in the United States (Jornalismo Agropecuário 2015, p. 9).
Despite these costs, productivity has been so high in soybean production that Brazil can easily compete in the international market even when there are no international tariff wars to favour its exports. This is due to its extraordinary increase in factors of production in Brazilian agriculture, which since the 1960s has experienced among the highest growth rates in the world (see Table 7).
TABLE 7 Agricultural production as measured by total factor productivity by countries and groups of countries, 1961–2009 average change.

Source: Fuglie (Reference Fuglie, Fuglie, Wang and Eldon Ball2012), Table A16.2.
Note: The value of production—average for the period 2006–2009—is in constant US$ of 2005.
Along with opening up some of the poorer frontier regions of Brazil to modern farming, soybean development in Brazil has also had a major impact in propelling Brazil into being a world class producer and exporter of maize. Corn became the main alternative crop planted in soybean fields. By the end of the second decade of the 21st century, Brazil passed Argentina to become the world's third largest producer of maize and the second largest exporter of this product. It has done so by adopting no-till planting and the development of two annual crops per year—with the second planting over the first planting maize plants now becoming the largest crop in any year. In 2019/2020, Brazil exported at 35 million tons, and together with Argentina, these two countries exported 73 million tons, which accounted for 42 per cent of world exports and surpassed the 47 million tons exported by the United States, until then the world's leading exporter (USDA, Grains July 2020, pp. 28–29).
Brazil entered soybean production late by American standards. It was first associated as a rotation crop for wheat and then became an oil staple for Brazilian consumption by the end of the last decades of the 20th century. But it has become a world dominant producer only in the last two decades. This growth is due to the extraordinary productivity achieved by national producers, despite the high costs of production. There has also been a steady shift of production from the temperate lands of the South region to the more tropical soils of the Centre-West region. This migration was due to commercial farmers from the South bringing with them modern commercial agricultural practices. It was also made possible by the massive state investments in agricultural research, which through the efforts of Embrapa produced the adopted seeds which could be used in these new more tropical soils, just as it adopted the chemicals needed to improve its fertility. Already before the tariff wars between China and the United States, Brazil was at the level of U.S. production, and since then has well surpassed North American production to become the world leader in this essential crop.
4. EVOLUTION OF SOYBEAN PRODUCTION IN SOUTH AMERICA—ARGENTINA
In Argentina, the world's third largest producer, the intensification production of soybeans also took place in the late twentieth period. Excellent weather conditions and the development of suitable varieties for this temperate climate producer allowed the country to rapidly expand its production in the 1970s. Taking advantage of world market opportunities, and consolidating soybeans as the typical wheat rotation crop became the norm here as well (Wesz Junior Reference Wesz Junior2014a, Reference Wesz Junior2014b, p. 41).
But the evolution of the crop in Argentina differed in fundamental ways from its northern neighbour due to the historical evolution of Argentine agriculture. At the beginning of the 20th century, Brazil produced only a few basic agricultural exports, had a rudimentary agriculture and experienced low food security. Argentina on the other hand represented one of the most important world producers of grain and meat, with a prominent position in world agriculture from the beginning of the 20th century. The country was called the «Granary of the World», accounting for about half of the world's cereal and flax market (Scobie Reference Scobie1964; Cortés Conde Reference Cortés Conde1979; Giberti Reference Giberti1981; Ezequiel Gallo Reference Gallo1983; Adelman Reference Adelman1994; Arriaga Reference Arriaga1999; Barsky and Gelman Reference Barsky and Gelman2001; Hora Reference Hora2001). Even today Argentina is an agricultural powerhouse, and is the world's largest producer of soybean oil, the second largest producer of sunflower oil, the third largest producer of soybeans and sunflowers, the fourth largest of powdered milk and is first in the world in oil exports derived from these two major oilseeds. It is also the third largest exporter of soybeans and maize and numerous other products (Bisang et al. Reference Bisang, Anlló and Camp2008, p. 172).
The availability of high-quality land, the abundance of immigrants for agricultural work, an adequate rail and storage network, as well as improved maritime transport are key elements explaining Argentina's early position in the world grain market (Arriaga Reference Arriaga1999, p. 11). Until the late 19th century, Argentine exports had been dominated by meat. Although beef exports continued to grow after 1900, there was now an explosive growth of grain exports, principally of wheat and corn, and also of flax and by the decade of the 1920s grains equalled in value the exports of meats. But from the late 1920s until the early 1960s, there was stagnation in productivity and a decline in agricultural exports. The internal market took an ever larger portion of meat production, flax disappeared as a major export, maize production declined steadily and even wheat entered a period of stagnation. The total lands dedicated to grain production also declined significantly.
Government policies turned negative towards agriculture. During the post-1929 period of decline, the country adopted new market controls for agriculture due to the 40–50 per cent fall in the value of the country's exports during the Great Depression. In 1933, the Grains Regulatory Board was established to sustain market prices. The government also began to operate a large storage system and in 1935 created the National Commission of Grains and Elevators, which intervened in the whole process of production and commercialisation of grains and seeds (Arriaga Reference Arriaga1999, p. 14). This government intervention continued on and off for the next 40 years. During this period, there was relative stability in the productivity of the main grains but no serious growth. At the same time, the national economy experienced major periods of crisis. The result was an extraordinary drop in the quantum index of exports from a base of 100 in 1925/29 to 74 in 1957–1961 (Díaz-Alejandro Reference Diaz-Alejandro1966, p. 20). Even as late as the 1980s, the taxing of agriculture to support industrialisation and the high costs of manufacturing along with an over-valued currency policy seriously weakened national agriculture. One study estimates that the cumulative effect of interventions «reduced the country's foreign exchange earnings during the 1982 to 1985 period by more than $ 6 billion a year, on average»Footnote 7.
But this began to change slowly after the middle of the 20th century. The government investments through INTA (The National Agricultural Technology Institute), which was founded in 1956, applied the latest science to agriculture. There was also the reduction of machinery costs due to the creation of a national tractor and truck industry, and there began to be planted new crops with new potential marketsFootnote 8. Finally, there was a major change in government policy in terms of credit and funding for agriculture (Barsky and Gelman Reference Barsky and Gelman2001, pp. 390–395).
Not only did these changes help traditional Argentine grains to expand, but there was a major growth of a new oilseed. Soybean plantings would prove ideal for Argentina, since this was not a crop consumed nationally and thus faced no price or quota restrictions which from time to time affected all the other crops. The changes can be seen in the slow return to increased productivity in all crops which only passed the yield levels of the 1920s in the 1960s (see Table 8).
TABLE 8 Argentina: average productivity of cereals and oilseeds (kgs/ha) by quinquennium, 1925–69.

Source: Barsky and Gelman (Reference Barsky and Gelman2001), p. 397 cuadro 2.
Thereafter growth was rapid. Grains and oilseed crops went 15 million tons in 1955/59 to 40 million tons by 1980/84 (Hora Reference Hora2012, pp. 166–167). Whereas cereal and oilseed production grew at 3.5 per cent per annum in the golden years from 1900 to 1935, and then stagnated for some two decades, growth began again in the late 1950s, and by the end of the century and the first decade of the new century, annual rates of 5.8 per cent growth were achieved (Bisan Reference Bisan and Kosacoff2007, p. 188).
Although there were experimental soybean plantations since the beginning of the 20th century, commercial planting only occurred from the mid-20th century (Barsky and Gelman Reference Barsky and Gelman2001, p. 398). The comparative advantages of growing sunflower as a raw material for edible oil, and a relative lack of knowledge of the soybean production process delayed soybean penetration in Argentina. Until the mid-1950s, an important part of the soybeans produced was not harvested but used as green manure. It was in the harvest of 1961/1962 that soybeans suddenly took off, with planting increasing suddenly to 10,000 hectares in that year and 20,000 the next, and with production averaging around 16,000 tons of soybeans in the first 5-year period from 1961/1962 and 32,000 tons by the next quinquennium (MAGYP 1987, p. 27). In the 1960s, better knowledge of cultivation through studies conducted by INTA and the universities, as well as changes in the international market, led the government to set a minimum price for soybeans in 1965 for the first time.
By 1970, there was a major expansion of cultivation, which occurred in high-quality lands in the Pampean zone, lands traditionally occupied by corn (Dougnac 2019). Soybean production, which was grown on only 25,000 hectares in 1970, surpassed two million hectares in 1980. Production reached 3.5 million tons and 3.1 million tons of soybean products were exported, the vast majority in the form of grain. As in Brazil, soybean became an important crop for rotation with the planting of wheat. But in those years, the area devoted to soybeans resembled that devoted to sunflowers and was only 40 per cent of the area planted in wheat (FAOSTAT).
Until the late 1980s, Argentine agriculture was still dominated by the traditional crops such as wheat, sunflower and corn, along with beef production. Although technological improvements had occurred with these crops and with soybeans, they were predominantly focused on processes, such as mechanisation, but there still was little use of fertilisers. In livestock, the natural pastures still predominated (Balsa Reference Balsa2004; Reboratti Reference Reboratti2010, p. 64). The great transformation of production occurred with the introduction of genetically modified seeds, especially in soybean cultivation. In 1996, the modified glyphosate-resistant soy seeds produced by Monsanto were launched in the United States, and in the same year, they were approved by the Argentine authorities. From then on, the use of this seed had an explosive expansion (Qaim and Traxler Reference Qaim and Traxler2005, p. 74). This first genetically modified soybean seed had as its main feature the tolerance to the herbicides Glyphosate, the active ingredient of Herbicide Roundup, produced by Monsanto and one of the most potent herbicides in the market (Vara Reference Vara2004, pp. 104–105). This herbicide was very practical for use in the no-till soybean farming which was widely practised in Argentina. The emergence of a transgenic glyphosate-resistant variety was thus extremely important for soybean production in the countryFootnote 9. An important aspect of the rapid spread of RR soybeans among Argentine producers was their low cost, as their essential components have not been subject to monopolistic market constraints since their introduction in the country due to tremendous opposition of growers and the existence of pirated seedsFootnote 10. But despite the existence of a competitive market, in which there are numerous generics available, Monsanto still maintained a share of around 50 per cent of the herbicide market, and the RR seed is not subject to monopoly control in the Argentine market (Vara Reference Vara2004, p. 107). Another important element is that Argentine legislation allows growers to use their own seeds to replant. This is a great advantage because soybean quality does not change from generation to generation, as corn hybrids do. Finally, such technological innovation could also be used by small and medium producers without scale disadvantages (Penna and Lema Reference Penna and Lema2003, p. 209; Vara Reference Vara2004, pp. 107–108; Qaim and Traxler Reference Qaim and Traxler2005, p. 75).
Except for the unusual case of soybeans, all other patents on genetically modified seeds have been maintained. Thus, the diffusion of genetically modified seeds, in Argentina, as in Brazil, was dominated by a few large multinational companies, which seek to introduce «technology packages» for use on a world scale. For this reason, such solutions focus on cross-border consumer and crop products, allowing for product development scaled to large areas. The need for scale even explains the continuous merger and incorporation processes of large companies in the sector. Currently, both in Argentina and Brazil, such markets are dominated by Monsanto, Dupont, Syngenta and BasfFootnote 11. These companies carry out their research in their respective headquarters, performing local activities to adapt to the soil, climate and regulatory conditions of each region. As part of the value chains they organised, they also played a major role in exporting Argentine agricultural production. Cargil, ADM and Bunge accounted for a third of total grains and oilseeds in exports from Argentina in 2018 and all fully foreign-owned companies together exported 53 per cent of the total volumeFootnote 12.
Between the harvest in 1996/97 and the harvest of 1997/98, these RR soybean seeds went from being planted in 50,000 hectares (or only 0.7 per cent of the soybean area) to being planted on 1,756,000 hectares (or 25 per cent of the total area planted in these crops). By the harvest of the next year, 80 per cent of the crop was produced with these seeds, and by the harvest of 2002/2003, it was planted in over 95 per cent of all lands producing soybeans (Vara Reference Vara2004, p. 105). Soybeans already accounted for close to 50 per cent of total volume output of all agricultural products by the harvest of 2001/2002, and made up 20 per cent of all Argentinian exports. It is estimated that by then two-thirds were produced under no-tillage plantings (Bisang Reference Bisang2003, pp. 2–3). Studies conducted in 2002 showed that there was no evidence regarding the better yield of RR seed compared to traditional seed. Rapid diffusion was mainly based on how the seed reduced production costs for herbicidesFootnote 13. As of 2015, Argentina had four genetically modified soybeans approved and eleven corn and three cotton-modified seeds (MAGYP PQBio 2015). Virtually, 100 per cent of soybean and cotton cultivation and 96 per cent of Argentina's corn cultivation now use genetically modified seedsFootnote 14. The 24.3 million hectares planted using genetically modified seeds place the country as the third largest cultivated area with genetically modified seeds in the world, behind the United States (73.1 million hectares) and Brazil which has 42.2 million hectares plantedFootnote 15.
Soybean productivity which had been relatively stable since the mid-1970s has increased significantly in recent years. Thus, average yield, which was 2,035 kg in the 1980s, has risen over the past 3 years to 3,120 kg. Thus, soybeans increased productivity by 53 per cent, compared to an increase of 105 per cent in the case of corn. Corn in the 1980s average yield per hectare was 3,621 kg and in the current period has reached 7,433 kg. Wheat, although it has lost importance in production and exports, showed a similar productivity increase to corn, practically doubling yields between this period (see Figure 6).

FIGURE 6 Argentina: Productivity for Maize, Soybeans and Wheat, 1961–2018 (index 1961–1970 = 100; 3-year moving average).
Source: FAOSTAT.
The Pampas region initially dominated soybean production as it had all the traditional grains and cattle. Even today, it accounts for 80 per cent of Argentina's three main crops: soybeans, maize and wheat. But so successful were soybeans that they soon upset the traditional balance in Pampean agriculture, and significantly reduced the biodiversity of this crucial area as soybeans replaced pastures (Rótolo et al. Reference Rótolo, Montico, Francis and Ulgiati2015, p. 79). In the Pampas, the term agriculturisation has been adopted to define «the continuing and growing use of land for large-scale cultivation, in the detriment of the other main production alternative, cattle production». By the 21st century, this «agriculturisation» led to soybeans being planted on 17 million hectares with an output of 55 million tons in 2017 (see Figure 7). There was a consequent decline in the area planted in wheat and sunflowers, the traditional oilseed plant of Argentina. Only maize plantings increased from the 1990s to the 2010s, but not at the rhythm of soybeans (Gras Reference Gras2013, p. 76; Urcola et al. Reference Urcola, Xavier, Arnauld De Sartre, Veiga and Albaladejo2015, 32; FAOSTAT). The process of growing grains and oilseeds and the continuous use of land for agricultural cultivation, rather than for mixed farming or cattle-raising, were associated with technological change. In the cattle industry, there was a move to feed lots from natural pastures. There was also an increasing development of monoculture-oriented production of soybeans in a wheat-soybean combination (Manuel-Navarrete et al. Reference Manuel-Navarrete, Gilberto C., Mariela, Martín, Diego, Hilda and Pedro2006, p. 7).

FIGURE 7 Soybean Production in Argentina 1961–1970.
Source: FAOSTAT at http://www.fao.org/faostat/en/#data/QC; USDA, Oilseeds: World Markets & Trade, July 2020 for 2019 data.
The growing of soybeans, especially in the Pampa region, has led to a very rapid rise in land prices. Because of this price inflation, producers have increasingly turned to renting or leasing land, a long tradition in Argentina which was a well-established practice in traditional grain productionFootnote 16. It is estimated that in the census of 2002, some 70 per cent of the farmland in this vital region was rented, and then usually for just one planting season (Piñeiro and Villarreal Reference Piñeiro and Villarreal2005, p. 34). The renters can be «landowners who farm or rent out their own land, farmers-entrepreneurs who rent land for their own account and add to their own farms or gather in companies with other producers, service companies for the main farming operations, and agro-industrial firms». For small farmers in Argentina, this has led to the evolution of complex value chains with companies providing inputs for payments in beans after harvesting, a system not that dissimilar from what some producers do in Brazil (Gutman Reference Gutman, Schejtman and Barsky2008, pp. 436–452). But it has also led to a system unique to Argentina of the so-called pooles de siembra or planting pools established primarily for soybean production which gathers together small amounts of capital of diverse origin in an investment fund and during a fixed period of one or more seasons rents lands and contracts with third party services to plant, maintain and then harvest the crop (Dagotto Reference Dagotto, Alejandro and Barsky2008, pp. 389–404; Murmis and Murmis Reference Murmis and Murmis2012, pp. 490–508; Caligaris Reference Caligaris2015; Ortega Reference Ortega2017). In turn, the high cost of machinery and the need for specialised workers have led to the full development of planting, irrigating and harvesting companies, called «contratistas de cosecha» independent of the producer (Bisang et al. Reference Bisang, Anlló and Camp2008, p. 176). As of the census of 2002, some 47 per cent of the 134,000 agricultural enterprises (known as EAP or farms) of the Pampa region used such firms (Piñeiro and Villarreal Reference Piñeiro and Villarreal2005, p. 34). In sum, this Argentine «agriculturalisation» of agribusiness accounts for about a quarter of Argentine GDP and over half of the value of all exports in the second decade of the 21st century (Bisang et al. Reference Bisang, Anlló and Camp2008, p. 172).
This massive shift into soybean production has led to some negative land practices. While soybeans replaced pastures in the Pampa region and has been consistently produced by no-tillage direct-drill systems, in the new lands of the Northwest, it has replaced native forests (Paruelo et al. Reference Paruelo, Guerschman and Verón2005, pp. 14–23; Choumert and Phelinas Reference Choumert and Phelinas2015, p. 134). Another result of this expansion of soybeans is the progressive decline of family farming and of small producers (Gras Reference Gras2009, pp. 345–364). Although there were only modest changes in land tenure for most of the 20th century until 1960, change was rapid thereafter. There was both a decline of farm units of under 100 hectares, which went from 56 to 38 per cent of the total farms in the period 1960–2002, whereas those over a thousand hectares went from accounting for 24 per cent of all farms to 44 per cent of these enterprises (see Table 9).
TABLE 9 Changes in farmland size (of whatever tenure) in the Pampa region of Argentina 1960/2002.
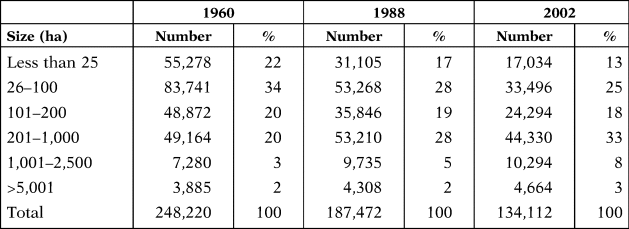
Source: Piñeiro and Villarreal (Reference Piñeiro and Villarreal2005), p. 36.
It was in the government of Carlos Menem (1989–1999) that Argentina adopted the liberal reforms of the Washington Consensus. These reforms, like those in Brazil, had a major impact on agriculture as well. All taxes on exports were abolished and tariffs on machinery imports needed for agriculture were eliminated. All government regulatory agencies were closed and prices were determined by the international market. Cheap government credit was eliminated, but a 1995 law canalised private capital to the agricultural sector (Gras Reference Gras2013, p. 77). This combined with the commodities boom that began in the late 1990s, as China began massive imports of food, proved a major turning point in the modernisation of Argentine agriculture.
But the return of more interventionist governments in the 21st century led to new attempts to tax exports, and reserve for the government some of the rents being generated by the export boom. After much conflict between the government and producers, Congress rejected these taxes (Freytes and O'farrell Reference Freytes and O'farrell2017, pp. 181–196). Nevertheless, the governments of this period also intervened with new price and export controls in a pattern of intervention found in many South American governments, but not in Brazil (Frenkel and Rapetti Reference Frenkel and Rapetti2011; Colombini Neto Reference Colombini Neto2016, pp. 401–428). After a period of strong growth in the international market, the 2008 crisis and the softening of international commodity prices created new problems for several Latin American countries, especially Argentina, which again showed declining international reserves and increasing international vulnerability. Various economic plans followed and even the Macri government, which presented itself as a liberal, promoted broad economic intervention, including price controls.
This interventionism in agriculture with export taxes or quotas; the generally poor performance of the Argentine economy; and the successive external crises and currency manipulation also affected the country's agricultural performance (Carvallo Reference Cavallo1988; Mundlak et al. Reference Mundlak, Cavallo and Domenech1989). The most affected segment would be meat, whose exportation had been traditionally penalised, since foreign sales compete with the domestic market, which is characterised by the high average consumption of this product. These influences can be seen in poor performance of the total factor productivity of agriculture in Argentina from the 1980s onwards, especially compared to Brazil.
Over the last three decades, between 1980/90 and 2001/09, Brazil had an average annual TFP of around 3 per cent. Argentina, after a positive performance in the 1971–1980s of 3 per cent, fell to around 1.5 per cent over the next two decades (see Table 10). This poor performance of Argentine agriculture is explained in particular by the experience of livestock, which since 1961 has shown TFP indicators far below agricultural production, undermining the results of agriculture as a whole. Since 1961, livestock TFP has remained around 1 per cent, being negative in the most recent period between 2008 and 2013 (Lema Reference Lema2015, pp. 15–16). When considering only agricultural production, there is a more positive performance throughout the period, averaging around 3 per cent per year between 1961 and 2007, with retraction to 1.96 per cent between 2008 and 2013.
TABLE 10 Agricultural production by countries and groups of countries: value of production and total factor productivity 1961–2009.

Source: Fuglie (Reference Fuglie, Fuglie, Wang and Eldon Ball2012), Table A16.2.
Notes: The value of production is the average for the period 2006–2009—in constant US$ of 2005.
Although there was a «confiscation» tax on soybean exports during this period of rapid growth, a study carried out in 2006 calculated that the total cost of Argentine production and placement of the CIF product in the port of Rotterdam was still cheaper than competing producers. Even with an export duty of 23.5 per cent over the FOB price, Argentine soybeans cost less than duty-free soybeans from Brazil and the United States: or US$250.83/ton in Argentina; US$274.84/ton in the United States and US$309.26/ton in Brazil (Lavarello et al. Reference Lavarello, Gutman and Rios2010).
Traditionally, Argentina, in areas with favourable climate, alternated agriculture and livestock in an annual rotation sequence. In marginal areas, livestock was the predominant activity, based on the use of natural pastures. The rotation of pasture agriculture practised for more than a century in the wet pampas has been one of the essential practices for preserving the ecosystem, maintaining sustainability, productivity and the profitability of agriculture. Soybean production has affected this balanced system. Everywhere, the high international prices encouraged the replacement of livestock by legumes. In the 1990s, soybean expansion in the Pampa region also replaced other crops such as corn, wheat, sorghum, sunflowers.
Soybean expansion also affected previously marginal areas or changed zones dedicated to other crops. Thus, it expanded into the traditional maize region in the province of Misiones, in some sectors of Tucumán, and in areas in Chaco and Salta. In the second half of the decade, cultivation advanced to the west, seeking through rotation to improve the productivity of agricultural lands in the sugar cane and cotton region in northern Santa Fe. In the northeast, soybeans became important in the areas of Chaco, Formosa, Corrientes as well as Misiones. In the second half of the 1990s, the spread of transgenic soybeans, accompanied by reduced tillage costs, accelerated the deforestation process in the western Chaco wetland. In the Pampean region, soybeans expelled the cultivation of corn, sorghum and pasture. The expansion of soybean in the period 1996–2000 spread towards Entre Rios, and there was a sharp increase in the province of Buenos Aires, north of Cordoba and east of Santiago del Estero. Much of the decline in the rainforest in the province of Córdoba is largely due to soybeans. The spread of new agricultural techniques stimulated the double wheat-soybean rotation, which determined that in many areas the behaviour of wheat was subject to soybeans (Conte et al. Reference Conte, M., M. and F.2009; Andrade and Satorre Reference Andrade and Satorre2015).
Because all provinces except Mendoza are now producing soybeans, there have been changes in the relative importance of the provinces in national production in the past 40 years. Whereas the province of Santa Fe dominated output in the early period, accounting for 48 per cent of output in 1980/81, the 10.5 million tons it produced in the harvest of 2018/19 represented only 19 per cent of total national production. Buenos Aires and Cordoba greatly expanded their share of output in the following decades, now accounting 32 and 28 per cent, respectively, in the latter year, whereas in 1980/81 the two accounted for just 44 per cent. But every province except Mendoza was now producing Soybeans. Entre Rios, Santiago del Estero, La Pampa, Salta and the Chaco which produced little or no grain in the first period were now significant producers. Entre Rios and Santiago del Estero were producing over 3 million tons of soybeans and La Pampa, Salta and Chaco over 1 million. Even San Luis and Tucuman were now producing over 600,000 tons each by the harvest of 2018/19 (see Figure 8).
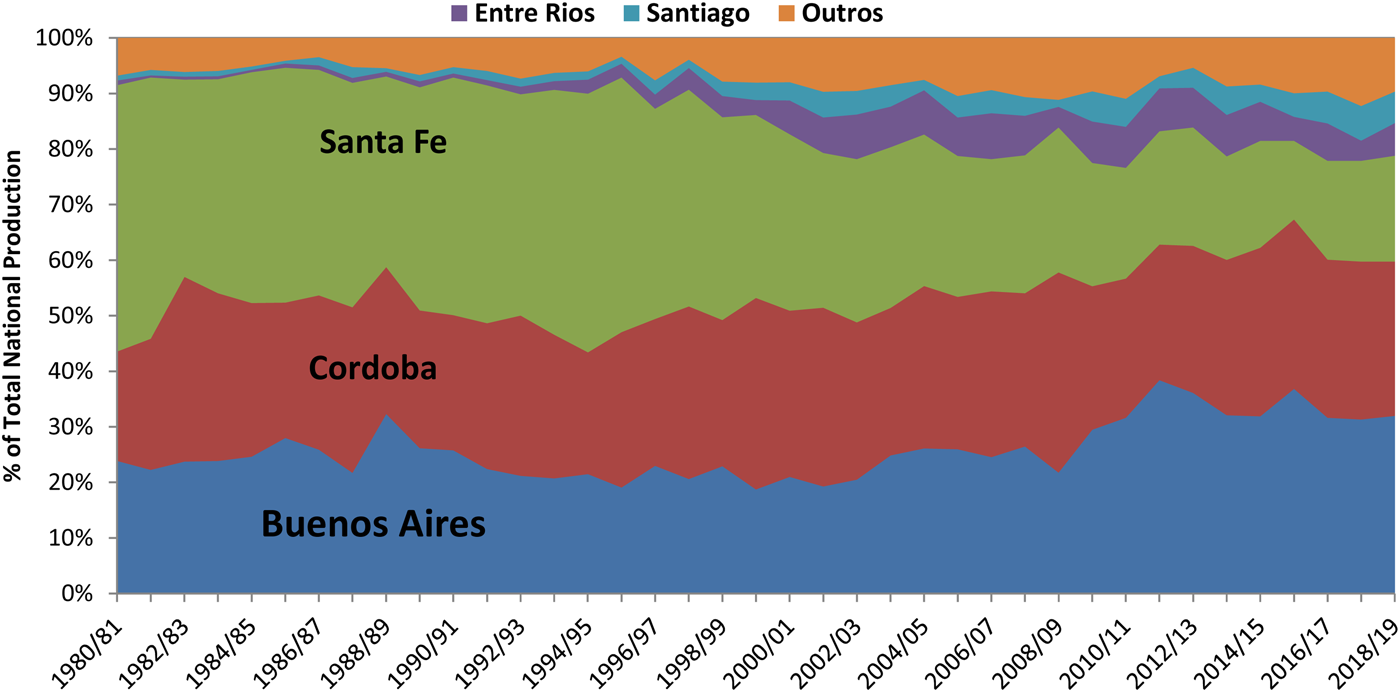
FIGURE 8 Share of Production of Soybeans by Province, Argentina, 1980/81–2018/19.
Source: MAGYP http://datosestimaciones.magyp.gob.ar/reportes.php?reporte-Estimaciones.
Until the mid-1990s, the Pampean region accounted for over 90 per cent, but this declined to 80 per cent in the following years as the regions of the Northeast and Northwest came into production. Today soybean products are the most important crop in the most important agricultural regions in the country. Thus, soybeans represent 46 per cent of the cultivated area in the Pampean Region, 51 per cent of the Northeast and 37 per cent of the Northwest. In 1990/91, wheat still occupied the largest area planted in the Pampean region, but by the harvest of 2017/2018, soybeans were planted on 46 per cent of the 29 million hectares of Pampas crop lands, maize on 23 per cent of these lands and wheat on only 15 per cent (MAGYP).
Among the producers of soybeans, a significant share of production is in the hands of large landowners. Thus, producers between 50 and 500 hectares represent 30 per cent of the cultivated area; producers between 500 and 100 hectares make up 20 per cent; and the largest producers with an area of over 1,000 hectares account for half of the area, although only 12 per cent of the producers (Wesz Junior Reference Wesz Junior2014a, Reference Wesz Junior2014b, p. 139). Significant shares of these producers were integrated into complex value chains of companies that provided the basic inputs for their production. By 2018, the participation of some 31 agribusiness food chains accounted for 15 per cent of Argentine GDP, 48 per cent of the value of its exports and 11 per cent of total national employment. They were particularly important in soybean exports but less so in all the other exports (Lódola et al. Reference Lódola, Brigo, Morra, Anlló, Bisang and Salvatierra2010, pp. 54–56).
Argentine agricultural exports suffered the positive and negative impacts of the world economy, as well as the successive internal crises. After a long period of relative stagnation in the 1970s and 1980s, there was significant growth when stability was achieved in the 1990s, and from then until the early years of the 21st century, a new boom occurred as a result of the growth of international trade and commodity prices. Export growth was exponential, total exports going from US$26 billion in 2000 to US$65 billion in 2019. In the same period, exports of the soybean complex (beans, cake, oil and other products) increased from US$3.9 billion to US$16.9 billion in the same period, going from 15 to 26 per cent of the value of total exports (see Figure 9).

FIGURE 9 Evolution of the Total Exports and Soybean Complex Exports from Argentina, 1973–2019.
Source: INDEC.
Soybeans and their products today represent the main agricultural product of the country, whether it has terms of production, planted area or value of exports. Soybean and corn currently lead Argentine production, soybeans with 55 million tons and corn with 50 million tons. Wheat production amounts to only 18 million tons, with low growth over the last 30 years, as the average production in the 1980s already exceeded 10 million tons. In that decade, the average soybean production was only 7 million tons. Sunflower production has shown little growth over the last 30 years (see Figure 10).

Soybean production occupies about 60 per cent of the area planted with grain and the complex of soybean products accounts for half of agricultural exports and about a quarter of the country's export value. The sum of exports of meat, wheat and corn, traditional Argentine export products now represents only 40 per cent of the value of exports accounted for by the soybean complex. In terms of exports, the performance of soybeans has been extraordinary, going from US$4 billion in 2000 to US$13 billion in 2016. Corn also multiplied by four, but only represents a quarter of the value exported by soybeans (Bisang et al. Reference Roberto, Rafael and Agustin Lodola2018, p. 29). This revolution in the structure of agricultural exports can be seen in the evolution of the main five products exported since 1980. Already by 1990, soybeans and its derivatives were the leading export crop in terms of value and this domination has continued until the present day (see Table 11).
TABLE 11 Exportation of the five principal agricultural products from Argentina 980/2016 (value in US$ millions).
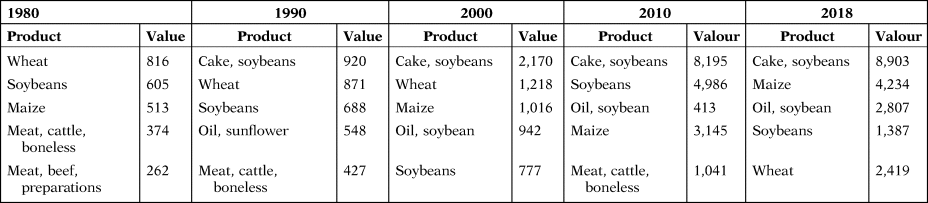
Source: FAOSTAT.
5. CONCLUSION
Although soybeans became the primary agricultural export of both Brazil and Argentina quite recently, it had a different impact in both countries. In Brazil, soybeans continued to be grown in a traditional southern region without the serious displacement of other crops and then expanded to an empty frontier region which turned Mato Grosso into a leading producer. Soybean planting also helped develop new exports from Brazil. This was the case with corn, which was now sown in alternate years with soybeans and allowed Brazil to emerge as the world's second largest exporter of corn replacing Argentina in this role.
Productivity and area dedicated to soybeans has steadily increased in the past decade in both countries. What is impressive is that the yield per hectare in these two Latin American has grown considerably in this period and in any given year, depending on climactic conditions, can equal or exceed U.S. productivity. These two largest Latin American producers have increased area planted at a much higher average annual rate than the United States. Even the three smaller regional producers (Paraguay, Bolivia and Uruguay) have expanded at this pace. In this decade, Argentina and Brazil increased their lands dedicated to this crop by around 10 per cent per annum, and even Paraguay grew at 5 per cent per annum, compared to only a 1.2 per cent annual increase of the United States (see Table 12).
TABLE 12 Area planted in soybeans and yields for the major American producers, 2000/01 to 2020/21, area in millions of hectares and yield in metric tons per hectare.
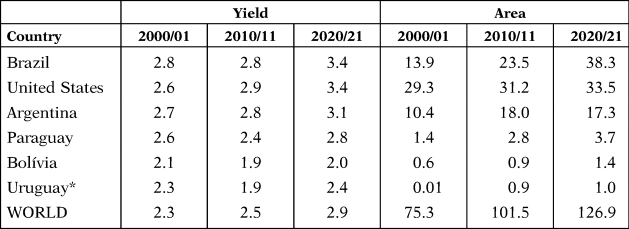
Source: USDA, World Agriculture Production May 2020, Table 11; USDA, World Agriculture Production May 2010, Table 11; USDA, World Agriculture Production August 2002, Table 11; FAOSTAT for Bolivian and Uruguayan numbers in 2000/2001.
Notes: *Given that 2000 was an exceptionally severe year for Uruguay we have used the more normal year of 2001 for comparisons.
This extraordinary growth in production and productivity has been spurred by rising world demand and attractive prices, and has been made possible by increasing productivity, stemming from the introduction of innovative production processes such as biotechnology, modern agricultural training, massive introduction of machines and chemicals and the creation of complex value chains that integrate various stages of the productive, financial and commercial processes in both countries (Rocha and Arámbula Reference Rocha and Villalobos Arámbula2012, Ch. 1). As in the case of other major grains and oilseeds, there have been profound technological transformations in soybean cultivation since the late 20th century, through the introduction of precision agriculture, new fertilisers and pesticides, and new cultivars, in particular GMOs, which together represented a revolution in agricultural productivity in the major exporting countries (Hategekiman and Trant Reference Hategekiman and Trant2002, pp. 357–371; Traxler Reference Traxler2004; Wright and Shih Reference Wright and Shih2010).
But the structural impact of soybean production has differed in these two countries. The «agriculturalisation» of Argentina through the expansion of soybean production has upset traditional exports and taken over lands that were dedicated to pastures and more traditional crops. It has also led to deforestation of native forests in marginal frontier lands of the Northern regions of Argentina. In the Brazilian case, most of the new soybean-producing lands did not displace older crops since they were planted on new or abandoned lands of the Cerrado. Nor have Brazilian producers faced as heavy a direct taxation as have the Argentine producers, as government policy towards agriculture has been more positive over the last few decades compared to actions of the Argentine government. It would appear from the production data of the last few years that soybean production has reached a new plateau in Argentina, being less than half of Brazilian output, while production of soybeans continues to expand in Brazil (see Figure 11).

FIGURE 11 Soybean Production in Argentina and Brazil, 1961–2019.
Source: FAOSTAT at http://www.fao.org/faostat/en/#data/QC; USDA, Oilseeds: World Market & Trade, Dec. 2019 for 2017–19 data.
Another fundamental difference is the role played by landowners in the production process. In Argentina, it appears that the majority of soybean production is done by renters of land, either as individuals or through companies of pooled capital, and with a high percentage of all technical aspects from seeds and machines and expertise being rented. This appears to be due to the high price of land and the fact that in Argentina, soybeans have among the highest costs of inputs of the major crops, with a significant need for capital needed for insecticides, herbicides and machinery (Pizarro and Cascardo Reference Pizarro, Cascardo and Barsky1991, p. 206). This level of division between landowners and producers has so far not appeared in Brazil, except in the area of sugar production. Thus, in Brazil, in the agricultural census of 2017, only 18 per cent of farms with 14 per cent of all farm lands were used by renters. In the key soybean state of Mato Grosso, the owner-producer of farm land accounted for 85 per cent of the farms and 86 per cent of the land (IBGE, Sidra Tabela 6,635).
In both Argentina and Brazil, export agricultural production, particularly soybeans, is made by producers fully integrated into the international market using modern agriculture techniques and totally dependent on international prices. In both countries, international companies have developed complex value chains and arranged contract sales for a large part of the soybean production. Most of these international companies operate in both Argentina and Brazil, and have turned the whole production and export of this crop into a far more internationally influenced system of production and sales. Finally, Brazilian and Argentine producers are agricultural entrepreneurs, capitalised and seeking areas able to expand their production, occupying new areas on the agricultural frontier of both countries. Many of these producers are not bound by political borders and have expanded into the neighbouring states of Uruguay, Paraguay and Bolivia to create a modern soybean frontier whose centre of gravity is Brazil. This Soybean Frontier now accounts for over half of world production and dominates the world market.
ACKNOWLEDGEMENTS
We would like to thank the anonymous readers for their helpful suggestions.


